. 2023 Sep 7;6(3):e1279.
doi: 10.1002/jsp2.1279. eCollection 2023 Sep.

Preclinical to clinical translation for intervertebral disc repair: Effects of species-specific scale, metabolism, and matrix synthesis rates on cell-based regeneration

Affiliations

Preclinical to clinical translation for intervertebral disc repair: Effects of species-specific scale, metabolism, and matrix synthesis rates on cell-based regeneration

Emily E McDonnell et al. JOR Spine. .

Abstract

Background: A significant hurdle for potential cell-based therapies is the subsequent survival and regenerative capacity of implanted cells. While many exciting developments have demonstrated promise preclinically, cell-based therapies for intervertebral disc (IVD) degeneration fail to translate equivalent clinical efficacy.

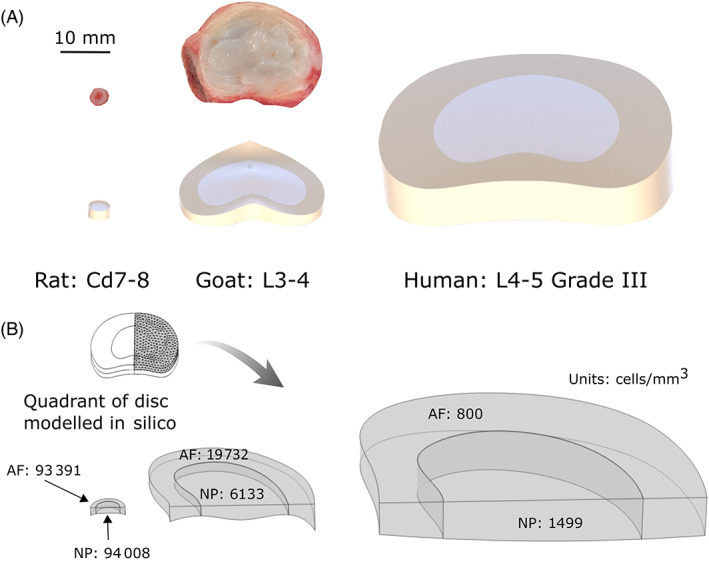
Aims: This work aims to ascertain the clinical relevance of both a small and large animal model by experimentally investigating and comparing these animal models to human from the perspective of anatomical scale and their cellular metabolic and regenerative potential.

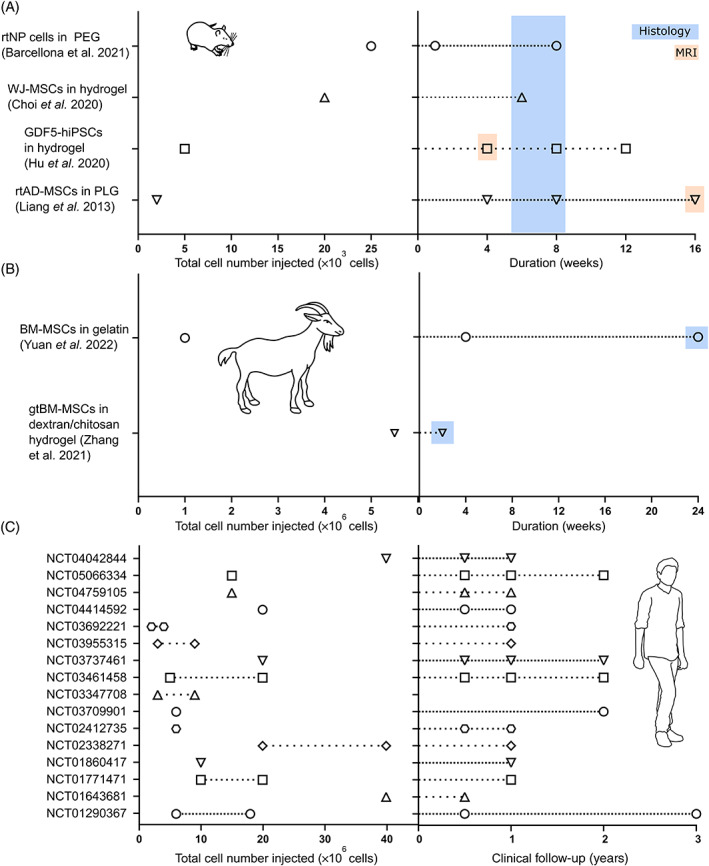
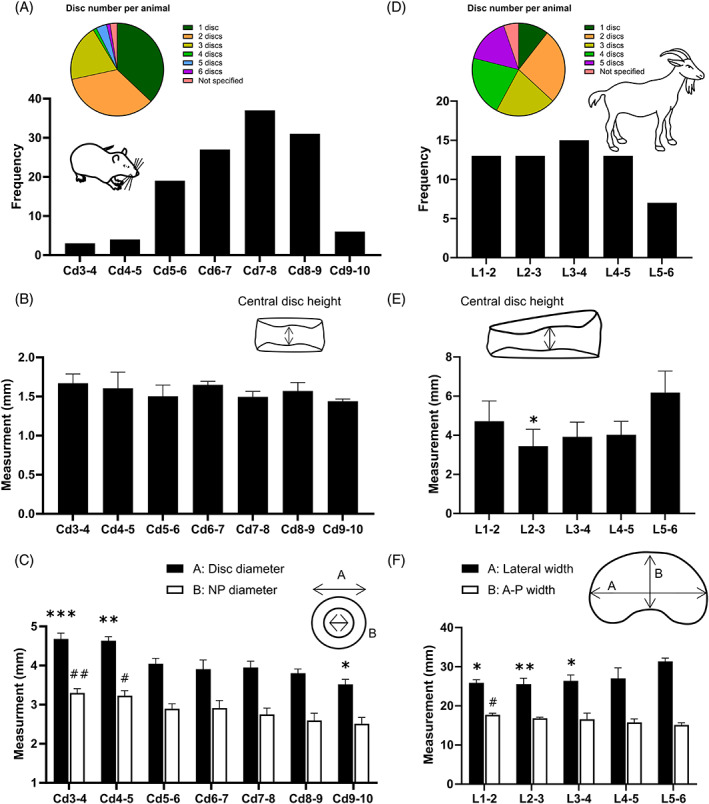
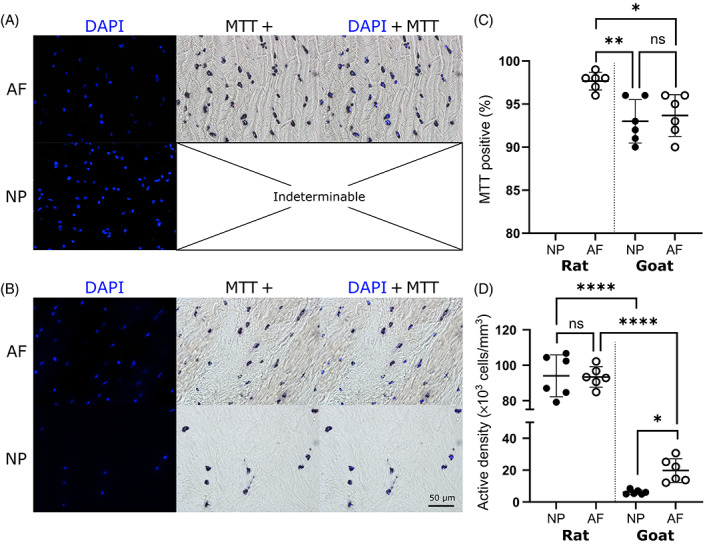
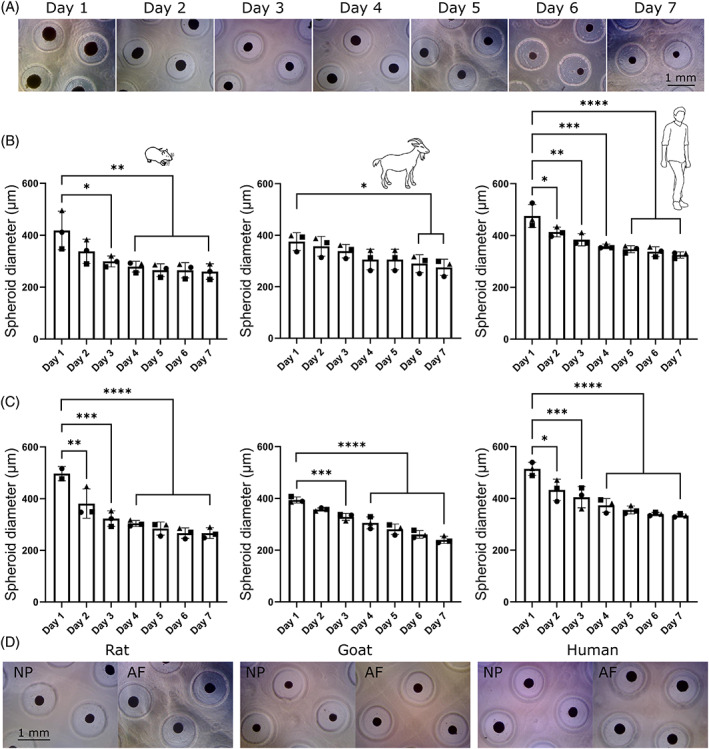
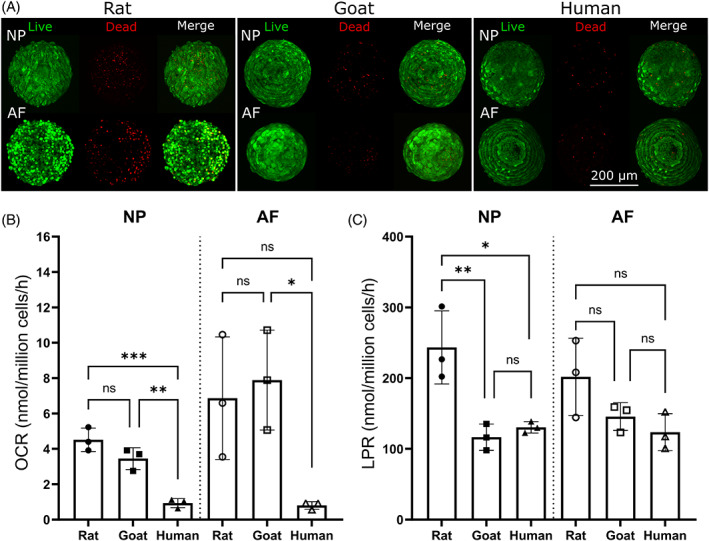
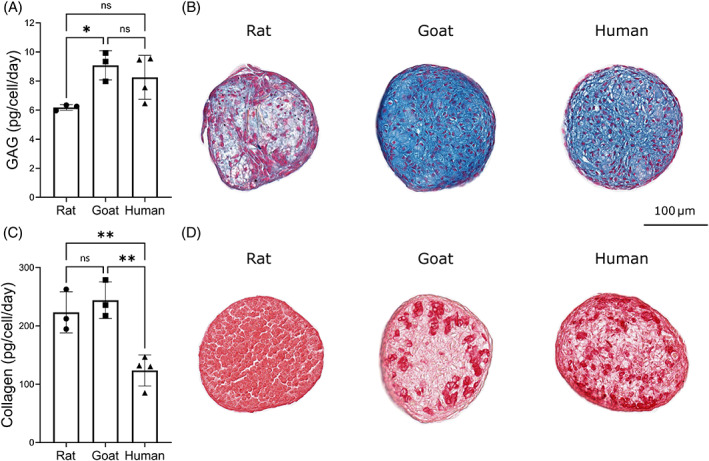
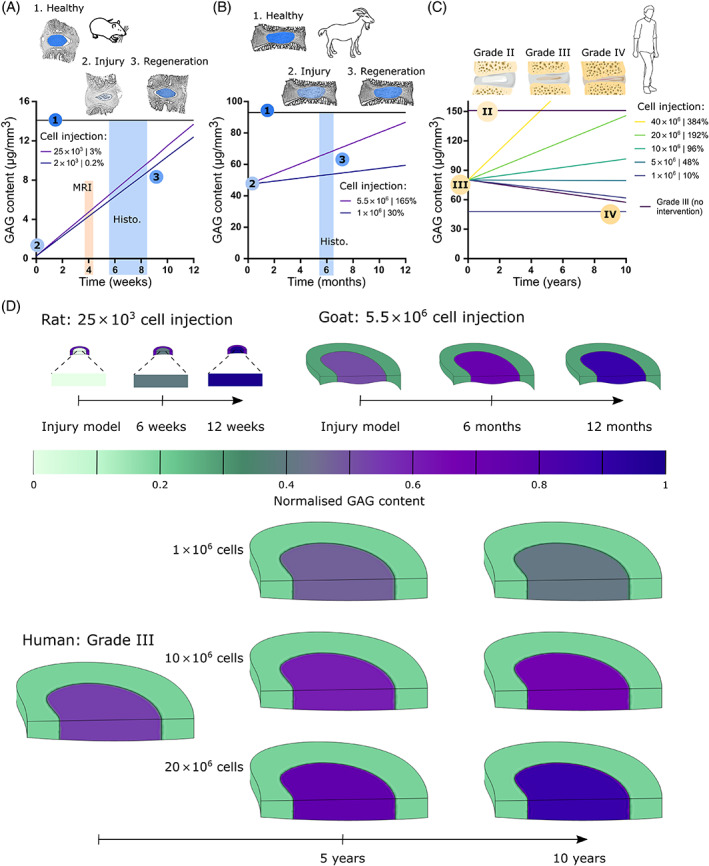
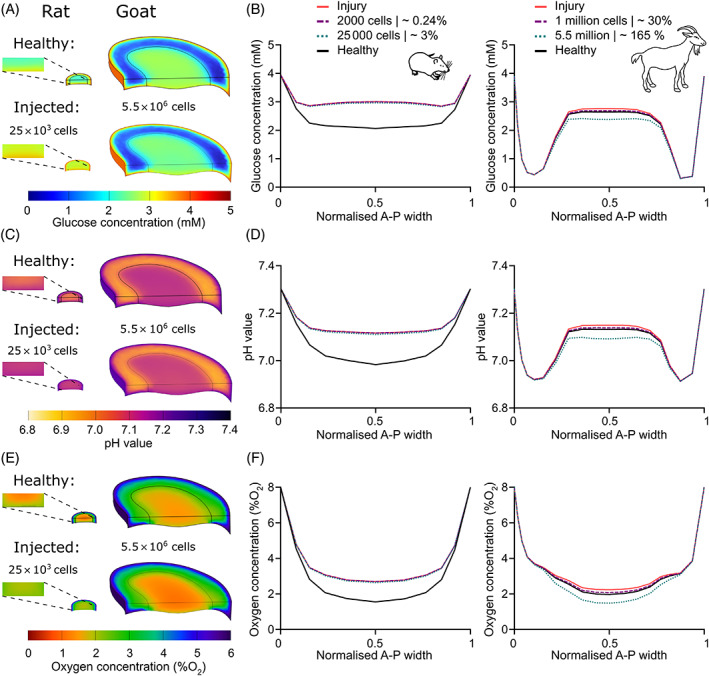
Materials and methods: First, this work experimentally investigated species-specific geometrical scale, native cell density, nutrient metabolism, and matrix synthesis rates for rat, goat, and human disc cells in a 3D microspheroid configuration. Second, these parameters were employed in silico to elucidate species-specific nutrient microenvironments and predict differences in temporal regeneration between animal models.

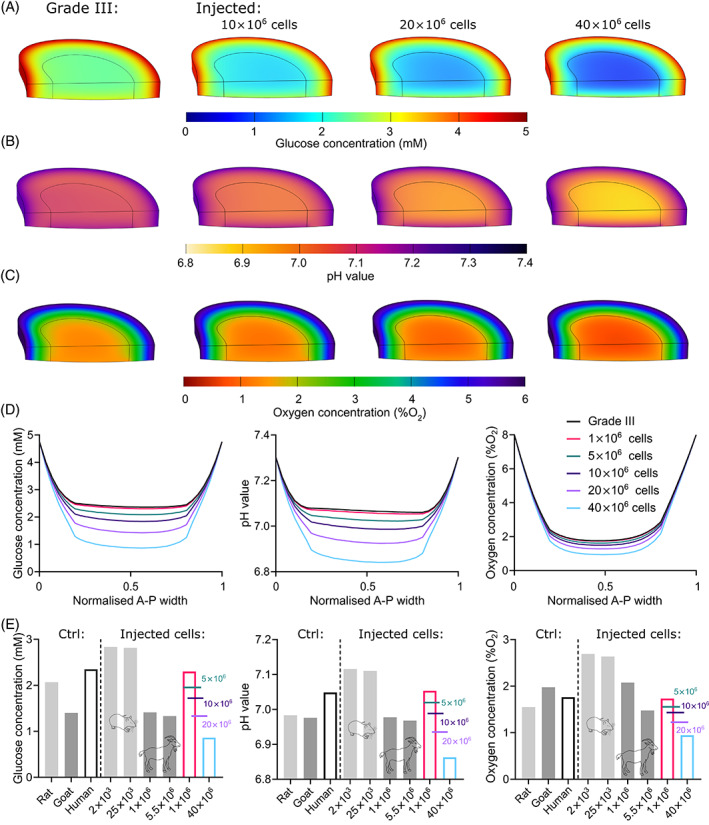
Results: This work presents in silico models which correlate favorably to preclinical literature in terms of the capabilities of animal regeneration and predict that compromised nutrition is not a significant challenge in small animal discs. On the contrary, it highlights a very fine clinical balance between an adequate cell dose for sufficient repair, through de novo matrix deposition, without exacerbating the human microenvironmental niche.

Discussion: Overall, this work aims to provide a path towards understanding the effect of cell injection number on the nutrient microenvironment and the "time to regeneration" between preclinical animal models and the large human IVD. While these findings help to explain failed translation of promising preclinical data and the limited results emerging from clinical trials at present, they also enable the research field and clinicians to manage expectations on cell-based regeneration.

Conclusion: Ultimately, this work provides a platform to inform the design of clinical trials, and as computing power and software capabilities increase in the future, it is conceivable that generation of patient-specific models could be used for patient assessment, as well as pre- and intraoperative planning.

Keywords: animal models; cell therapies; in silico; metabolism; regeneration.


Conflict of interest statement

Conor T. Buckley is an Editorial Board member of JOR Spine and co‐author of this article. They were excluded from editorial decision‐making related to the acceptance of this article for publication in the journal.

Figures

FIGURE 1
FIGURE 1
Experimental parameters gathered from key preclinical animal models in the literature and registered clinical trials for cell‐based disc regeneration. (A) Total number of cells injected and study duration for four published rat studies, highlighting the timeframe when differences were reported in histological evaluation and MRI assessment. (B) Total number of cells injected and study duration for two published goat studies, again highlighting the timeframe when differences were reported in histological evaluation. (C) Total number of cells injected across 16 registered clinical trials, with several trials using a lower and higher cell dose as indicated with dashed lines. Clinical follow‐up time points refer to functional assessment only using MRI. Abbreviations: BM‐MSCs, bone marrow‐derived mesenchymal stem cells; GDF‐5, growth differentiation factor‐5; gtBM‐MSCs, goat BM‐MSCs; hiPSCs, human induced pluripotent stem cells; PEG, polyethylene glycol; PLG, poly(lactic‐co‐glycolic acid); rtAD‐MSCs, rat adipose‐derived mesenchymal stem cells; rtNP, rat nucleus pulposus cells; WJ‐MSCs, Wharton's Jelly‐derived mesenchymal stromal cells.
FIGURE 2
FIGURE 2
Rat caudal (Cd7‐8), goat lumbar (L3‐4) and human lumbar (L4‐5 at Grade III) discs presented in scale to one another. (A) Transverse image of a freshly isolated rat and goat disc together with 3D renderings created using measured dimensions. (B) Due to symmetry, only a quadrant of rat, goat and human discs were modeled in silico. Distinct nucleus pulposus (NP) and annulus fibrosus (AF) domains are highlighted together with their modeled native cell densities. Rat and goat cell densities were determined experimentally within this work, while human data were obtained from the literature and is specific to Grade III degeneration.
FIGURE 3
FIGURE 3
Geometrical analysis of rat caudal level Cd3‐4 to Cd9‐10 and goat lumbar level L1‐2 to L5‐6. (A) Literature search results for the number of discs per animal and frequency of caudal levels used in published rat tail studies. (B) Experimentally measured central disc height for 8‐week‐old Wistar rats (N = 6), with no statistical significance found between Cd7‐8 (most frequently used) and all other levels within this range. (C) Corresponding external disc diameter and internal nucleus pulposus (NP) diameter. Statistics indicate a significant difference to Cd7‐8 full disc (*) and NP (#) diameter with p < 0.05. (D) Literature search results for the number of discs per animal and frequency of lumbar levels used in published goat studies. (E) Experimentally measured central disc height for skeletally mature Saanen goats (N = 3), a significant difference was only found between L2‐3 and L5‐6 (least frequently used). (F) Corresponding lateral and anterior to posterior (A‐P) width. Statistics indicate a significant difference to L5‐6 lateral (*) and A‐P (#) width.
FIGURE 4
FIGURE 4
Experimentally determined metabolically active cell density for the nucleus pulposus (NP) and annulus fibrosus (AF) of rat caudal and goat lumbar discs. (A) Native rat and (B) goat tissue fluorescently 4′,6‐diamidino‐2‐phenylindole (DAPI) stained to indicate the nuclei of all cells and methylthiazolyldiphenyl‐tetrazolium bromide (MTT) brightfield imaged to identify colocalized formazan crystal deposition around metabolically active cells. (C) Percentage of cells quantified as MTT positive, with rat AF tissue determined as significantly higher than goat AF (p = 0.013) and NP (p = 0.004) while no significant difference was determined between goat AF and NP (p = 0.849). MTT+ visualization within rat NP was not feasible due to the highly gelatinous composition. (D) Species‐specific metabolically active cell density, assuming a similar percentage of MTT positive cells in rat NP as determined in the AF. No significance was found between rat NP and AF cell density (p = 0.999), while goat AF had a significantly higher cell density than NP (p = 0.026). Additionally, it was determined that rat tissue has a significantly greater cell population than the corresponding region of goat tissue (p < 0.0001).
FIGURE 5
FIGURE 5
Temporal assessment of disc spheroids (nucleus pulposus [NP] and annulus fibrosus [AF]) from rat, goat, and human over a 7‐day culture period. (A) Example of daily microscopic images showing rat NP spheroids within agarose microwells. (B) Quantification of spheroid diameters for rat, goat, and human NP cells. Rat spheroids became statistically different to Day 1 at Day 3 (p = 0.012), goat at Day 6 (p = 0.045), and human at Day 2 (p = 0.024). (C) Quantification of spheroid diameters for rat, goat, and human AF cells. Rat spheroids became statistically different to Day 1 at Day 2 (p = 0.005), goat at Day 3 (p = 0.0007), and human at Day 2 (p = 0.0101). (D) Microscopic images of both NP and AF spheroids from rat, goat, and human after 7 days.
FIGURE 6
FIGURE 6
Viability assessment and measured metabolic rates of nucleus pulposus (NP) and annulus fibrosus (AF) spheroids from rat, goat, and human. (A) Spheroids were assessed using Live/Dead staining to ensure viability remained high prior to carrying out metabolic rate measurements. (B) Oxygen consumption rates (OCR) and (C) lactate production rates (LPR) for disc cells assessed in a 3D spheroid configuration (N = 3). Human NP cells had a significantly lower OCR than rat NP (p = 0.0005) and goat NP (p = 0.0031), while human AF was only significantly lower than goat AF (p = 0.0352). Rat NP cells had a significantly higher LPR than goat NP (p = 0.0068) and human NP (p = 0.0119), while no significant differences were detected for AF cells.
FIGURE 7
FIGURE 7
Species‐specific matrix synthesis rates and histological evaluation of nucleus pulposus (NP) micro‐spheroids. (A) Glycosaminoglycan (GAG) production rates for rat (N = 3), goat (N = 3), and human NP cells (N = 4) over a 2‐week period. Rat NP cells had a significantly lower production rate than goat NP cells (p = 0.0385). (B) Corresponding histological evaluation using alcian blue (AB) to stain for GAG. (C) Collagen production rates for rat (N = 3), goat (N = 3), and human NP cells (N = 4) over a 2‐week period. Collagen production rates for human NP cells were significantly lower than both rat (p = 0.0093) and goat (p = 0.0033) NP cells. (D) Corresponding histological evaluation using picrosirius red (PSR) to stain for collagen.
FIGURE 8
FIGURE 8
Predicted glycosaminoglycan (GAG) matrix regeneration in the nucleus pulposus (NP) of a pre‐clinical rat model, goat model and human clinical trials for cell‐based therapies. (A) Predicted GAG regeneration in a rat degeneration model injected with 2 × 103 (0.2% of healthy NP cell population) or 25 × 103 (3% of healthy NP cell population) cells over a 12‐week study. The shaded regions either indicate when MRI signal has been reported as significantly higher or histological GAG staining significantly stronger compared with an injured control, in the literature. (B) Predicted GAG regeneration in a goat degeneration model injected with 1 × 106 (30% of healthy NP cell population) or 5.5 × 106 (165% of healthy NP cell population) cells over a 12‐month study. (C) Predicted GAG regeneration in a clinical trial injected with 1 × 106–40 × 106 cells (10%–383% of Grade III NP cell population). (D) A sample of corresponding contour plots for in silico rat (25 × 103 cells), goat (5.5 × 106 cells), and human models of GAG regeneration (geometries presented to scale). GAG is normalized to native/healthy NP content for rat and goat and Grade II content for human.
FIGURE 9
FIGURE 9
Predicted nutrient microenvironments within pre‐clinical rat and goat animal models assessing cell‐based therapies. (A) Predicted glucose distribution across a healthy rat and goat disc compared with an injury model injected with cells. (B) Anterior to posterior (A‐P) profile for glucose, at midheight, through the corresponding in silico models for rat and goat. (C) Predicted pH distribution across a healthy rat and goat disc compared with an injury model injected with cells. (D) A‐P profile for pH, at midheight, through the corresponding in silico models for rat and goat. (E) Predicted oxygen distribution across a healthy rat and goat disc compared with an injury model injected with cells. (F) A‐P profile for oxygen, at midheight, through the corresponding in silico models for rat and goat.
FIGURE 10
FIGURE 10
Predicted nutrient microenvironments within a Grade III human intervertebral disc (IVD) undergoing clinical assessment for a range of injected cell numbers. (A) Predicted glucose, (B) pH, and (C) oxygen distribution across a Grade III human IVD with no treatment or with an injection of 10 × 106, 20 × 106, or 40 × 106 cells. (D) Corresponding anterior to posterior (A‐P) profile of glucose, pH, and oxygen at midheight, through each of the in silico models. (E) Minimum metabolite (glucose, pH and oxygen) concentrations within the NP for both preclinical animal models and clinical human models, under control (ctrl) conditions that is, healthy animal and Grade III human, compared with investigated ranges of cell numbers for each species.

Similar articles

Cited by

References

    1. Smith LJ, Nerurkar NL, Choi K‐S, Harfe BD, Elliott DM. Degeneration and regeneration of the intervertebral disc: lessons from development. Dis Model Mech. 2011;4(1):31‐41. - PMC - PubMed
    1. Tendulkar G, Chen T, Ehnert S, Kaps HP, Nüssler AK. Intervertebral disc nucleus repair: hype or hope? Int J Mol Sci. 2019;20(15):3622. doi:10.3390/ijms20153622 - DOI - PMC - PubMed
    1. Tong W, Lu Z, Qin L, et al. Cell therapy for the degenerating intervertebral disc. Transl Res. 2017;181:49‐58. doi:10.1016/j.trsl.2016.11.008 - DOI - PMC - PubMed
    1. Yan C, Wang X, Xiang C, et al. Applications of functionalized hydrogels in the regeneration of the intervertebral disc. Biomed Res Int. 2021;2021:1‐19. doi:10.1155/2021/2818624 - DOI - PMC - PubMed
    1. Schol J, Sakai D. Comprehensive narrative review on the analysis of outcomes from cell transplantation clinical trials for discogenic low back pain. North Am Spine Soc J. 2023;13:100195. doi:10.1016/j.xnsj.2022.100195 - DOI - PMC - PubMed