. 2023 Sep 15:13:1258321.
doi: 10.3389/fcimb.2023.1258321. eCollection 2023.

Genetic diversification patterns in swine influenza A virus (H1N2) in vaccinated and nonvaccinated animals

Affiliations

Genetic diversification patterns in swine influenza A virus (H1N2) in vaccinated and nonvaccinated animals

Álvaro López-Valiñas et al. Front Cell Infect Microbiol. .

Abstract

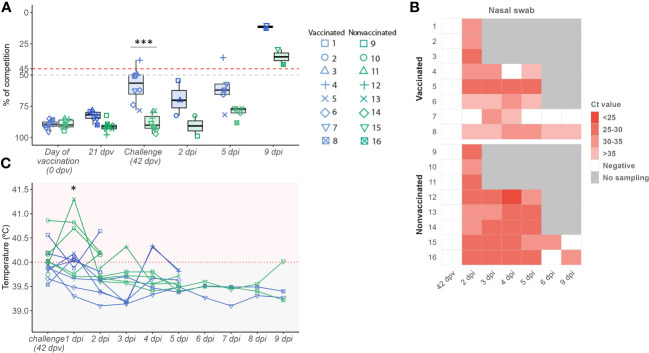
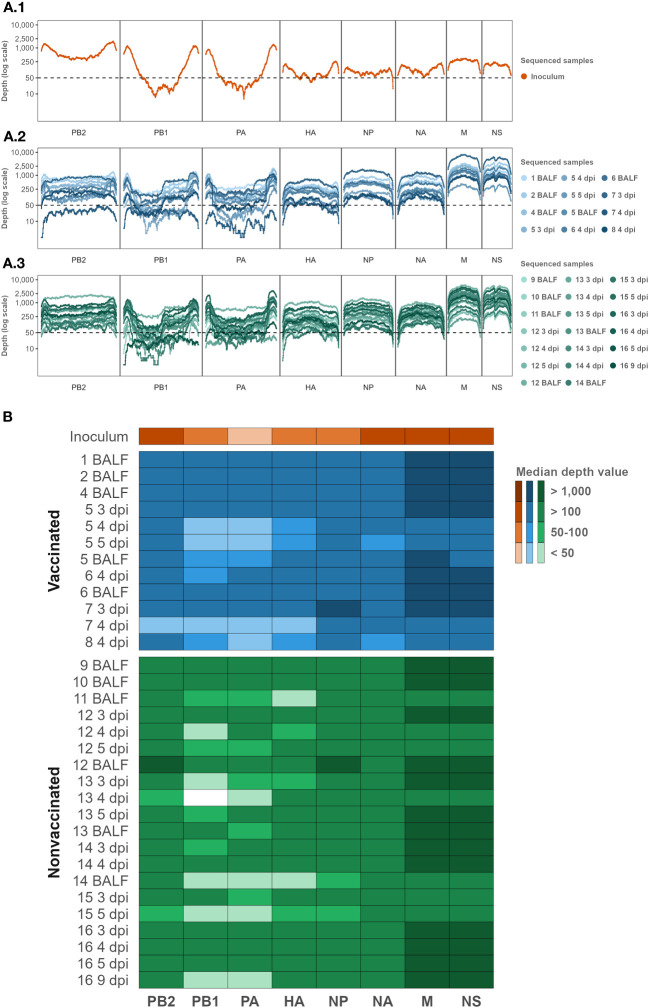
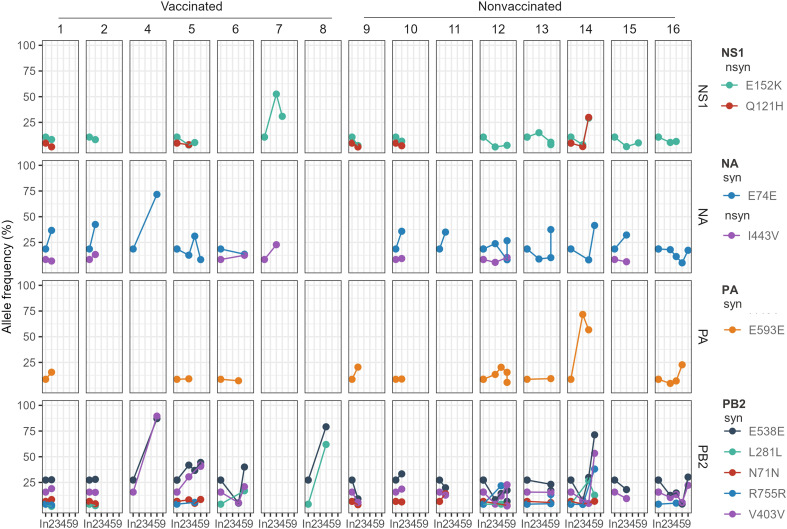
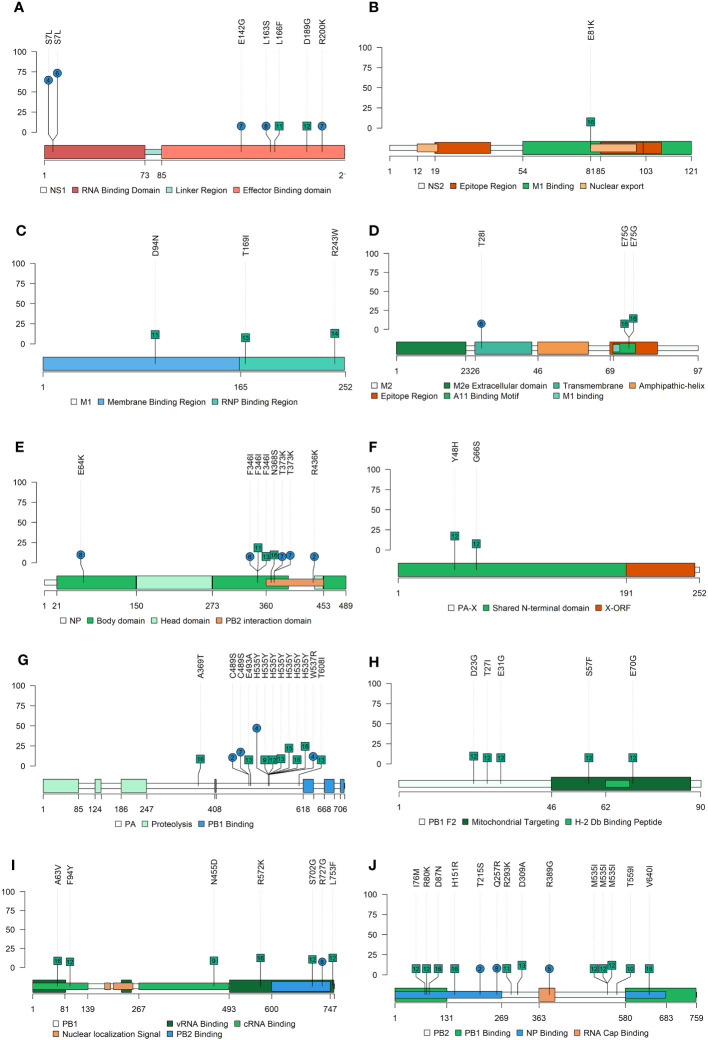
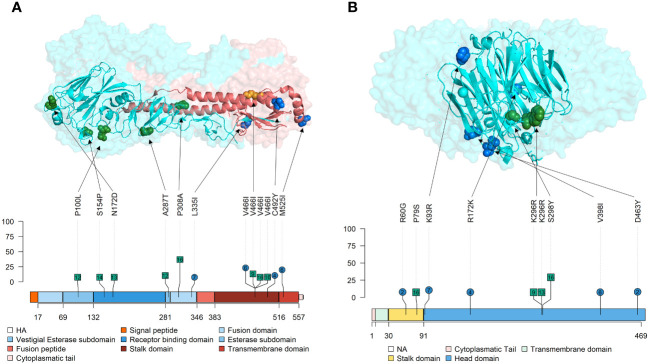
Influenza A viruses (IAVs) are characterized by having a segmented genome, low proofreading polymerases, and a wide host range. Consequently, IAVs are constantly evolving in nature causing a threat to animal and human health. In 2009 a new human pandemic IAV strain arose in Mexico because of a reassortment between two strains previously circulating in pigs; Eurasian "avian-like" (EA) swine H1N1 and "human-like" H1N2, highlighting the importance of swine as adaptation host of avian to human IAVs. Nowadays, although of limited use, a trivalent vaccine, which include in its formulation H1N1, H3N2, and, H1N2 swine IAV (SIAV) subtypes, is one of the most applied strategies to reduce SIAV circulation in farms. Protection provided by vaccines is not complete, allowing virus circulation, potentially favoring viral evolution. The evolutionary dynamics of SIAV quasispecies were studied in samples collected at different times from 8 vaccinated and 8 nonvaccinated pigs, challenged with H1N2 SIAV. In total, 32 SIAV genomes were sequenced by next-generation sequencing, and subsequent variant-calling genomic analysis was carried out. Herein, a total of 364 de novo single nucleotide variants (SNV) were found along all genetic segments in both experimental groups. The nonsynonymous substitutions proportion found was greater in vaccinated animals suggesting that H1N2 SIAV was under positive selection in this scenario. The impact of each substitution with an allele frequency greater than 5% was hypothesized according to previous literature, particularly in the surface glycoproteins hemagglutinin and neuraminidase. The H1N2 SIAV quasispecies evolution capacity was evidenced, observing different evolutionary trends in vaccinated and nonvaccinated animals.

Keywords: NGS; quasispecies; swine influenza virus; vaccination; viral evolution.


Conflict of interest statement

The authors declare that the research was conducted in the absence of any commercial or financial relationships that could be construed as a potential conflict of interest.

Figures

Figure 1
Figure 1
Evaluation of the vaccine effect through humoral response, viral replication, and pig rectal temperature profile. (A) SIAV NP antibody titres boxplot. The percentage of competition is expressed in the ordinate axis. Boxplot whiskers show quartile variability. Values below 50% (grey line) are considered negative, while values above 45% (red line) are considered positive. Values between both lines are considered doubtful. (B) SIAV detection in nasal swab samples heatmap. In the y-axis, each ID animal number from both experimental groups is indicated. The heat map shows cells with different red intensities, from the darkest to the lightest, indicating a range of viral loads from higher to lower, respectively depending on the Ct value obtained per nasal swab sample. White cells represent SIAV negative samples (Ct values > 40) meanwhile, grey ones indicate no sample was collected at that time point. (C) Pig rectal temperature kinetics after SIAV challenge. The temperature measured in °C is represented in the ordinate axis. Horizontal lines represent the temperature profile of each pig over time. Pigs with values above 40°C were considered to have fever. In all figures, the sampling time is indicated in the abscissa axis. Vaccinated, and nonvaccinated animals are represented in blue and green dots, boxplots, and lines, respectively. Besides, the dot shape and number indicate each animal ID. * p < 0.05 and *** p < 0.0001. Paired t-test was used for statistical analysis.
Figure 2
Figure 2
Inoculum, vaccinated, and nonvaccinated NGS sequencing profile samples per genomic segment in terms of depth and coverage. (A) The Illumina sequencing profile of SIAV H1N2 is plotted in orange (A1). The Illumina profiles of samples collected from vaccinated and nonvaccinated animals are represented in different tones of blues (A2) and greens (A3), respectively. In the abscissa axis, the SIAV genomic segments and each position are represented. In the ordinate axis, the depth of reading is represented in the logarithm scale. (B) Median depth value per sample per genomic segment Heat map. The darker colors in the heat map represent higher median depth values; on the contrary, the lighter ones represent a lower value. Inoculum, vaccinated, and nonvaccinated samples are represented in orange, blue, and green respectively. The sequenced samples are represented in the y-axis, where the name indicates the pig ID and the day of sample collection. BALF samples were collected on the day of each pig necropsy. The SIAV genomic segments are indicated on the x-axis.
Figure 3
Figure 3
Allele frequencies evolution of H1N2 inoculum SNVs over time in pig sequenced samples. The SNV allele frequency percentage is represented in the y-axis. The time is represented in the x-axis, where “In.” is the day of the inoculation, and 2, 3, 4, 5, and 9 are the days post-inoculation. Each animal and genomic segment are represented in columns and rows, respectively. Dots show SNV detection plotted in different colors, while lines join the same mutation detected at different time points in the same animal. nsyn (Nonsynonymous) and syn (Synonymous).
Figure 4
Figure 4
De novo H1N2 SNVs detected in samples collected from Vaccinated and nonvaccinated animals after challenge. (A) Synonymous and non-synonymous SNVs proportion bars with allele frequencies greater or equal to 2.5, 5, 7.5, and 10 per group. The total number of variants found and the percentage that it represents by type of variant, group, and allele frequency studied are indicated. (B) H1N2 de novo SNV allocation bubble plot representation with an allele frequency greater than 1 (B.1) and 5% (B.2). The bubble size proportionally represents the total number of SNVs found per genome segment (x-axis) and sequenced sample (y-axis). Synonymous and nonsynonymous substitutions are represented in light and dark orange, respectively.
Figure 5
Figure 5
Nonsynonymous SNV allocation on SIAV proteins lolliplot representation. Substitutions found in NS1 (A), NS2 (B), M1 (C), M2 (D), NP (E), PA (F), PA-X (G), PB2-F2 (H), PB1 (I) and PB2 (J) proteins with an allele frequency greater than 5%. In ordinate axis, the allele frequency of each substitution is indicated. Substitutions noted in blue circles and green squares show substitutions found in vaccinated and nonvaccinated animals, respectively. Number inside each shape indicates the pig ID of each reported substitution. Figure legends indicate the most important domains of each protein.
Figure 6
Figure 6
Location of nonsynonymous SNVs found with an allele frequency greater than 5% on Tri-Dimensional and Lolliplot surface SIAV glycoproteins HA and NA representation. (A) HA trimer (PDB accession no. 3LZG (Xu et al., 2010)). HA1 domains are represented in blue, while HA2 ones are represented in red colors. (B) NA tetramer (PDB accession no. 4B7Q (van der Vries et al., 2012)). In lolliplot representation, substitutions found in vaccinated and nonvaccinated animals are represented in blue circles and green squares, respectively. The numbers within each mutation marked on the lolliplot show the animal in which it was detected. The numbers below each protein representation indicate the amino acid boundaries between the different domains. The allele frequency at which each substitution was reported is indicated in the ordinate axis.
Figure 7
Figure 7
Nucleotide diversity (π) over time and per genomic segment. Boxplots indicate means, lower and upper quartile, and standard deviation. The π represented in blue and green colors correspond to samples collected from vaccinated and nonvaccinated animals, respectively. No significant differences were found. ANOVA test was used for statistical analysis.

Similar articles

Cited by

References

    1. Ahlquist P. (2002). RNA-dependent RNA polymerases, viruses, and RNA silencing. Science 296, 1270–1273. doi: 10.1126/SCIENCE.1069132 - DOI - PubMed
    1. Andrews S. (2010) FastQC: A Quality Control Tool for High Throughput Sequence Data. Available at: https://www.bioinformatics.babraham.ac.uk/projects/fastqc/ (Accessed September 1, 2021).
    1. Aragón T., de la Luna S., Novoa I., Carrasco L., Ortín J., Nieto A. (2000). Eukaryotic translation initiation factor 4GI is a cellular target for NS1 protein, a translational activator of influenza virus. Mol. Cell Biol. 20, 6259–6268. doi: 10.1128/MCB.20.17.6259-6268.2000 - DOI - PMC - PubMed
    1. Baratelli M., Córdoba L., Pérez L. J., Maldonado J., Fraile L., Núñez J. I., et al. (2014). Genetic characterization of influenza A viruses circulating in pigs and isolated in north-east Spain during the period 2006-2007. Res. Vet. Sci. 96, 380–388. doi: 10.1016/J.RVSC.2013.12.006 - DOI - PubMed
    1. Bolger A. M., Lohse M., Usadel B. (2014). Trimmomatic: a flexible trimmer for Illumina sequence data. Bioinformatics 30, 2114–2120. doi: 10.1093/bioinformatics/btu170 - DOI - PMC - PubMed

Publication types