

RHOJ Induces Epithelial-to-Mesenchymal Transition by IL-6/STAT3 to Promote Invasion and Metastasis in Gastric Cancer
- PMID: 37781036
- PMCID: PMC10535698
- DOI: 10.7150/ijbs.81972
RHOJ Induces Epithelial-to-Mesenchymal Transition by IL-6/STAT3 to Promote Invasion and Metastasis in Gastric Cancer
Abstract
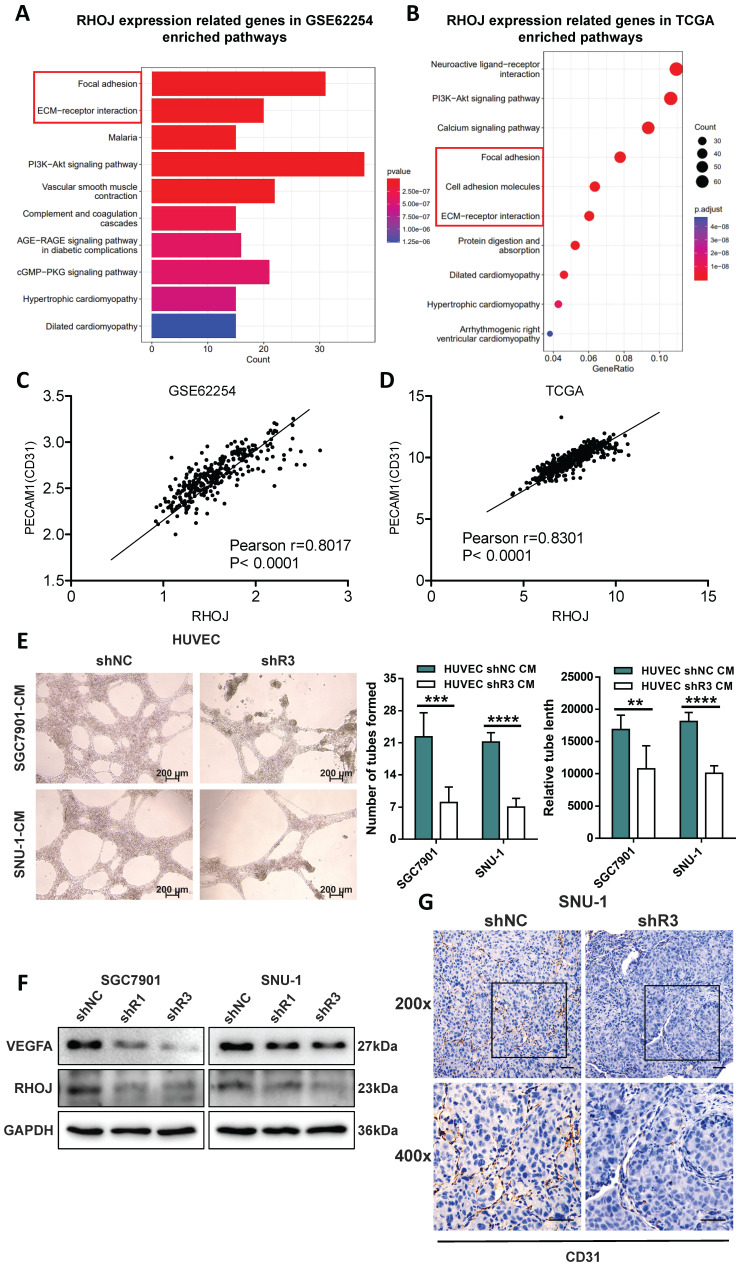
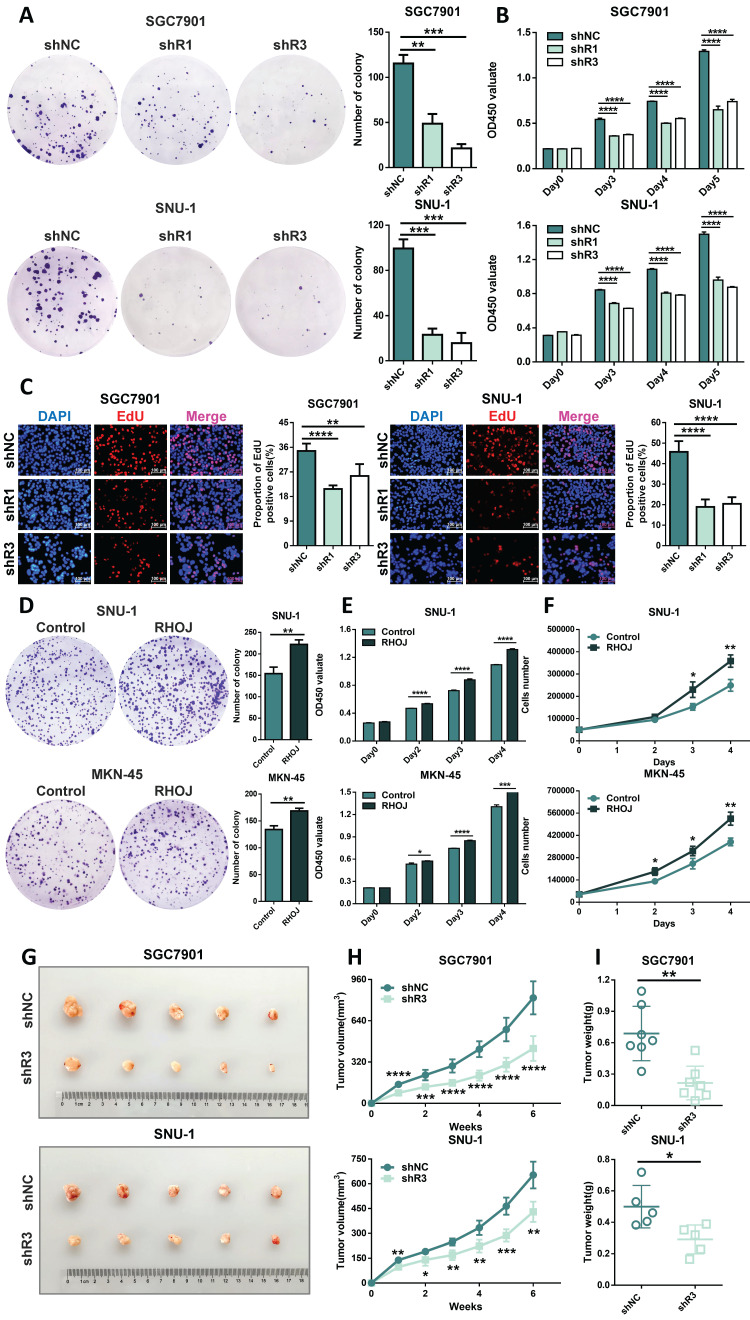
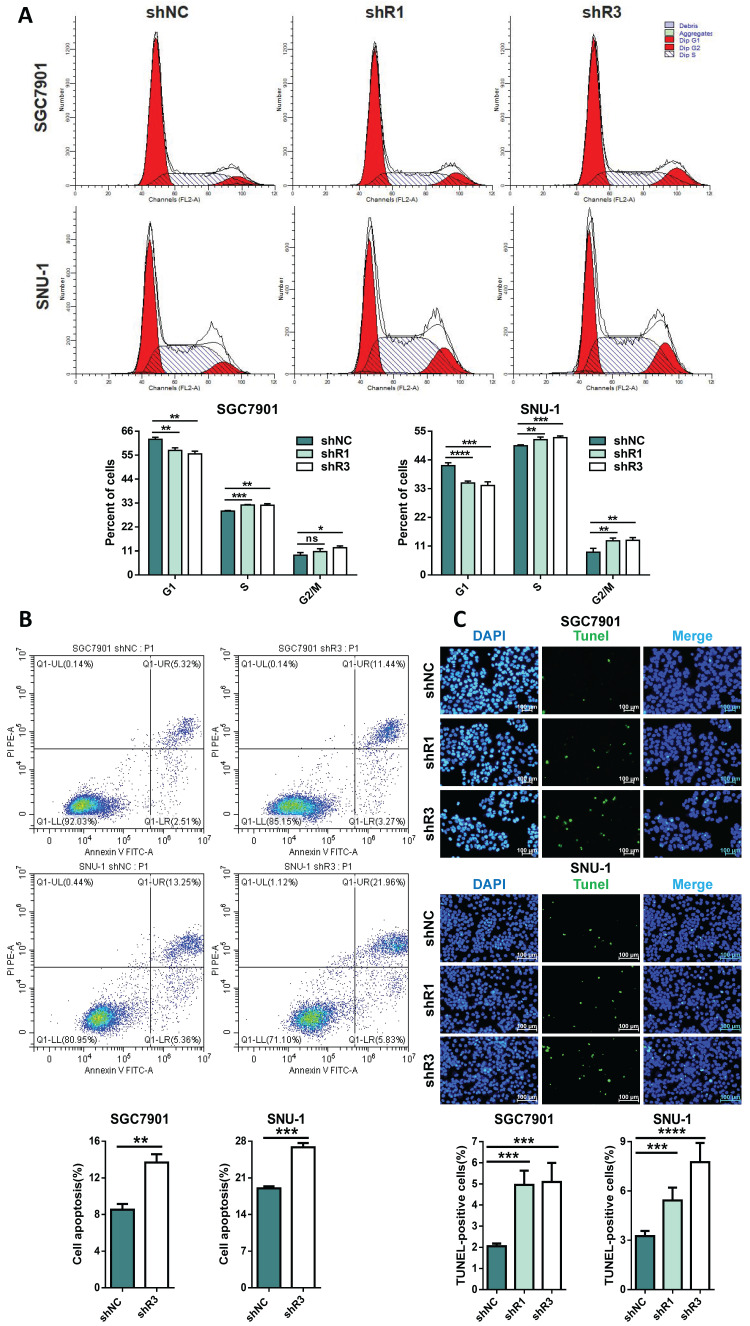
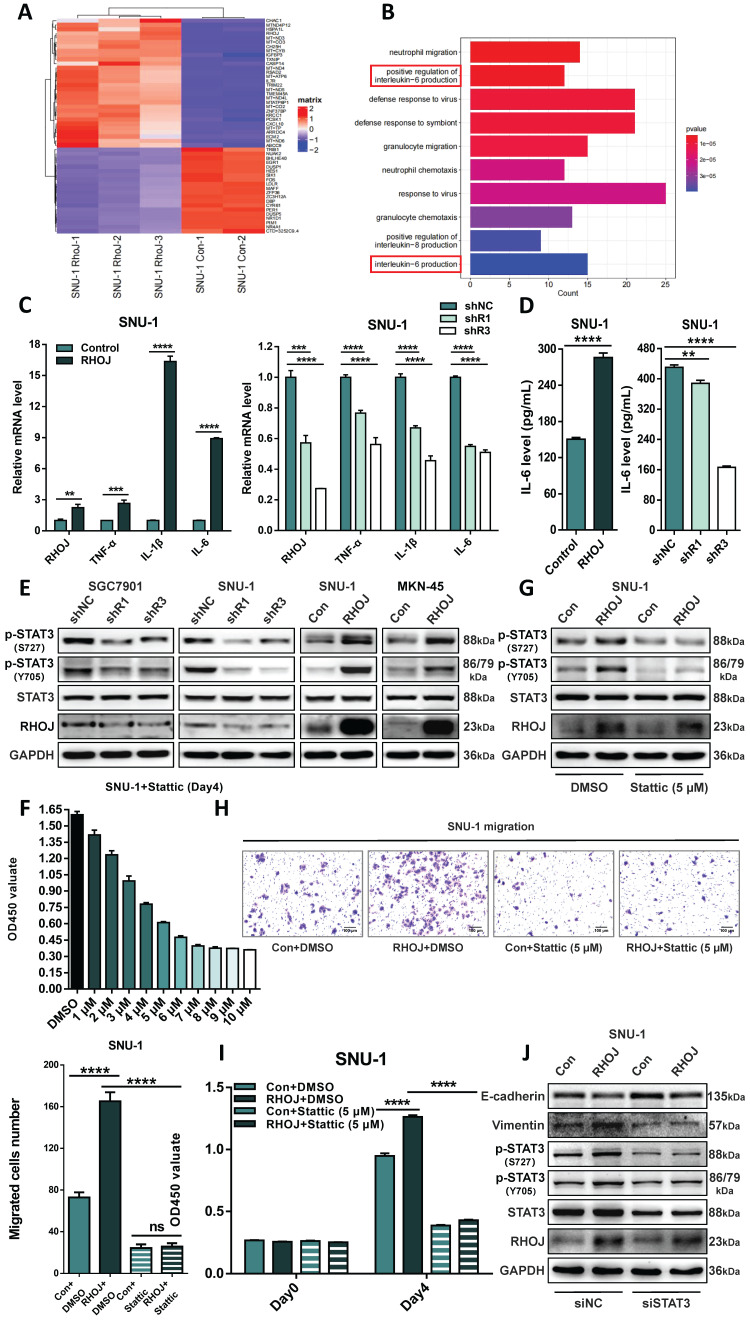
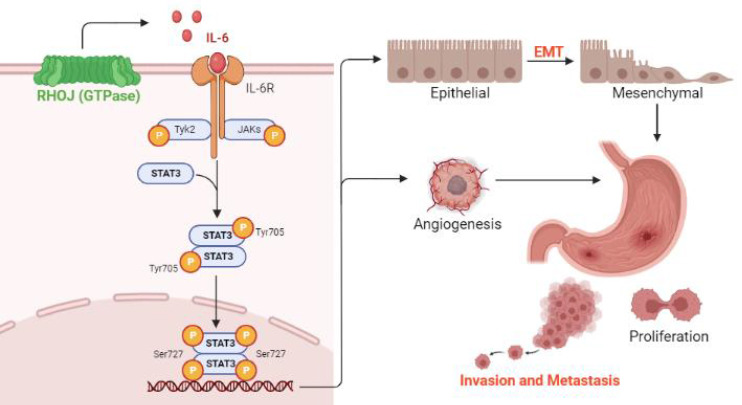
Background: Recently, the molecular classification of gastric cancer (GC) promotes the advances of GC patients' precision therapy and prognosis prediction. According to the Asian Cancer Research Group (ACRG), GC is classified as microsatellite instable (MSI) subtype GC, microsatellite stable/epithelial-to-mesenchymal transition (MSS/EMT) subtype GC, MSS/TP53- subtype GC, and MSS/TP53+ subtype GC. Due to the easy metastasis of EMT-subtype GC, it has the worst prognosis, the highest recurrence rate, and the tendency to occur at a younger age. Therefore, it is curious and crucial for us to understand the molecular basis of EMT-subtype GC. Methods: The expression of RHOJ was detected by quantitative real-time PCR (qPCR) and immunohistochemistry (IHC) in GC cells and tissues. Western blotting and immunofluorescence (IF) were conducted to examine the effects of RHOJ on the EMT markers' expression of GC cells. The GC cells' migration and invasion were investigated by transwell assay. The tumor growth and metastasis were demonstrated correspondingly in different xenograft models. Results: Firstly, it was noticed that RHOJ was significantly upregulated in EMT-subtype GC and RHOJ has close relationships with the EMT process of GC, based on the Gene Expression Omnibus (GEO) and the Cancer Genome Atlas (TCGA) databases. Next, transwell assay and tail vein metastasis models were conducted to verify that RHOJ mediates the EMT to regulate the invasion and metastasis of GC in vitro and in vivo. In addition, weakened tumor angiogenesis was observed after RHOJ knockdown by the angiogenesis assay of HUVEC. RNA-seq and further study unveiled that RHOJ aggravates the malignant progression of GC by inducing EMT through IL-6/STAT3 to promote invasion and metastasis. Finally, blocking the IL-6/STAT3 signaling overcame RHOJ-mediated GC cells' growth and migration. Conclusions: These results indicate that the upregulation of RHOJ contributes to EMT-subtype GC invasion and metastasis via IL-6/STAT3 signaling, and RHOJ is expected to become a promising biomarker and therapeutic target for EMT-subtype GC patients.
Keywords: EMT; Gastric Cancer; IL-6/STAT3 signaling; Metastasis; RHOJ.
© The author(s).
Conflict of interest statement
Competing Interests: The authors have declared that no competing interest exists.
Figures


Similar articles
-
RhoJ: an emerging biomarker and target in cancer research and treatment.Cancer Gene Ther. 2024 Oct;31(10):1454-1464. doi: 10.1038/s41417-024-00792-6. Epub 2024 Jun 10. Cancer Gene Ther. 2024. PMID: 38858534 Review.
-
Interleukin-23 promotes the migration and invasion of gastric cancer cells by inducing epithelial-to-mesenchymal transition via the STAT3 pathway.Biochem Biophys Res Commun. 2018 May 5;499(2):273-278. doi: 10.1016/j.bbrc.2018.03.144. Epub 2018 Mar 24. Biochem Biophys Res Commun. 2018. PMID: 29574157
-
Suppression of BMX-ARHGAP fusion gene inhibits epithelial-mesenchymal transition in gastric cancer cells via RhoA-mediated blockade of JAK/STAT axis.J Cell Biochem. 2019 Jan;120(1):439-451. doi: 10.1002/jcb.27400. Epub 2018 Sep 14. J Cell Biochem. 2019. Retraction in: J Cell Biochem. 2021 Nov;122 Suppl 1:S119. doi: 10.1002/jcb.30099. PMID: 30216523 Retracted.
-
Repression of RhoJ expression promotes TGF-β-mediated EMT in human non-small-cell lung cancer A549cells.Biochem Biophys Res Commun. 2021 Aug 20;566:94-100. doi: 10.1016/j.bbrc.2021.06.004. Epub 2021 Jun 10. Biochem Biophys Res Commun. 2021. PMID: 34119829
-
Role of STAT3 in cancer cell epithelial‑mesenchymal transition (Review).Int J Oncol. 2024 May;64(5):48. doi: 10.3892/ijo.2024.5636. Epub 2024 Mar 15. Int J Oncol. 2024. PMID: 38488027 Free PMC article. Review.
Cited by
-
Epithelial-mesenchymal plasticity in cancer: signaling pathways and therapeutic targets.MedComm (2020). 2024 Aug 1;5(8):e659. doi: 10.1002/mco2.659. eCollection 2024 Aug. MedComm (2020). 2024. PMID: 39092293 Free PMC article. Review.
-
Chemotherapy Options for Locally Advanced Gastric Cancer: A Review.Cancers (Basel). 2025 Feb 26;17(5):809. doi: 10.3390/cancers17050809. Cancers (Basel). 2025. PMID: 40075656 Free PMC article. Review.
-
ZC3H13 mediates N6-methyladenosine modification of SNTB1 to promote epithelial-mesenchymal transition in gastric cancer.Cell Death Dis. 2025 Aug 7;16(1):596. doi: 10.1038/s41419-025-07889-2. Cell Death Dis. 2025. PMID: 40774945 Free PMC article.
-
Molecular Insight into Gastric Cancer Invasion-Current Status and Future Directions.Cancers (Basel). 2023 Dec 21;16(1):54. doi: 10.3390/cancers16010054. Cancers (Basel). 2023. PMID: 38201481 Free PMC article. Review.
-
RhoJ: an emerging biomarker and target in cancer research and treatment.Cancer Gene Ther. 2024 Oct;31(10):1454-1464. doi: 10.1038/s41417-024-00792-6. Epub 2024 Jun 10. Cancer Gene Ther. 2024. PMID: 38858534 Review.
References
-
- Sung H, Ferlay J, Siegel R L. et al. Global Cancer Statistics 2020: GLOBOCAN Estimates of Incidence and Mortality Worldwide for 36 Cancers in 185 Countries. CA Cancer J Clin. 2021;71(3):209–249. - PubMed
-
- Allemani C, Matsuda T, Di Carlo V. et al. Global surveillance of trends in cancer survival 2000-14 (CONCORD-3): analysis of individual records for 37 513 025 patients diagnosed with one of 18 cancers from 322 population-based registries in 71 countries. Lancet. 2018;391(10125):1023–1075. - PMC - PubMed
Publication types
MeSH terms
Substances
LinkOut - more resources
Full Text Sources
Medical
Molecular Biology Databases
Research Materials
Miscellaneous
