. 2023 Sep 16;2(10):pgad305.
doi: 10.1093/pnasnexus/pgad305. eCollection 2023 Oct.

Vascular endothelial cell-specific disruption of the profilin1 gene leads to severe multiorgan pathology and inflammation causing mortality

Affiliations

Vascular endothelial cell-specific disruption of the profilin1 gene leads to severe multiorgan pathology and inflammation causing mortality

Abigail Allen-Gondringer et al. PNAS Nexus. .

Abstract

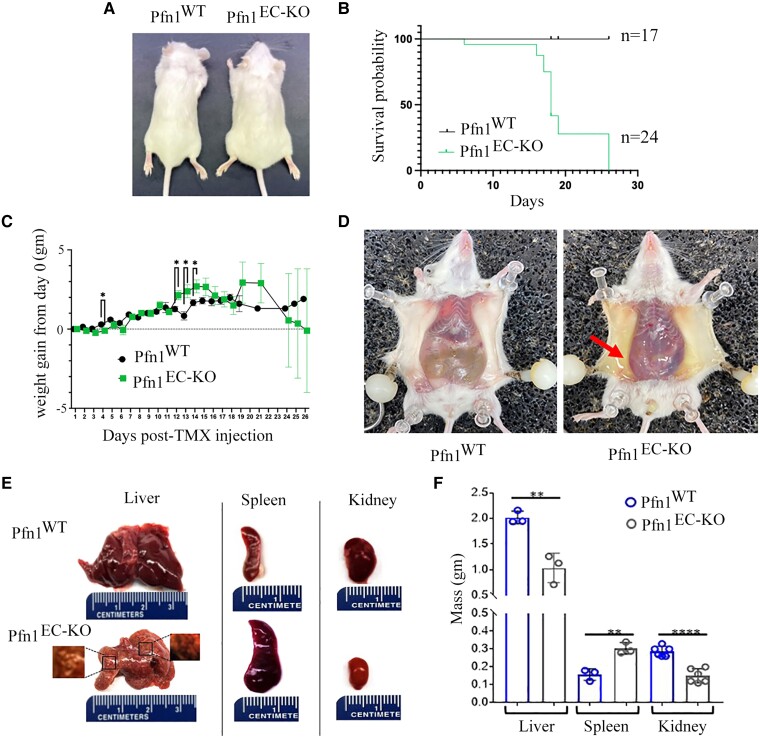
Actin-binding protein Profilin1 is an important regulator of actin cytoskeletal dynamics in cells and critical for embryonic development in higher eukaryotes. The objective of the present study was to examine the consequence of loss-of-function of Pfn1 in vascular endothelial cells (ECs) in vivo. We utilized a mouse model engineered for tamoxifen-inducible biallelic inactivation of the Pfn1 gene selectively in EC (Pfn1EC-KO). Widespread deletion of EC Pfn1 in adult mice leads to severe health complications presenting overt pathologies (endothelial cell death, infarct, and fibrosis) in major organ systems and evidence for inflammatory infiltrates, ultimately compromising the survival of animals within 3 weeks of gene ablation. Mice deficient in endothelial Pfn1 exhibit selective bias toward the proinflammatory myeloid-derived population of immune cells, a finding further supported by systemic elevation of proinflammatory cytokines. We further show that triggering Pfn1 depletion not only directly upregulates proinflammatory cytokine/chemokine gene expression in EC but also potentiates the paracrine effect of EC on proinflammatory gene expression in macrophages. Consistent with these findings, we provide further evidence for increased activation of Interferon Regulatory Factor 7 (IRF7) and STAT1 in EC when depleted of Pfn1. Collectively, these findings for the first time demonstrate a prominent immunological consequence of loss of endothelial Pfn1 and an indispensable role of endothelial Pfn1 in mammalian survival unlike tolerable phenotypes of Pfn1 loss in other differentiated cell types.

Keywords: actin; endothelial cells; inflammation; macrophage; profilin; vascular.


Figures

Fig. 1.
Fig. 1.
Loss of endothelial Pfn1 results in gross multiorgan pathology and compromises the survival of mice. A) Representative images of Pfn1EC-KO and littermate control Pfn1WT mice on d18 following the last TMX administration (denoted as d0), showing abdominal enlargement (indicative of ascites) in Pfn1EC-KO mice. B) Kaplan–Meir overall survival curves of Pfn1WT (n = 17) and Pfn1EC-KO (n = 24) mice. C) Relative weight gain profiles of Pfn1WT (n = 18) and Pfn1EC-KO (n = 20) mice until the day of sacrifice. D) Necropsy of mice on d18 revealing the presence of peritoneal fluid (yellow) accumulation (arrow) in Pfn1EC-KO mice. E) Left panels show representative images of the liver harvested from Pfn1EC-KO and littermate control Pfn1WT mice. The liver of the Pfn1EC-KO mouse is smaller than the one dissected from the littermate and presents pale nodules of 2–4 mm (left inset), which alternate with areas of vascular congestion and subcapsular hemorrhage (right inset). Middle panels show an increase in size and congestion of the spleen from the Pfn1EC-KO mouse compared to that from the littermate. The right panels show a reduction in the size of the kidney of the Pfn1EC-KO mouse compared to that from the littermate control. F) Bar diagram illustrating the weight (means ± std. dev) of livers, spleens, and kidneys from Pfn1EC-KO and littermate control Pfn1WT mice (n = 3 mice/genotype). **P < 0.01, ***P < 0.001, and ****P < 0.0001.
Fig. 2.
Fig. 2.
Histopathological findings in mouse lungs and hearts lacking endothelial Pfn1. A) Upper panels are representative images of H&E staining sections from the lungs of Pfn1EC-KO and littermate control Pfn1WT mice harvested on d18 showing decrease of the airspace, alveolar edema (arrows), extravasation of erythrocytes, and alveolar capillaries filled with blood and protruding in the alveoli (inset, arrowheads) in Pfn1EC-KO lung. Lower panels are lung sections stained with Masson trichrome showing a lack of fibrosis. Upper panels H&E, ×100. Inset, ×500. Lower panels ×500. B) Upper panels are representative images of H&E staining sections of the hearts of a littermate control Pfn1WT mouse (left) showing healthy heart muscle and a Pfn1EC-KO mouse (right), with an area of chronic infarct (dotted line) with mononuclear cell inflammatory infiltrate (arrows). Lower panels are sections of the heart stained with Masson trichrome showing extensive fibrosis in the area of the heart infarct (arrows). Upper panels, ×200. Lower panels ×200.
Fig. 3.
Fig. 3.
Histopathological findings in mouse kidneys lacking endothelial Pfn1. A) Upper panels are representative images of H&E staining (×100) sections of the kidneys of a littermate control Pfn1WT (left) vs Pfn1EC-KO mouse (right). The glomeruli of Pfn1EC-KO mice were smaller than those of the littermate controls (arrows), and the tubules showed apoptotic epithelial cells, intraluminal edema, and erythrocytes (arrowheads). Lower panels are higher magnification images (×500) showing proliferation of mesangial cells (arrowheads), an abundance of eosinophilic deposits compatible with mesangial matrix, and dead EC (arrows) in Pfn1EC-KO mice. B) Masson trichrome staining of kidney sections shows the absence of fibrosis (upper panels ×100, lower panels ×500). C) CD31 staining of kidney sections shows normal vascularization of glomeruli (arrows) and surrounding the tubules (arrowheads) in littermate control Pfn1WT mouse (upper left panel). The upper right panel shows a lack of mature capillaries in the glomeruli (arrows) and between tubules (arrowheads) in sections of kidneys from Pfn1EC-KO mice. Lower panels are high magnifications of glomeruli showing the presence of mature blood vessels in the glomerulus of a Pfn1WT mouse (left) contrasting scarce endothelial cells with immature characteristics in the glomerulus of a Pfn1EC-KO mouse (right). Upper panels ×100, lower panels ×500. D) Upper left: cartoon of a normal glomerulus (generated using the BioRender illustration software). The upper right panels are TEM images (×5,000) of a glomerulus from a Pfn1WT mouse showing normal endothelial cells (E), podocytes (P), and mesangial cells (Mc). Lower panels are images of a glomerulus from a Pfn1EC-KO mouse showing a high number of mesangial cells (arrows) and deposits of the mesangial matrix (Mm) surrounding a collapsed capillary (dotted area). The lower right shows a capillary lined by apoptotic endothelial cells, thickening of the basal membrane (asterisk), and apoptotic podocytes.
Fig. 4.
Fig. 4.
Histopathological findings in mouse livers lacking endothelial Pfn1. A) Representative images showing normal liver histology (left) or the histopathological changes observed 10 days (center) or 18 days (right) after TMX administration in Pfn1EC-KO mice. Upper left is a section of the liver from a littermate control Pfn1WT mouse illustrating the characteristic acinar units composed of the central vein, portal tracts, and hepatocytes arranged radiating toward the central vein. Lower left is a higher magnification of the same section showing polygonal hepatocytes arranged in sheets, the space of Disse, and sinusoids lined by EC. The upper middle is a section of the liver of a Pfn1EC-KO mouse 10 days after administration of TMX showing disruption of the acinar architecture, with areas devoid of central veins. Lower middle, higher magnification shows areas with apoptotic hepatocytes, lack of spaces of Disse, and lack of sinusoids. The upper right is a section of the liver of a Pfn1EC-KO mouse 18 days after administration of TMX showing ample areas of infarcts (dotted lines) with inflammatory infiltrates composed of mononuclear cells surrounded by angiectasias (arrow). Lower right, a higher magnification shows foci of extramedullar hematopoiesis surrounded by small hepatocytes, some of them lacking the polygonal shape. H&E, upper panels ×100, lower panels ×500. B) Representative sections stained with Masson trichrome of the livers in A, showing the presence of fibrosis in the liver of the Pfn1EC-KO mouse. Upper panel ×100, lower panel ×500. C) Upper left, immunostaining with CD31 of a liver section from a littermate Pfn1WT mouse showing the normal vascular architecture of the acini including the central vein and portal tracts. Lower left, a higher magnification shows mature branched acinar sinusoids radiated around the central vein. Upper right, immunostaining with CD31 of a liver section of a Pfn1EC-KO mouse showing a disarrayed pattern that lacks the typical sinusoidal shape. The lower right panel at higher magnification shows immature blood vessels without branches and a lack of sinusoids. Upper panels ×200, lower panels ×500. D) Upper left is a TEM image of the liver from a littermate Pfn1WT mouse showing a sinusoid lined by EC and surrounded by alive hepatocytes. A higher magnification (inset ×10,000) shows the nucleus of one endothelial cell, the space of Disse (arrow). The center is a TEM image of a liver from a Pfn1EC-KO mouse showing necrotic hepatocytes and microvesicular fat accumulation (×5,000). The right panels show an isolated immature neovessel in the liver from a Pfn1EC-KO mouse (×5,000). CV, central vein; D, Disse space; E, endothelial cells; H, hepatocyte; I, infarct; PT, portal tract; S, sinusoid.
Fig. 5.
Fig. 5.
Effect of endothelial Pfn1 depletion on immunological profile in vivo. Flow cytometry–based quantification of various subtypes of immune cells expressed as a % of total leukocytes in either spleen or peripheral blood of Pfn1WT vs Pfn1EC-KO mice either 8–10 days (mid-stage, panel A) or 15–18 days (late-stage, panel B) after last TMX administration. Data representative of at least three separate litters with “n” representing the total number of mice in each group pooled from different litters. The “P” values, when significant (or close to being significant), are indicated above the comparison bar.
Fig. 6.
Fig. 6.
Effect of endothelial Pfn1 depletion on immunomodulatory cytokine/chemokine secretion in vitro and in vivo. A and B) Relative abundance of indicated cytokines/chemokines circulating in the serum of Pfn1WT vs Pfn1EC-KO mice collected either 8–10 days (mid-stage, panel A) or 15–18 days (late-stage, panel B) after the last TMX administration. Data representative of at least three separate litters with “n” representing the total number of mice in each group pooled from different litters. C and D) Real-time quantitative RT-PCR (panel C; n = 3 experiments) and immunoblot (panel D) validations of Pfn1 depletion in Ad-Cre–infected EC with Ad-GFP–infected cells serving as control (18S RT-PCR and GAPDH blots serve as the housekeeping gene control and loading control for RT-PCR and immunoblot experiments, respectively). E) Relative abundance of indicated cytokines/chemokines in the CM of Ad-Cre–infected EC relative to Ad-GFP–infected control cells (data represent the average fold change based on three independent experiments). F) Relative abundance of IL6 mRNA expression in circulating primary F4/80+ cells isolated from mice with the indicated genotypes (n = 6 mice/group pooled from two separate litters). G) Relative abundance of IL6 mRNA expression in macrophages differentiated from primary BMDM and exposed to the CM of Ad-Cre– vs Ad-GFP–infected EC, either in the absence or in the presence of IFNγ stimulation (data summarized from five independent experiments). *P < 0.05 and **P < 0.01.
Fig. 7.
Fig. 7.
Impact of Pfn1 depletion on EC transcriptome. A) Heat plot showing differentially expressed genes between Ad-GFP– and Ad-Cre–infected EC (genes color coded by blue and yellow denote transcriptionally downregulated and upregulated genes in Ad-Cre relative to Ad-GFP–infected cells; data summarized from three biological replicates). B) Heat plot showing transcriptionally altered cytokines/chemokines as a result of Pfn1 depletion in EC (numbers alongside indicate the average fold change in Ad-Cre relative Ad-GFP groups; asterisks denote robustly altered cytokines/chemokines that are in agreement with serum and/or CM Luminex data). C) A volcano plot (P-value vs Z score) displaying IPA-predicted activated and inhibited transcriptional regulators in Ad-Cre– vs Ad-GFP–infected cells. Top IPA-predicted activated transcription factors (based on the absolute Z score and negative log P-value) are outlined by a green oval. D) Representative immunoblots showing the relative levels of the total as well as phosphorylated forms of STAT1 and IRF7 between Ad-GFP– and Ad-Cre–infected cells (GAPDH blot serves as the loading control; Pfn1 blot confirms Ad-Cre–induced suppression of Pfn1 expression).
Fig. 8.
Fig. 8.
Schematic representation of how endothelial Pfn1 loss could potentially lead to a proinflammatory condition. We propose that loss of Pfn1 in EC directly stimulates select proinflammatory cytokine/chemokine expression/release through upregulating the intrinsic IRF7/STAT1 signaling in addition to potentiating proinflammatory gene expression in monocytes/macrophages in a paracrine signaling manner.

References

    1. Krishnan K, Moens PDJ. 2009. Structure and functions of profilins. Biophys Rev. 1:71–81. - PMC - PubMed
    1. Pandey DK, Chaudhary B. 2017. Evolutionary expansion and structural functionalism of the ancient family of profilin proteins. Gene. 626:70–86. - PubMed
    1. Allen A, Gau D, Roy P. 2021. The role of profilin-1 in cardiovascular diseases. J Cell Sci. 134:jcs249060. - PMC - PubMed
    1. Witke W. 2004. The role of profilin complexes in cell motility and other cellular processes. Trends Cell Biol. 14:461–469. - PubMed
    1. Ding Z, Lambrechts A, Parepally M, Roy P. 2006. Silencing profilin-1 inhibits endothelial cell proliferation, migration and cord morphogenesis. J Cell Sci. 119:4127–4137. - PubMed