. 2023 Oct 1;7(3):1181-1205.
doi: 10.1162/netn_a_00307. eCollection 2023.

High-amplitude network co-fluctuations linked to variation in hormone concentrations over the menstrual cycle

Affiliations

High-amplitude network co-fluctuations linked to variation in hormone concentrations over the menstrual cycle

Sarah Greenwell et al. Netw Neurosci. .

Abstract

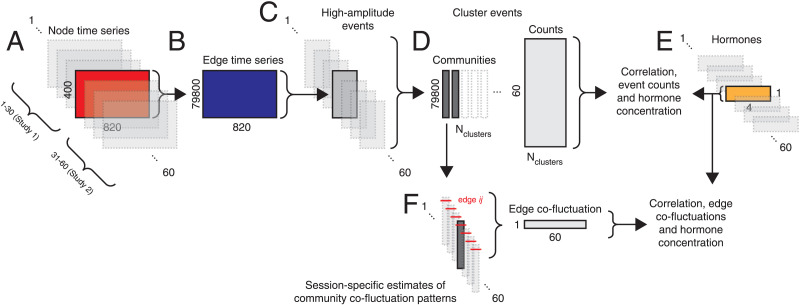
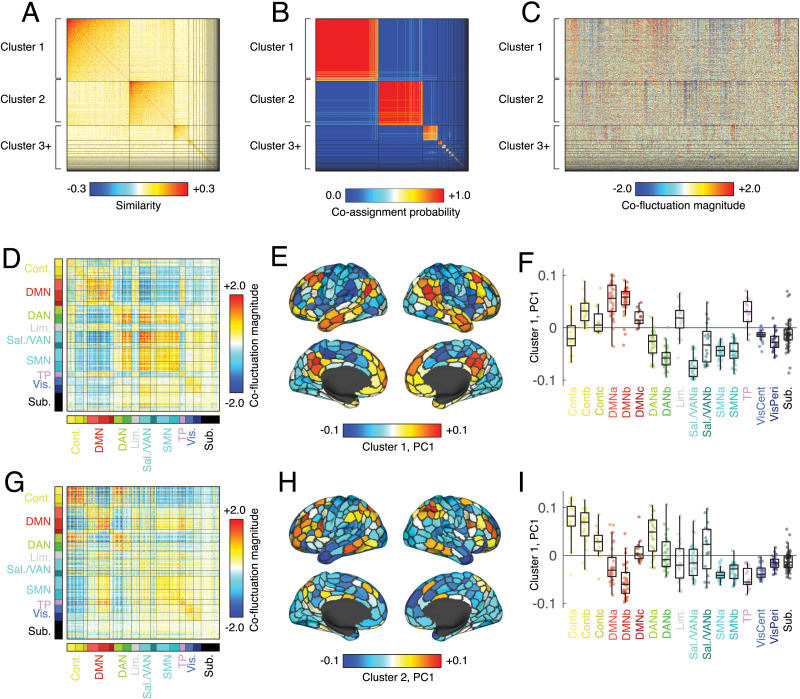
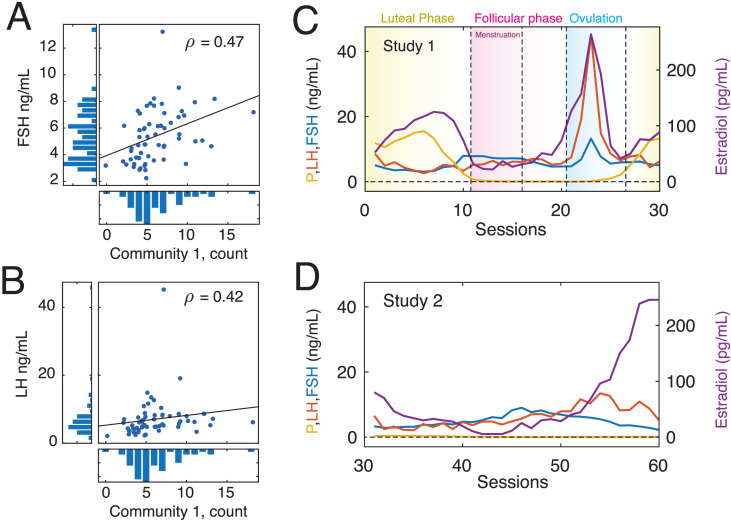
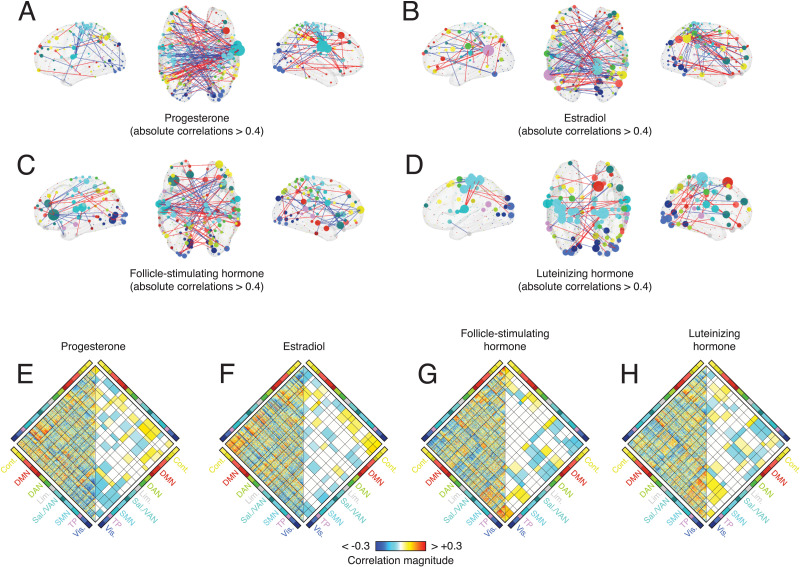
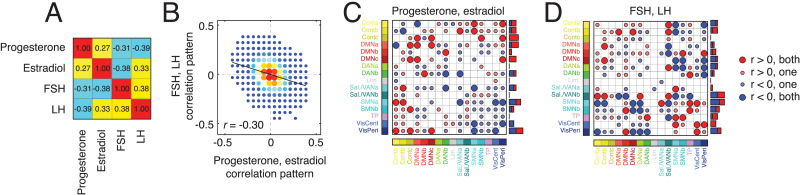
Many studies have shown that the human endocrine system modulates brain function, reporting associations between fluctuations in hormone concentrations and brain connectivity. However, how hormonal fluctuations impact fast changes in brain network organization over short timescales remains unknown. Here, we leverage a recently proposed framework for modeling co-fluctuations between the activity of pairs of brain regions at a framewise timescale. In previous studies we showed that time points corresponding to high-amplitude co-fluctuations disproportionately contributed to the time-averaged functional connectivity pattern and that these co-fluctuation patterns could be clustered into a low-dimensional set of recurring "states." Here, we assessed the relationship between these network states and quotidian variation in hormone concentrations. Specifically, we were interested in whether the frequency with which network states occurred was related to hormone concentration. We addressed this question using a dense-sampling dataset (N = 1 brain). In this dataset, a single individual was sampled over the course of two endocrine states: a natural menstrual cycle and while the subject underwent selective progesterone suppression via oral hormonal contraceptives. During each cycle, the subject underwent 30 daily resting-state fMRI scans and blood draws. Our analysis of the imaging data revealed two repeating network states. We found that the frequency with which state 1 occurred in scan sessions was significantly correlated with follicle-stimulating and luteinizing hormone concentrations. We also constructed representative networks for each scan session using only "event frames"-those time points when an event was determined to have occurred. We found that the weights of specific subsets of functional connections were robustly correlated with fluctuations in the concentration of not only luteinizing and follicle-stimulating hormones, but also progesterone and estradiol.

Keywords: Edge-centric; Functional connectivity; Time-varying networks.


Figures

<b>Figure 1.</b>
Figure 1.
Analysis pipeline. (A) After preprocessing, we obtained parcellated regional time series from 60 scans (spanning two experiments). (B) For a given scan, we transformed node time series into edge time series following Esfahlani et al. (2020). (C) Next, we detected high-amplitude events in each scan and for each event extracted its representative pattern (the frame with the greatest amplitude). In general, we obtained a different number of events per scan. (D) We aggregated event patterns from all scans and collectively clustered them using modularity maximization. This procedure resulted in multiple community centroids (we analyze the two largest) and a count of how many times a given community appeared on a given scan session. (E) In parallel, we analyzed hormone data that were collected concurrent with each scan session. Our principal aim was to link features of communities (brain states) with hormone data. (F) In addition, we reconstructed estimates of communities for each of the 60 scan sessions and, for each edge, computed the correlation of its co-fluctuation across sessions with hormone concentrations.
<b>Figure 2.</b>
Figure 2.
Modularity maximization and network states. We used an event detection algorithm to identify instances of “high-amplitude” co-fluctuations, extracting 899 brain-wide patterns. Each putative event was represented as a region-by-region co-fluctuation matrix. We vectorized each matrix by extracting its upper triangle elements and calculated the spatial similarity (Pearson correlation) between all pairs of patterns. This resulted in a 899 × 899 similarity matrix. We used this matrix as input to a clustering algorithm (modularity maximization) to detect groups or “communities” of mutually similar co-fluctuation patterns. Modularity maximization is nondeterministic, so we repeated the algorithm 1,000 times with random restarts and assembled the partitions into a co-assignment matrix, whose elements counted the fraction of the 1,000 partitions in which any pair of co-fluctuation patterns were assigned to the same community. To resolve variability across runs, we iteratively clustered the co-assignment matrix to obtain “consensus communities.” We refer to each consensus community as a “state.” (A) Similarity matrix, ordered by consensus communities. (B) Community co-assignment matrix ordered by consensus communities. (C) Vectorized co-fluctuation patterns ordered by consensus communities. (D) Mean co-fluctuation matrix for cluster 1, ordered by canonical brain systems. (E) First principal component of the co-fluctuation matrix. (F) Elements of first principal component grouped by brain system. Panels G–I are analogous to D–F but for cluster 2.
<b>Figure 3.</b>
Figure 3.
Correlations between state frequency and quotidian variation in gonadotropin concentration. (A) Scatterplot showing concentration of follicle-stimulating hormone across scan sessions versus the frequency with which cluster 1 appeared in a given scan. (B) Scatterplot showing concentration of luteinizing hormone across scan sessions versus the frequency with which cluster 1 appeared in a given scan. Panels C and D show variation of progesterone, estradiol, follicle-stimulating hormone, and luteinizing hormone across the Study 1 and Study 2 datasets.
<b>Figure 4.</b>
Figure 4.
Edge- and system-level correlations with hormone concentration. We calculated the correlation of hormone concentrations with edge-level co-fluctuation magnitudes for cluster 1. This procedure resulted in a correlation coefficient at every edge (Nedges = 400 × 399/2 = 79,800) and separately for every hormone. Rather than perform statistical tests at the level of edges, we performed tests at the level of systems. That is, for every pair of systems, we calculated the mean correlation of all edges that fall between those two systems and compare that value against what would be expected by chance. This procedure results in Nsystempairs = 136 unique pairs of systems and offers greater statistical power due to fewer independent tests. We corrected for multiple comparisons by fixing the accepted false discovery rate (the probability of falsely detecting an effect when no such effect exists) to 5% and adjusted the critical p value to obtain this accepted rate. Thus, for every pair of systems and for every hormone, we were able to assess whether the mean correlation of edges between those systems was statistically stronger than expected. These results are shown in panels E–H. On the left-hand side of each diamond plot are the raw, uncorrected edge-level correlations. On the right-hand side are system-level correlations that were greater than expected. System pairs that did not pass statistical testing are shown in white. The matrices in panels E–H are not anatomically localized and may be difficult to interpret. To provide some intuition and to anatomically ground these effects, in panels A–D, we show only the strongest edge-level correlations projected back into anatomical space. In each panel, node size is proportional to the mean correlation magnitude of a node’s edges. Node color was determined by brain system. Edge color denotes positive (red) and blue (negative) correlations. Note, however, that panels A–D are for provided for the sake of visualization and intuition only. The statistical tests and their outcomes are shown in panels E–H.
<b>Figure 5.</b>
Figure 5.
Similarity of brain-wide correlation patterns across hormones. In the main text we described a procedure in which we calculated the correlation of hormone concentration with the co-fluctuation magnitude between every pair of nodes (edges). This procedure resulted in four node × node matrices of correlation coefficients (one for each of the four hormones studied here). (A) Similarity of correlation patterns between pairs of hormones. (B) Plotting hormones against each other yields dense scatterplots that are difficult to interpret. Here, we present the same data as a two-dimensional histogram (by binning x and y axes and counting the number of points that fall within each bin). Here, the two-dimensional histogram depicts the similarity of correlation patterns from combined sex hormones (progesterone + estradiol) and gonadotropins (FSH + LH). The color is linearly proportional to the number of points in each bin, with brighter colors corresponding to larger values. (C) To further examine similarities and differences between the correlation patterns, we performed a concordance analysis. Specifically, we identified pairs of brain systems in which the mean correlation was statistically greater/less than that of a permutation based null model. We further examined similarities in sex and gonadotropic hormones separately. For every pair of brain systems, there were five possible outcomes: both exhibited significant positive correlations, both exhibited significant negative correlations, one or the other exhibited a significant positive correlation while the other did not, one or the other exhibited a significant negative correlation while the other did not, and neither exhibited a significant correlation. In panel C, we plot the outcomes of this analysis for sex hormones (progesterone and estradiol). Large and small circles indicate high and low levels of concordance. Red and blue colors indicate positive and negative correlations, respectively. The bar plot to the right of the matrix is a count of the total number of high concordance interactions in which a given system interacts. Panel D depicts analogous information for combined gonadotropins (FSH + LH).

References

    1. Abraham, A., Pedregosa, F., Eickenberg, M., Gervais, P., Mueller, A., Kossaifi, J., … Varoquaux, G. (2014). Machine learning for neuroimaging with scikit-learn. Frontiers in Neuroinformatics, 8, 14. 10.3389/fninf.2014.00014, - DOI - PMC - PubMed
    1. Allen, E. A., Damaraju, E., Plis, S. M., Erhardt, E. B., Eichele, T., & Calhoun, V. D. (2014). Tracking whole-brain connectivity dynamics in the resting state. Cerebral Cortex, 24(3), 663–676. 10.1093/cercor/bhs352, - DOI - PMC - PubMed
    1. Arélin, K., Mueller, K., Barth, C., Rekkas, P. V., Kratzsch, J., Burmann, I., … Sacher, J. (2015). Progesterone mediates brain functional connectivity changes during the menstrual cycle—A pilot resting state MRI study. Frontiers in Neuroscience, 9, 44. 10.3389/fnins.2015.00044, - DOI - PMC - PubMed
    1. Avants, B., Epstein, C., Grossman, M., & Gee, J. (2008). Symmetric diffeomorphic image registration with cross-correlation: Evaluating automated labeling of elderly and neurodegenerative brain. Medical Image Analysis, 12(1), 26–41. 10.1016/j.media.2007.06.004, - DOI - PMC - PubMed
    1. Barttfeld, P., Uhrig, L., Sitt, J. D., Sigman, M., Jarraya, B., & Dehaene, S. (2015). Signature of consciousness in the dynamics of resting-state brain activity. Proceedings of the National Academy of Sciences, 112(3), 887–892. 10.1073/pnas.1418031112, - DOI - PMC - PubMed

LinkOut - more resources