. 2023 Sep 4;19(15):4726-4743.
doi: 10.7150/ijbs.85893. eCollection 2023.

Glycine Decarboxylase (GLDC) Plays a Crucial Role in Regulating Energy Metabolism, Invasion, Metastasis and Immune Escape for Prostate Cancer

Affiliations

Glycine Decarboxylase (GLDC) Plays a Crucial Role in Regulating Energy Metabolism, Invasion, Metastasis and Immune Escape for Prostate Cancer

Ming-Kun Chen et al. Int J Biol Sci. .

Abstract

Glycine decarboxylase (GLDC) is one of the core enzymes for glycine metabolism, and its biological roles in prostate cancer (PCa) are unclear. First, we found that GLDC plays a central role in glycolysis in 540 TCGA PCa patients. Subsequently, a metabolomic microarray showed that GLDC enhanced aerobic glycolysis in PCa cells, and GLDC and its enzyme activity enhanced glucose uptake, lactate production and lactate dehydrogenase (LDH) activity in PCa cells. Next, we found that GLDC was highly expressed in PCa, was directly regulated by hypoxia-inducible factor (HIF1-α) and regulated downstream LDHA expression. In addition, GLDC and its enzyme activity showed a strong ability to promote the migration and invasion of PCa both in vivo and in vitro. Furthermore, we found that the GLDC-high group had a higher TP53 mutation frequency, lower CD8+ T-cell infiltration, higher immune checkpoint expression, and higher immune exclusion scores than the GLDC-low group. Finally, the GLDC-based prognostic risk model by applying LASSO Cox regression also showed good predictive power for the clinical characteristics and survival in PCa patients. This evidence indicates that GLDC plays crucial roles in glycolytic metabolism, invasion and metastasis, and immune escape in PCa, and it is a potential therapeutic target for prostate cancer.

Keywords: Glycine decarboxylase (GLDC); Glycolytic metabolism; Immune escape; Metastasis; Prostate cancer.


Conflict of interest statement

Competing Interests: The authors have declared that no competing interest exists.

Figures

Figure 1
Figure 1
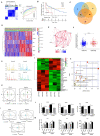
Glycolysis is a crucial energy metabolism mode for prostate cancer. A: Heatmap of the differential expression of metabolic genes in 51 normal and 489 prostate cancer patients from the TCGA database. B: WGCNA of 647 metabolism-related differentially expressed genes (normal versus tumor). C: Correlation analysis between gene modules and clinical traits (clinical T stage, Gleason score, pathological N stage, pathological T stage, etc.). D: KEGG pathway enrichment analysis of the red gene module.
Figure 2
Figure 2
GLDC is a core glycolysis metabolic gene in prostate cancer. A: Clustering was performed on 489 TCGA patients according to the expression levels of 647 metabolism-related differentially expressed genes (normal vs tumor), and optimal clustering was achieved when K=3 (C1, C2, C3). B: Biochemical recurrence curves of patients with C1, C2 and C3. C: Venn diagram of differentially expressed genes among the C1, C2 and C3 groups. D: The gene expression of GLDC, PLA2G7, CA3, CD38, PDE5A, and CDO1 among the C1, C2 and C3 groups. E: Correlation analysis of GLDC and glycolysis-related genes. F: The glycolysis level (mean value of glycolysis-related gene expression) was higher in the GLDC-high group than in the GLDC-low group. G: The total ion chromatography (TIC) chromatograms of all the samples. H: The PCA and PLS-DA models show the metabolic differences for different groups. I: The PCA, PLS-DA and OPLS-DA models show the metabolic differences between the LNcap-siG group and LNcap-NC group. J: Metabolic differences between the LNcap-siG groups and LNcap-NC groups were analyzed by heatmap. K: Path analysis was performed for the LNcap-siG groups and LNcap-NC groups. L: Glucose uptake, lactate production and LDH activity were detected in different groups of DU145 cells. M: Glucose uptake, lactate production and LDH activity were detected in different groups of 22RV1 cells.
Figure 3
Figure 3
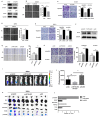
Regulatory mechanism of GLDC for glycolysis in prostate cancer. A: Two direct binding sites between HIF-1α and the GLDC transcription initiation region were predicted by the UCSC gene database. B: Two primers were designed to predict binding sites. C: HIF-1α expression was measured by western blotting. D, E, F: A ChIP experiment was used to confirm the direct binding sites between HIF-1α and GLDC. G: GLDC correlated well with HIF-1α in gene expression in the TCGA database. H: The protein expression level of GLDC after transfection of HIF-1α siRNA into LNcap cells. I: The expression level of LDHA in the GLDC-high group was higher than that in the GLDC-low group. J: Gene expression correlations between GLDC and LDHA in TCGA patients. K: The gene expression of LDHA after transfection of GLDC siRNA into LNcap cells. L: The protein expression of GLDC after transfection of GLDC siRNA into LNcap cells. M: The protein expression of LDHA after transfection of GLDC siRNA into LNcap cells. N: Lactate production concentrations in the shCON, p-GLDC, and p-GLDC+siLDHA groups. O: Optimum lactate production inhibition concentration of LDHA inhibitor.
Figure 4
Figure 4
GLDC is highly expressed in metastatic prostate cancer and predicts poor prognosis. A: GLDC is highly expressed in prostate cancer compared to normal prostate tissue in TCGA patients. B: GLDC is highly expressed in the lymph node-positive group (N1) compared with the lymph node-negative group (N0) of PCa patients from the TCGA database. C: GLDC is highly expressed in the ERG fusion group of TCGA patients. D: GLDC is highly expressed in metastatic prostate cancer cell lines (Lncap, DU145, PC3) compared with a primary cell line (22RV1). E: GLDC is highly expressed in metastatic prostate cancer tissues (M1~M5) compared with primary prostate cancer tissues (T1~T6). F: GLDC is highly expressed in the AR amplification group of TCGA patients. G: The protein expression levels of GLDC, AR, and ARV7 in the over-GLDC group, si-GLDC group and control group. H: The mRNA expression of AR in the si-GLDC group and control group. I: The mRNA expression of AR-V7 in the si-GLDC group and control group. J: Progression-free survival curve of the GLDC-high group and GLDC-low group based on TCGA patients. K: Progression-free survival curve of the GLDC-high group and GLDC-low group in different T stages of TCGA patients. L: Progression-free survival curve of the GLDC-high group and GLDC-low group in different Gleason scores of TCGA patients.
Figure 5
Figure 5
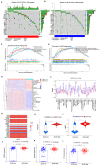
The GLDC-based risk model can well predict the clinical characteristics of prostate cancer patients in the TCGA portal. (A, B) LASSO Cox regression analysis of 22 biochemical recurrence-related genes in both the TCGA and GEO cohorts. (C-E) Kaplan‒Meier analysis of biochemical recurrence, PFS and OS in the two risk groups. (F-H) ROC analysis was performed to validate the predictive ability of our model for PFS and biochemical recurrence in PCa patients. (G) Survival status and risk score of the two risk groups. (H, I) Forest maps of univariate (H) and multivariate (I) analyses for risk scores in our model. (J) Heatmap of the correlation of clinical characteristics with the risk groups in the TCGA cohort. (K-P) Percent weights and risk scores of clinical T stage, Gleason score, outcome success, pathological T stage, pathological N stage, and treatment success of the two risk groups in the TCGA cohort.
Figure 6
Figure 6
The GLDC-based risk model can well predict the survival of prostate cancer patients in the TCGA portal. A-C: Overall survival analysis for the subgroups of clinical T stages in the two risk groups of the TCGA cohort. D-F: Overall survival analysis for the subgroups of Gleason score in the two risk groups of the TCGA cohort. G-J: Overall survival analysis for the subgroups of outcome success in the two risk groups of the TCGA cohort. K-L: Overall survival analysis for the subgroups of pathological T stages in the two risk groups of the TCGA cohort. M-N: Overall survival analysis for the subgroups of pathological N stages in the two risk groups of the TCGA cohort. O-R: Overall survival analysis for the subgroups of treatment success in the two risk groups of the TCGA cohort.
Figure 7
Figure 7
GLDC and enzyme activity promoted invasion and migration both in vivo and in vitro in PCa. A: DU145 cells were transfected with GLDC siRNA, and 22RV1 cells were transfected with overexpression plasmid. After 72 h, GLDC expression was measured by western blotting. B, D: Wound healing assay of migration in DU145 and 22RV1 cells, respectively. C, E: Transwell assay of migration and invasion in DU145 and 22RV1 cells, respectively. F: 22RV1 cells were transfected with GLDC empty vector, wild-type overexpressed GLDC plasmid, or variant MT-GLDC plasmid. After 72 h, GLDC expression was measured by western blotting. G, H: Transwell migration and invasion assays of 22RV1 cells in the p-GLDC group, p-MT-GLDC group and p-NC group. I: Xenograft images of mice with orthotopic implantation of the p-GLDC group, p-MT-GLDC group and p-NC group, respectively. J: Tumor volumes of the p-GLDC group, p-MT-GLDC group and p-NC group. K: Luciferase expression intensity in the lung, liver, kidney, pancreas, testis and prostate, representative of metastasis, was recorded for each mouse. L: Organ distribution frequency of tumor metastasis. All mice were autopsied, and the organs were measured by detecting luciferase activity.
Figure 8
Figure 8
The GLDC-High group predicted a higher risk of TP53 mutation and immune escape in PCa patients. (A, B) Top 20 mutated genes in the GLDC-high and GLDC-low groups in the TCGA cohort. (C, D) GO and KEGG enrichment analyses based on gene set enrichment analysis (GSEA) for the GLDC-high and -low groups in the TCGA cohort. (E, F) Immune cell infiltration or functions in the GLDC-high and GLDC-low groups in the TCGA cohort. (G) Correlation analysis of GLDC and immunosuppressive genes. (H) The immune exclusion score of the GLDC-high and GLDC-low groups in the TCGA cohort. (I) The MDSC infiltration level of the GLDC-high and GLDC-low groups in the TCGA cohort. (J-L) The expression levels of immune checkpoints (CD274, PDCD1, CTLA-4) in the GLDC-high and GLDC-low groups in the TCGA cohort.

References

    1. Bray F, Ferlay J, Soerjomataram I. et al. Global cancer statistics 2018: GLOBOCAN estimates of incidence and mortality worldwide for 36 cancers in 185 countries. CA Cancer J Clin. 2018;68:394–424. - PubMed
    1. Chen MK, Luo Y, Zhang H. et al. Laparoscopic radical prostatectomy plus extended lymph nodes dissection for cases with non-extra node metastatic prostate cancer: 5-year experience in a single Chinese institution. J Cancer Res Clin Oncol. 2013;139:871–878. - PMC - PubMed
    1. Psutka SP, Frank I, Karnes RJ. Risk Stratification in Hormone-sensitive Metastatic Prostate Cancer: More Questions than Answers. Eur Urol. 2015;68:205–206. - PubMed
    1. Liberti MV, Locasale JW. The Warburg Effect: How Does it Benefit Cancer Cells? Trends Biochem Sci. 2016;41:211–218. - PMC - PubMed
    1. Song D, Powles T, Shi L. et al. Bladder cancer, a unique model to understand cancer immunity and develop immunotherapy approaches. J Pathol. 2019;249:151–165. - PMC - PubMed

Publication types

MeSH terms

Substances