This is a preprint.
GammaGateR: semi-automated marker gating for single-cell multiplexed imaging
- PMID: 37781604
- PMCID: PMC10541135
- DOI: 10.1101/2023.09.20.558645
GammaGateR: semi-automated marker gating for single-cell multiplexed imaging
Update in
-
GammaGateR: semi-automated marker gating for single-cell multiplexed imaging.Bioinformatics. 2024 Jun 3;40(6):btae356. doi: 10.1093/bioinformatics/btae356. Bioinformatics. 2024. PMID: 38833684 Free PMC article.
Abstract
Motivation: Multiplexed immunofluorescence (mIF) is an emerging assay for multichannel protein imaging that can decipher cell-level spatial features in tissues. However, existing automated cell phenotyping methods, such as clustering, face challenges in achieving consistency across experiments and often require subjective evaluation. As a result, mIF analyses often revert to marker gating based on manual thresholding of raw imaging data.
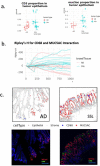
Results: To address the need for an evaluable semi-automated algorithm, we developed GammaGateR, an R package for interactive marker gating designed specifically for segmented cell-level data from mIF images. Based on a novel closed-form gamma mixture model, GammaGateR provides estimates of marker-positive cell proportions and soft clustering of marker-positive cells. The model incorporates user-specified constraints that provide a consistent but slide-specific model fit. We compared GammaGateR against the newest unsupervised approach for annotating mIF data, employing two colon datasets and one ovarian cancer dataset for the evaluation. We showed that GammaGateR produces highly similar results to a silver standard established through manual annotation. Furthermore, we demonstrated its effectiveness in identifying biological signals, achieved by mapping known spatial interactions between CD68 and MUC5AC cells in the colon and by accurately predicting survival in ovarian cancer patients using the phenotype probabilities as input for machine learning methods. GammaGateR is a highly efficient tool that can improve the replicability of marker gating results, while reducing the time of manual segmentation.
Availability and implementation: The R package is available at https://github.com/JiangmeiRubyXiong/GammaGateR.
Keywords: CODEX; CyCIF; Phenotyping; classification; mixture model; mxIF.
Conflict of interest statement
COMPETING INTEREST STATEMENT The authors declare no competing interests.
Figures


References
Publication types
Grants and funding
LinkOut - more resources
Full Text Sources
Research Materials
Miscellaneous
