[Preprint]. 2023 Sep 20:2023.09.19.558531.
doi: 10.1101/2023.09.19.558531.

Systematic Perturbation of Thousands of Retroviral LTRs in Mouse Embryos

Affiliations

Systematic Perturbation of Thousands of Retroviral LTRs in Mouse Embryos

Jian Yang et al. bioRxiv. .

Update in

Abstract

In mammals, many retrotransposons are de-repressed during zygotic genome activation (ZGA). However, their functions in early development remain elusive largely due to the challenge to simultaneously manipulate thousands of retrotransposon insertions in embryos. Here, we employed epigenome editing to perturb the long terminal repeat (LTR) MT2_Mm, a well-known ZGA and totipotency marker that exists in ~2667 insertions throughout the mouse genome. CRISPRi robustly repressed 2485 (~93%) MT2_Mm insertions and 1090 (~55%) insertions of the closely related MT2C_Mm in 2-cell embryos. Remarkably, such perturbation caused down-regulation of hundreds of ZGA genes at the 2-cell stage and embryonic arrest mostly at the morula stage. Mechanistically, MT2_Mm/MT2C_Mm primarily served as alternative ZGA promoters activated by OBOX proteins. Thus, through unprecedented large-scale epigenome editing, we addressed to what extent MT2_Mm/MT2C_Mm regulates ZGA and preimplantation development. Our approach could be adapted to systematically perturb retrotransposons in other mammalian embryos as it doesn't require transgenic animals.

Keywords: MERVL; MT2_Mm; endogenous retroviruses; epigenome editing; long terminal repeats; preimplantation embryos; zygotic genome activation.


Conflict of interest statement

9.Author information The authors declare no competing financial interests.

Figures

Fig. 1.
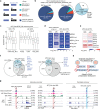
Fig. 1.. Selective dCas9 targeting to MT2_Mm/MT2C_Mm by CARGO.
a) Experimental design. b) Genome browser views of dCas9 and HA ChIP signals at a solo MT2_Mm (left panel) and two MT2_Mm insertions flanking a full length MERVL (right panel). For ChIP-seq analyses, one alignment was randomly selected for read pairs that were mapped to multiple genomic locations to recover ChIP signals at repeats. c) Heatmap illustrating ChIP signals over all annotated MT2_Mm and MT2C_Mm insertions. d) Pie chart showing genomic distributions of high confidence ChIP-seq peaks (left panel). Box plot showing ChIP signals at the targeted MT2_Mm/MT2C_Mm insertions and the off-target sites (right panel). The middle lines in the boxes represent medians. Box hinges indicate the 25th and 75th percentiles, and whiskers indicate the hinge±1.5×interquartile range. P-value, two-sided Wilcoxon rank-sum test. e) Stacked plot showing the fractions of LTR insertions bound by dCas9. f) Pie chart showing genomic distributions of the targeted MT2_Mm/MT2C_Mm insertions.
Fig. 2.
Fig. 2.. Rapid, robust, and specific perturbation of thousands of LTRs in embryos.
a) Experimental design. IVF: in vitro fertilization. b) Immunostaining of MERVL-Gag protein at the L2C stage. White arrows point to the second polar body. Scale bar: 20μm. c) Quantifications of MERVL-Gag immunostaining signals. Each dot represents one 2C embryo. Number of embryos analyzed were 18, 12, 15, 18, 28, 8, and 7 for noninjected, CTRi (300ng/μl), MT2_Mmi (300ng/μl), CTRi (100ng/μl), MT2_Mmi (100ng/μl), CTRi (30ng/μl), and MT2_Mmi (30ng/μl), respectively. The middle lines in the boxes represent medians. Box hinges indicate the 25th and 75th percentiles, and whiskers indicate the hinge±1.5×interquartile range. P-value, two-tailed t-test. d) Normalized RNA-seq read counts for MT2_Mm and MERVL-int at E2C and L2C stages. Both uniquely and multiple mapped read pairs were considered. Each dot represents one RNA-seq sample. e) Scatter plots comparing repeat expression at subfamily level between CTRi and MT2_Mmi. Differential repeat expression criteria are FC > 3 and FDR < 0.05. f) Genome browser views of dCas9 ChIP and RNA signals at a full length MERVL-int and a full length MERVL 2A-int. For RNA-seq tracks, only uniquely aligned read pairs are included.
Fig. 3.
Fig. 3.. MT2_Mm/MT2C_Mm regulate ZGA and preimplantation development.
a) Bar graph showing the percentage of embryos reaching 2C (28hpi), 4C (44hpi), morula (72hpi) and blastocyst (96hpi) stages. Dots represent the number of experiments performed. In total, 18, 38 and 52 embryos were analyzed for non-injected, CTRi, and MT2_Mmi groups, respectively. b) Bright field images showing embryos that reach to different developmental stages at indicated time points. Scale bar: 70μm c) Pie charts showing the distances of DEGs to the nearest targeted MT2_Mm/MT2C_Mm insertions. d) Scatter plots showing the expression level changes of minor ZGA, major ZGA, and maternal decay genes in the MT2_Mmi group.
Fig. 4.
Fig. 4.. MT2_Mm/MT2C_Mm primarily serve as alternative promoters activated by Obox.
a) Diagrams illustrating the possible relationships between genes and the nearest targeted MT2_Mm/MT2C_Mm insertions in terms of orientation and positions. Note that MT2_Mm/MT2C_Mm have their own orientations. b) Pie charts showing the relationships between down-regulated genes upon MT2_Mmi and the nearest targeted MT2_Mm/MT2C_Mm insertions. c) Box plots showing gene expression changes of MT2_Mm/MT2C_Mm-chimeric genes at E2C and L2C stages. The middle lines in the boxes represent medians. Box hinges indicate the 25th and 75th percentiles, and whiskers indicate the hinge±1.5×interquartile range. P-value, two-sided Wilcoxon rank-sum test. d) Heatmap illustrating expression changes of the indicated repeat subfamilies in Obox maternal zygotic KO (mzKO) and MT2_Mmi groups. e) Heatmap illustrating expression changes of Obox genes upon MT2_Mmi. f) Venn diagrams showing the overlap between ZGA genes, and genes downregulated in both Obox mzKO and MT2_Mmi groups. g) Genome browser views of the indicated tracks at Ddit4l, Slc16a6, and Slc19a3 locus. MT2_Mm orientations and gene transcription directions are as indicated. For Ddit4l and Slc16a6, 45-degree arrows point to the MT2_Mm-derived alternative promoters, and dashed lines indicate MT2_Mm-exon splicing junction. For Slc19a3, 45-degree arrow illustrates that no RNA signals are detected at the corresponding MT2_Mm insertion. h) Graphic summary of this work.

Similar articles

References

    1. Aoki F., Worrad D.M., Schultz R.M., 1997. Regulation of transcriptional activity during the first and second cell cycles in the preimplantation mouse embryo. Dev Biol 181, 296–307. doi:10.1006/dbio.1996.8466. - DOI - PubMed
    1. Bae S., Park J., Kim J.S., 2014. Cas-offinder: a fast and versatile algorithm that searches for potential off-target sites of cas9 rna-guided endonucleases. Bioinformatics 30, 1473–5. doi:10.1093/bioinformatics/btu048. - DOI - PMC - PubMed
    1. Bouniol C., Nguyen E., Debey P., 1995. Endogenous transcription occurs at the 1-cell stage in the mouse embryo. Exp Cell Res 218, 57–62. doi:10.1006/excr.1995.1130. - DOI - PubMed
    1. Chen Z., Zhang Y., 2019. Loss of dux causes minor defects in zygotic genome activation and is compatible with mouse development. Nat Genet 51, 947–951. doi:10.1038/s41588-019-0418-7. - DOI - PMC - PubMed
    1. Concordet J.P., Haeussler M., 2018. Crispor: intuitive guide selection for crispr/cas9 genome editing experiments and screens. Nucleic Acids Res 46, W242–W245. doi:10.1093/nar/gky354. - DOI - PMC - PubMed

Publication types