[Preprint]. 2024 Jan 25:2023.09.18.558298.
doi: 10.1101/2023.09.18.558298.

Mapping Cellular Interactions from Spatially Resolved Transcriptomics Data

Affiliations

Mapping Cellular Interactions from Spatially Resolved Transcriptomics Data

James Zhu et al. bioRxiv. .

Update in

  • Mapping cellular interactions from spatially resolved transcriptomics data.
    Zhu J, Wang Y, Chang WY, Malewska A, Napolitano F, Gahan JC, Unni N, Zhao M, Yuan R, Wu F, Yue L, Guo L, Zhao Z, Chen DZ, Hannan R, Zhang S, Xiao G, Mu P, Hanker AB, Strand D, Arteaga CL, Desai N, Wang X, Xie Y, Wang T. Zhu J, et al. Nat Methods. 2024 Oct;21(10):1830-1842. doi: 10.1038/s41592-024-02408-1. Epub 2024 Sep 3. Nat Methods. 2024. PMID: 39227721

Abstract

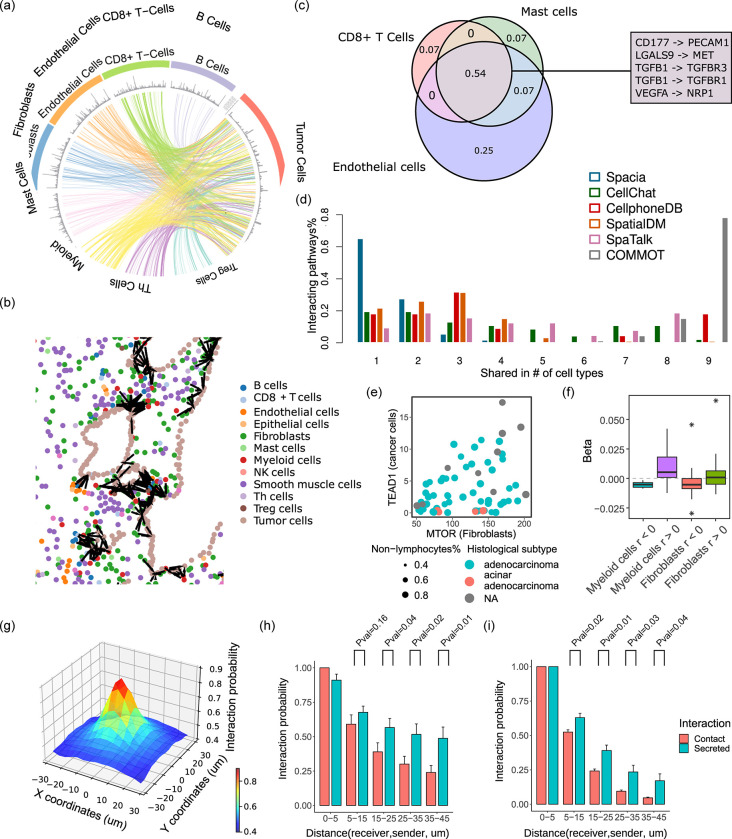
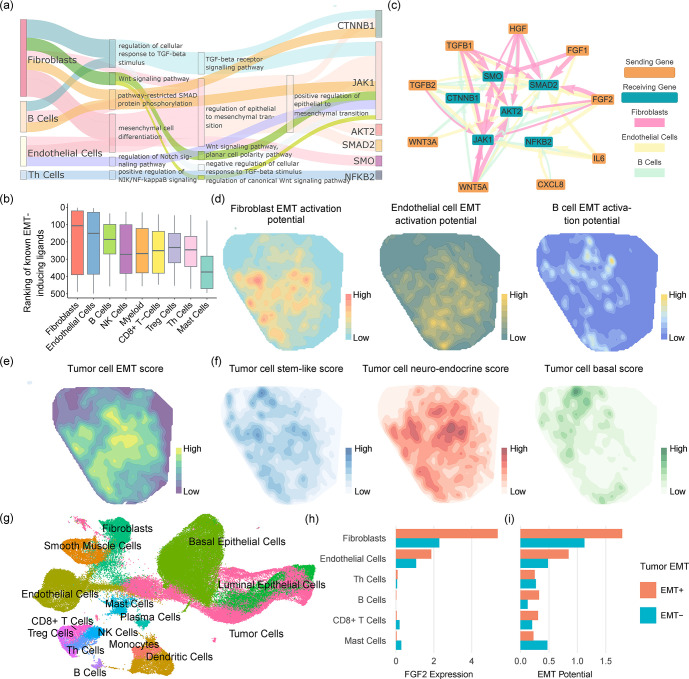
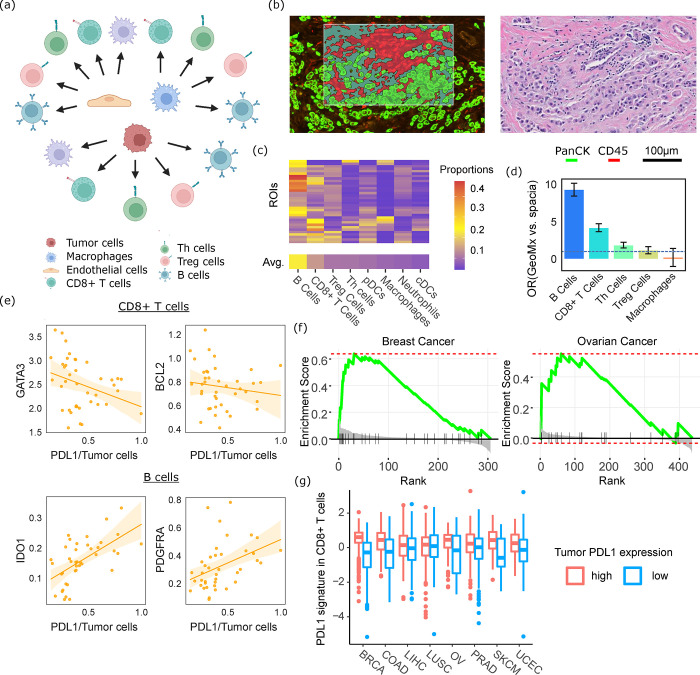
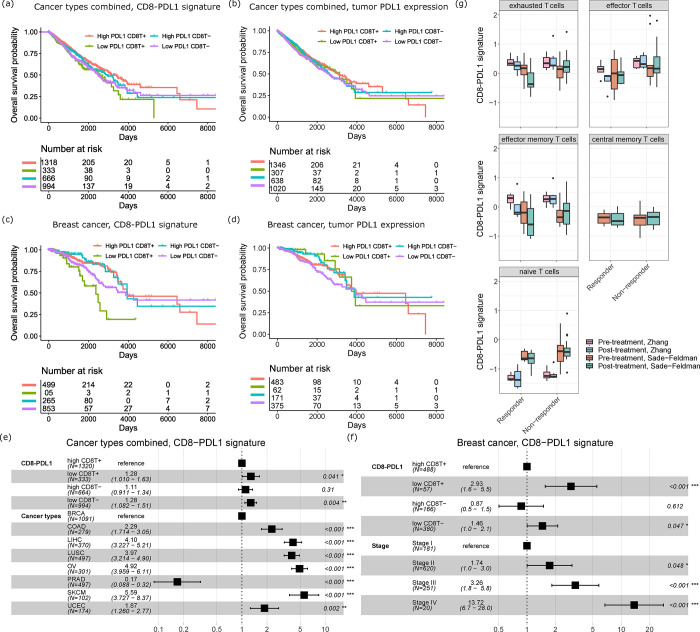
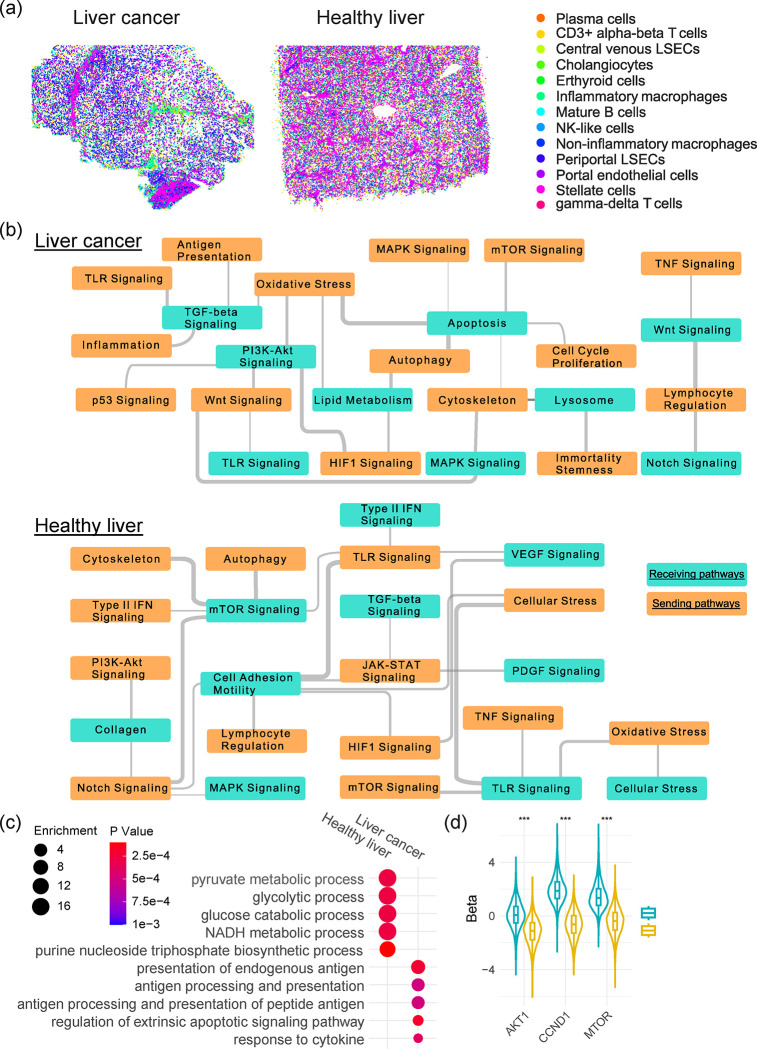
Cell-cell communication (CCC) is essential to how life forms and functions. However, accurate, high-throughput mapping of how expression of all genes in one cell affects expression of all genes in another cell is made possible only recently, through the introduction of spatially resolved transcriptomics technologies (SRTs), especially those that achieve single cell resolution. However, significant challenges remain to analyze such highly complex data properly. Here, we introduce a Bayesian multi-instance learning framework, spacia, to detect CCCs from data generated by SRTs, by uniquely exploiting their spatial modality. We highlight spacia's power to overcome fundamental limitations of popular analytical tools for inference of CCCs, including losing single-cell resolution, limited to ligand-receptor relationships and prior interaction databases, high false positive rates, and most importantly the lack of consideration of the multiple-sender-to-one-receiver paradigm. We evaluated the fitness of spacia for all three commercialized single cell resolution ST technologies: MERSCOPE/Vizgen, CosMx/Nanostring, and Xenium/10X. Spacia unveiled how endothelial cells, fibroblasts and B cells in the tumor microenvironment contribute to Epithelial-Mesenchymal Transition and lineage plasticity in prostate cancer cells. We deployed spacia in a set of pan-cancer datasets and showed that B cells also participate in PDL1/PD1 signaling in tumors. We demonstrated that a CD8+ T cell/PDL1 effectiveness signature derived from spacia analyses is associated with patient survival and response to immune checkpoint inhibitor treatments in 3,354 patients. We revealed differential spatial interaction patterns between γδ T cells and liver hepatocytes in healthy and cancerous contexts. Overall, spacia represents a notable step in advancing quantitative theories of cellular communications.

Keywords: GeoMX; MERSCOPE; cellular interaction; spacia; spatially resolved transcriptomics.


Conflict of interest statement

COMPETING INTEREST STATEMENT Tao Wang is one of the scientific co-founders of NightStar Biotechnologies, Inc. Ariella Hanker receives or has received research grants from Takeda and Lilly and nonfinancial support from Puma Biotechnology and Tempus. Carlos Arteaga receives or has received research grants from Pfizer, Lilly, and Takeda; holds minor stock options in Provista; serves or has served in an advisory role to Novartis, Merck, Lilly, Daiichi Sankyo, Taiho Oncology, OrigiMed, Puma Biotechnology, Immunomedics, AstraZeneca, Arvinas, and Sanofi; and reports scientific advisory board remuneration from the Susan G. Komen Foundation.

Figures

Fig. 1
Fig. 1
The spacia model. (a) Cartoons explaining the concept of “primary instances”, namely the sending cells that are truly interacting with the receiver cells. The purple senders refer to senders that interact with receivers through cell-to-cell contact. The green senders refer to senders that interact with receivers through secreted ligands. (b) Diagram showing the key elements of the model structure of spacia. (c) Inference results of spacia on a simulation dataset. Blue color refers to sender cells, red color refers to receiver cells and green arrows refer to CCC. (d) ROC curves measuring the accuracy of spacia finding the correct primary instances in the simulation data, with increasing numbers of total MCMC chains. (e) The distribution of the b variables across MCMC iterations after stabilization, in two MCMC chains. (f) The distribution of the β variables across MCMC iterations after stabilization, for genes in senders that are (top) or are not (bottom) truly interacting with receiving genes. (g) Point estimates of the β variables. Left: 5 truly interacting genes in the simulation data; right: 10 truly interacting genes.
Fig. 2
Fig. 2
Validating spacia in real data. (a) Spacia inferred CCCs from select immune and stromal cells to tumor cells in the prostate cancer MERSCOPE dataset. The spacia results were filtered to only visualize those that satisfy b < 0, b Pval<1×10E-30, β Pval<0.001, and top 1% of z-scored β across all results. (b) Spatial representation of the spacia results. Cells are color labeled by cell types, and significantly interacting cell pairs inferred by spacia (bs) are indicated in black. (c) Overlap between the predicted CCCs by CellphoneDB on the same MERSCOPE dataset for three example sending cell types. The numbers indicate the proportions of total CCCs found in each overlap. Some example CCCs that are inferred to exist in all three cell types are listed. (d) Comparison of the degree of overlap in inferred CCCs between different sending cell types, by spacia, CellChat, CellphoneDB, SpatialDM, SpaTalk, and COMMOT. The Y axis refers to the proportions of interactions shared in n cell types vs. all predicted interactions. (e) An example scatterplot showing the correlations between the expression of sending and receiving genes in their respective cell types in the PDX RNA-seq data. (f) Spacia β values are more likely to be positive for sending genes and receiving genes that are positively correlated in the PDX data, and vice versa. (g-i) Probability of interaction as a function of distance from the sending cells to the receiving cell. (g) Gene pairs of both secretion-based and contact-based CCCs combined in the prostate cancer MERSCOPE dataset. The sending cells are shown in their actual X-Y coordinates relative to the receiving cells and the interaction probabilities are averaged at each location. The Z axis shows the primary instance probabilities of the sending cells, explained in Sup. File 1. (h,i) The probabilities for each type of CCCs shown separately, and the sending cells are ordered and binned along the distances between sending and receiving cells. (h) the prostate cancer and (i) the lung cancer MERSCOPE datasets. For sake of consistency, for each gene pair shown in panels (g-i), all interaction probabilities are normalized by the maximum interaction probabilities and shown in the plots. T test is used to test if the sending-receiving cell pairs have higher interaction probabilities in secretion-based CCCs than in contact-based CCCs.
Fig. 3
Fig. 3
Applying spacia to reveal EMT and lineage plasticity induction signals from the prostate cancer tumor microenvironment. (a) Sankey diagram describing GO term enrichment in the sending genes, of each sender cell type, that are inferred by spacia to be impacting well known EMT marker genes in the tumor receiver cells. The width of the flow is scaled with the P values, and the parent term is connected with the child term if both terms were identified between the same sender cell-receiving gene pair. (b) The rankings of βs for known cytokine ligands that could induce EMT, among all the sending genes input into spacia, for each cell type. A smaller rank refers to a stronger interaction strength (larger β). (c) The top sending-receiving gene pairs inferred by spacia, for fibroblasts, endothelial cells and B cells as sending cell types. (d) The kernel density estimation of the EMT activation potentials in fibroblasts, endothelial cells and B cells. (e) The kernel density estimation of the EMT levels in prostate cancer cells. (f) The kernel density estimations of the stem-like, neuro-endocrine, and basal lineage plasticity scores in the prostate cancer cells. (g) UMAP plot showing the cell types of single cells from our prostate cancer patients. (h) The FGF expression of different sending cell types in the EMT+ and EMT− patients. (i) The EMT activation potentials of different sending cell types in the EMT+ and EMT− patients.
Fig. 4
Fig. 4
Spacia reveals PDL1 downstream target genes. (a) Sending and receiving cell type pairs that were analyzed by spacia for the breast cancer MERSCOPE dataset. (b) Left: One example ROI of the GeoMX data; right: the region of the H&E slide corresponding to the same ROI. (c) Abundances of each type of immune cells in the GeoMx data, as predicted by BayesPrism. Cell types are ordered by their average abundance across the 40 ROIs. (d) Odds ratios showing the overlap between spacia-inferred PDL1 downstream target genes and genes that are differentially expressed in each type of immune cells in the GeoMx data, comparing ROIs that are PDL1+ and PDL1− in the tumor cells. (e) Expression of several representative receiving genes that are in the overlap of (d) for B cells and CD8+ T cells, as a function of tumor cell PDL1 expression, in the GeoMx data. The fitted curves between the X axis and the Y axis are shown as solid lines, with the shading denoting 95% CI. (f) Gene set enrichment analysis (GSEA) in the TCGA breast and ovarian cancer datasets to evaluate if the corresponding CD8-PDL1 signature genes are indeed among the top genes that are differentially expressed between PDL1+ and PDL1− patients. (g) Expression levels of the CD8-PDL1 signatures in CD8+ T cells in the TCGA samples, dichotomized by tumor cell PDL1 expression.
Fig. 5
Fig. 5
The PDL1-CD8 signature is prognostic and predictive. (a) Prognostic value of the PDL1-CD8 signature for overall survival of TCGA patients of all eight cancer types. (b) Prognostic value of tumor PDL1 expression for overall survival of TCGA patients of all eight cancer types. (c) Prognostic value of the PDL1-CD8 signature for overall survival of TCGA breast cancer patients. (d) Prognostic value of tumor PDL1 expression for overall survival of TCGA breast cancer patients. (e) Forest plot of hazard ratios from a Cox proportional hazard (CoxPH) model considering cancer types as confounding variables for patients of all eight cancer types. 95% CI is indicated by the whiskers. (f) Forest plot of hazard ratios from a CoxPH model considering cancer stages as confounding variables for breast cancer patients. 95% CI is indicated by the whiskers. (g) The CD8-PDL1 signature expression levels of CD8+ T cells in responders/non-responders and in pre-/post-treatment samples from the Zhang et al study and Sade–Feldman et al study.
Fig. 6
Fig. 6
Spacia infers differential roles of γδ T cells in healthy livers and liver cancers. (a) The spatial distribution of stromal/immune cells in the liver cancer and healthy liver CosMx datasets. (b) The significant interactions between sending pathways in γδ T cells and receiving pathways in healthy/cancerous hepatocytes. Wider gray lines denote the more significant interactions. (c) Significant pathways from GO analyses of top receiving genes in healthy and cancerous hepatocytes, with SQSTM1 in γδ T cells as the sending gene. (d) Heatmap showing the βs between the SQSTM1 sending gene in γδ T and the MTOR/AKT1/CCND1 receiving genes in healthy and cancerous hepatocytes. A positive β denotes a positive regulation relationship.

References

    1. Bechtel T. J., Reyes-Robles T., Fadeyi O. O. & Oslund R. C. Strategies for monitoring cell-cell interactions. Nat. Chem. Biol. 17, 641–652 (2021). - PubMed
    1. Armingol E., Officer A., Harismendy O. & Lewis N. E. Deciphering cell-cell interactions and communication from gene expression. Nat. Rev. Genet. 22, 71–88 (2021). - PMC - PubMed
    1. Dimitrov D. et al. Comparison of methods and resources for cell-cell communication inference from single-cell RNA-Seq data. Nat. Commun. 13, 3224 (2022). - PMC - PubMed
    1. Wang S. et al. A systematic evaluation of the computational tools for ligand-receptor-based cell-cell interaction inference. Brief. Funct. Genomics 21, 339–356 (2022). - PMC - PubMed
    1. Jin S. et al. Inference and analysis of cell-cell communication using CellChat. Nat. Commun. 12, 1088 (2021). - PMC - PubMed

Publication types