[Preprint]. 2024 Oct 22:2023.09.20.558163.
doi: 10.1101/2023.09.20.558163.

A transcriptionally active lipid vesicle encloses the injected Chimalliviridae genome in early infection

Affiliations

A transcriptionally active lipid vesicle encloses the injected Chimalliviridae genome in early infection

Emily G Armbruster et al. bioRxiv. .

Abstract

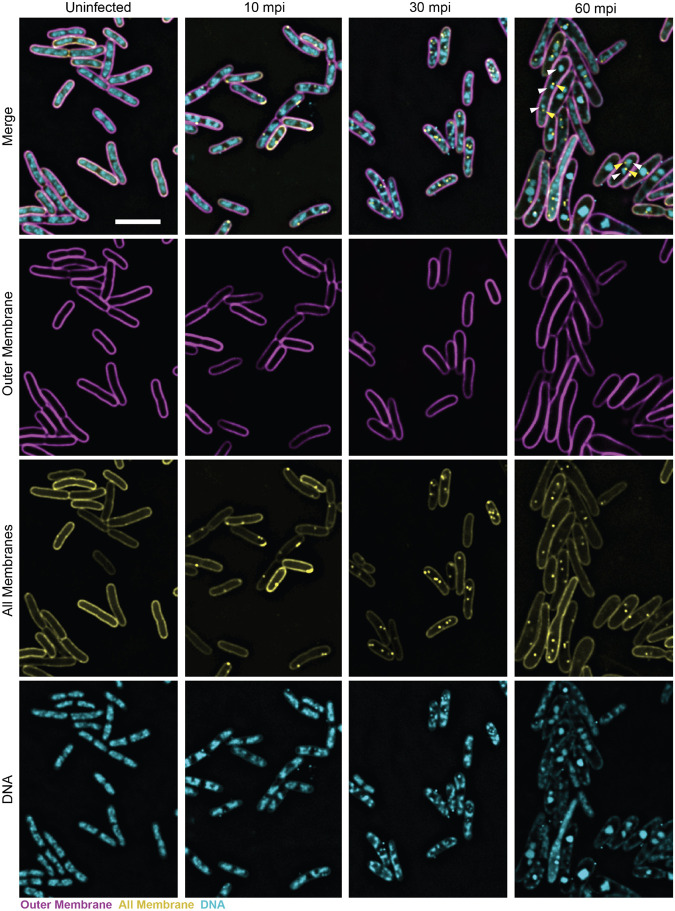
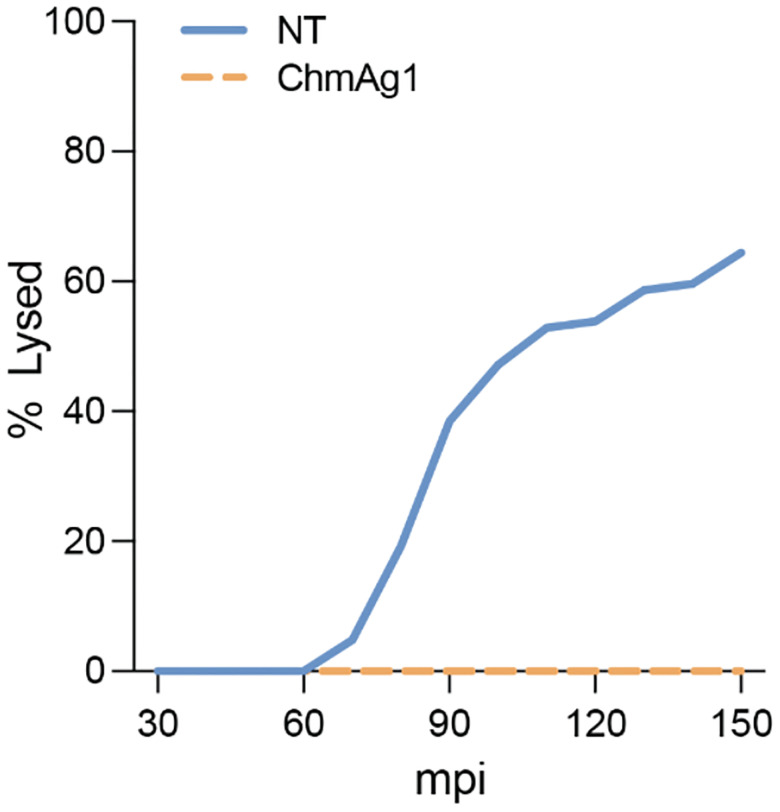
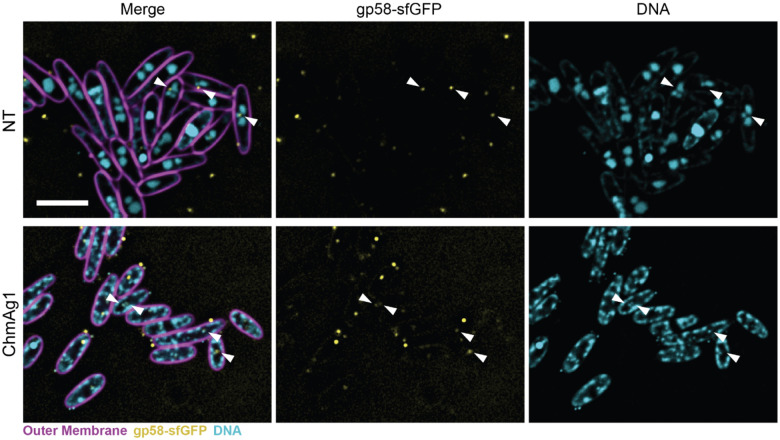
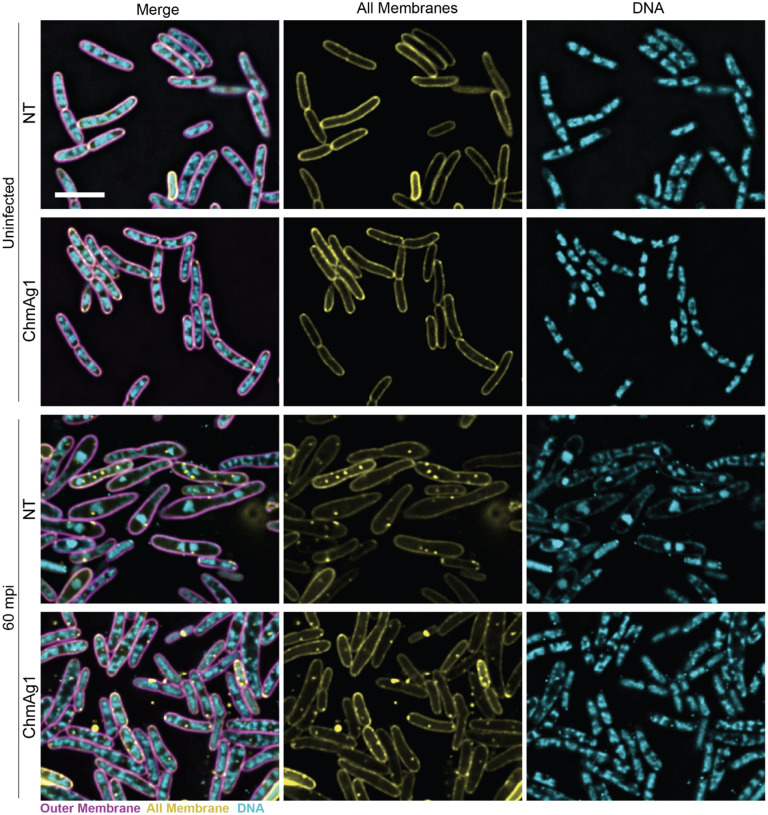
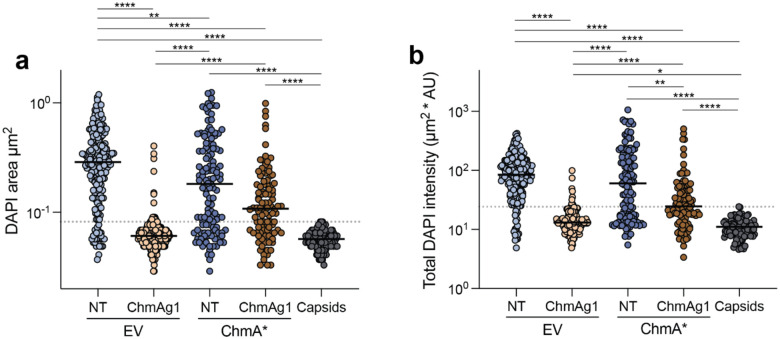
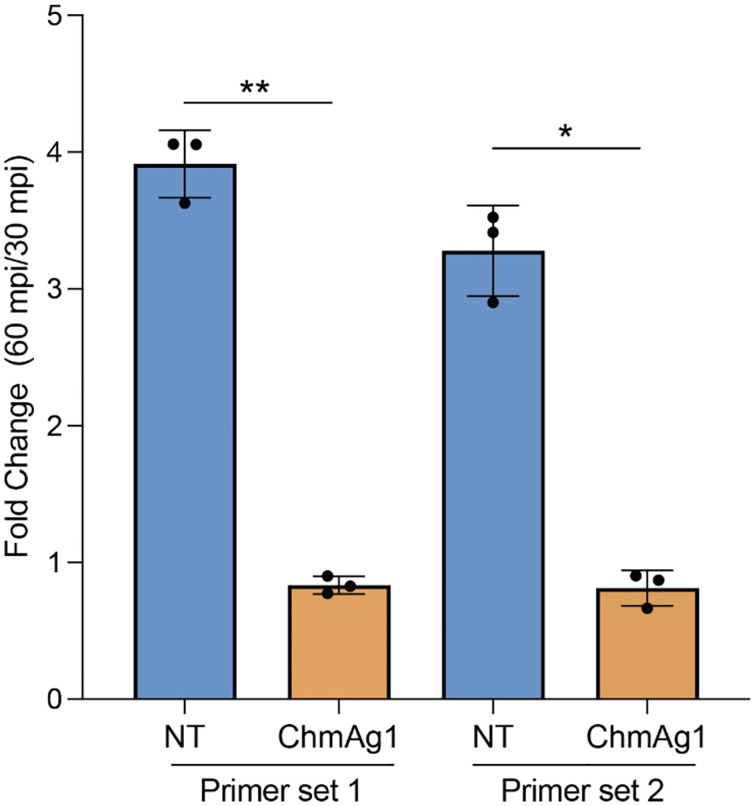
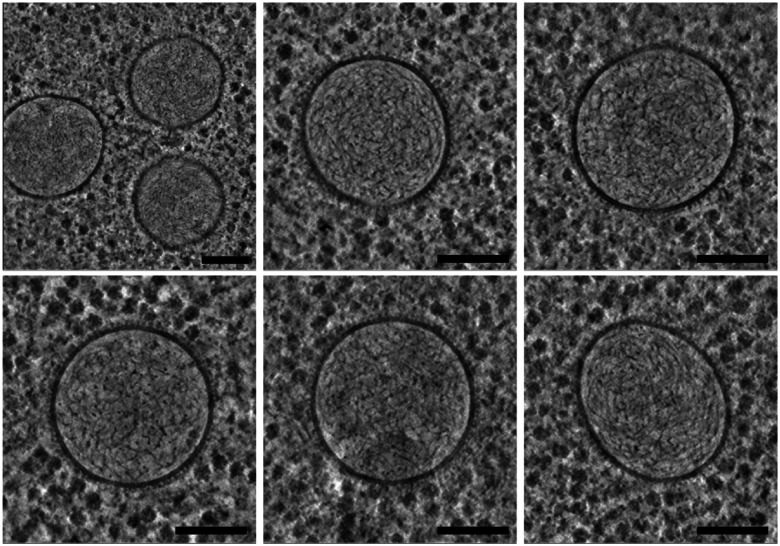
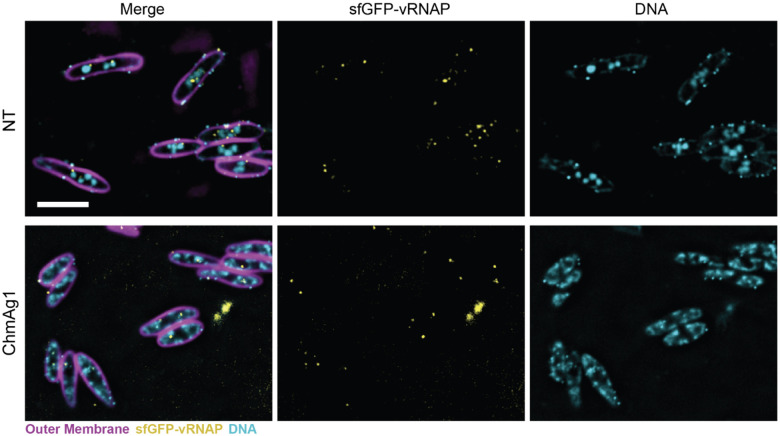
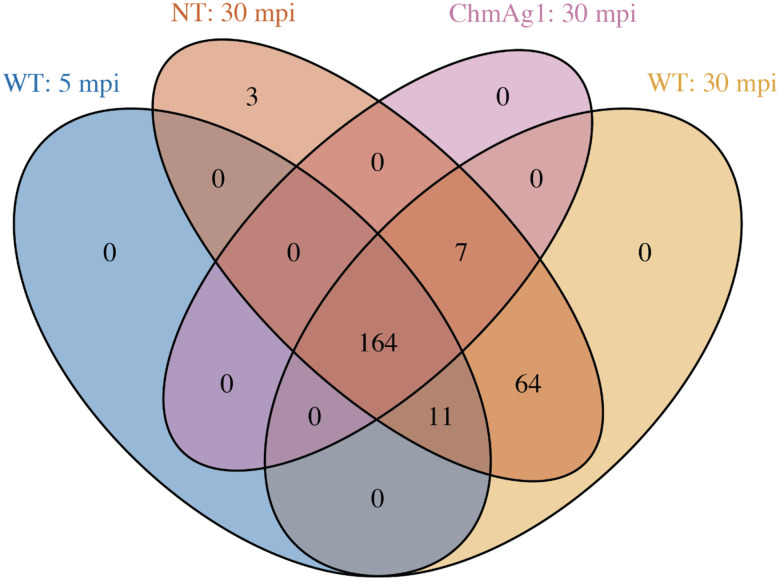
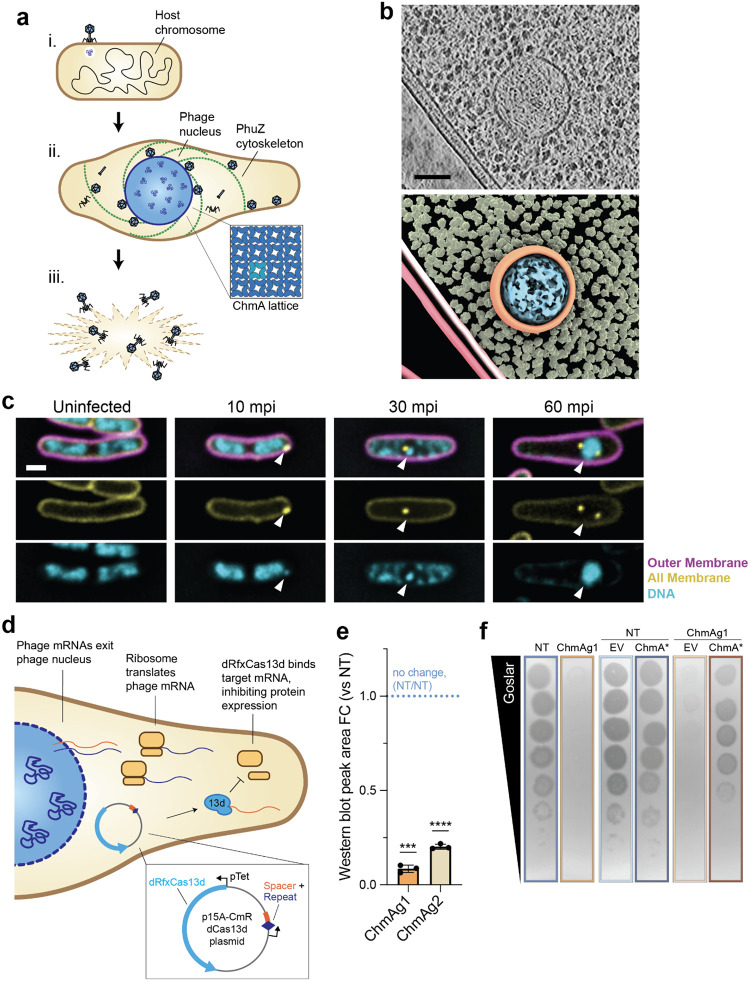
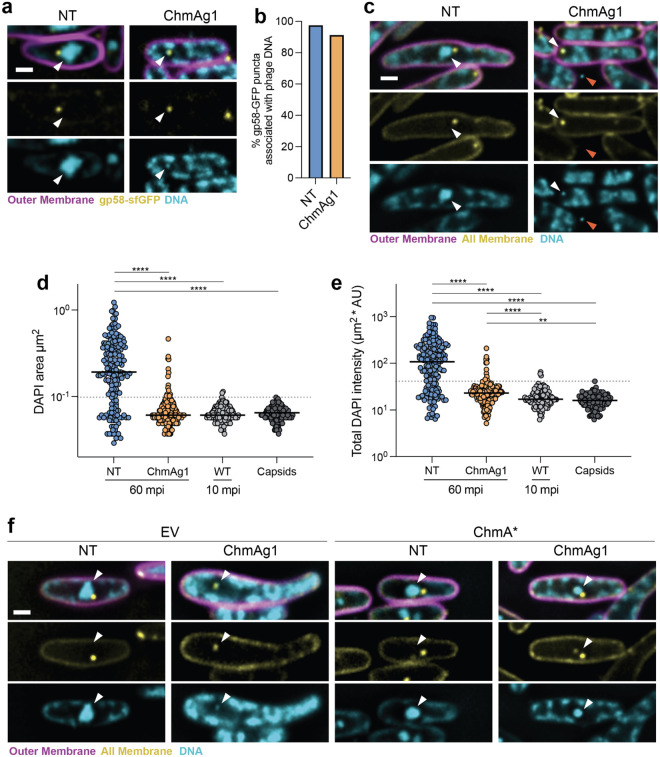
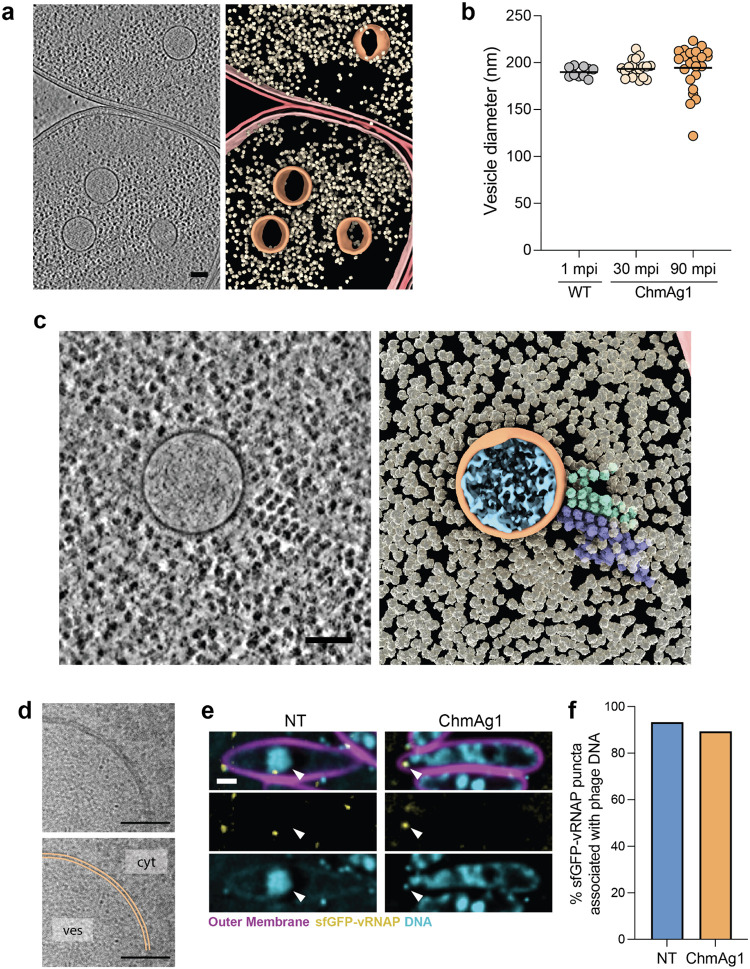
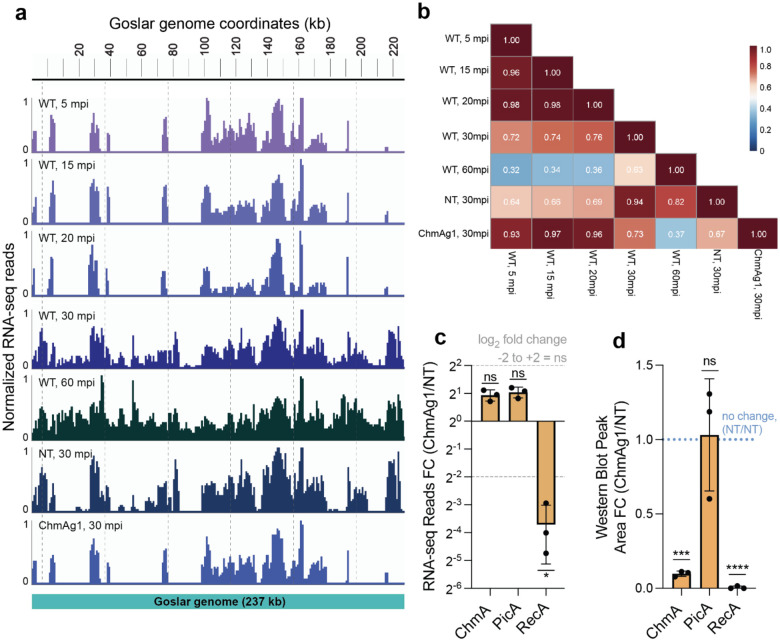
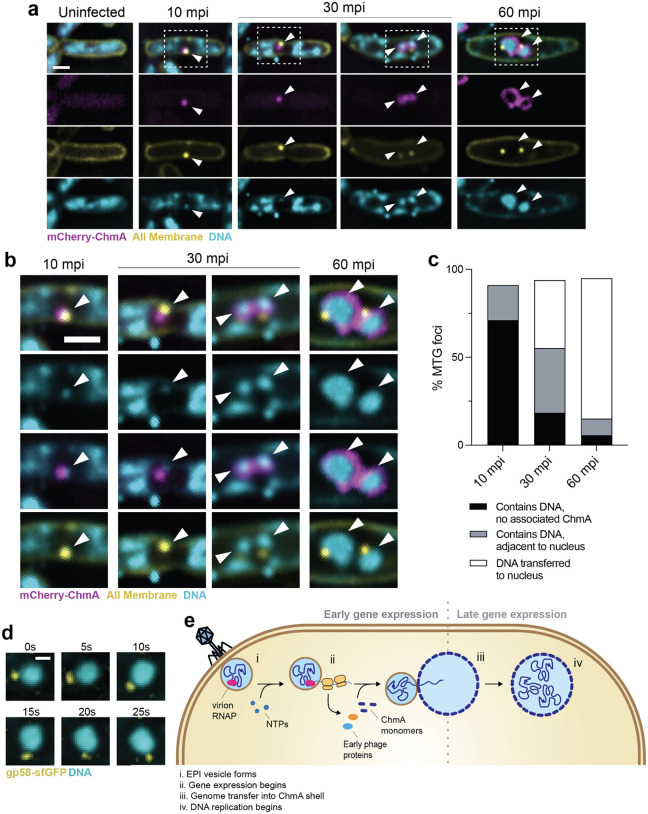
Many eukaryotic viruses require membrane-bound compartments for replication, but no such organelles are known to be formed by prokaryotic viruses1-3. Bacteriophages of the Chimalliviridae family sequester their genomes within a phage-generated organelle, the phage nucleus, which is enclosed by a lattice of the viral protein ChmA4-10. Previously, we observed lipid membrane-bound vesicles in cells infected by Chimalliviridae, but due to the paucity of genetics tools for these viruses it was unknown if these vesicles represented unproductive, abortive infections or a bona fide stage in the phage life cycle. Using the recently-developed dRfxCas13d-based knockdown system CRISPRi-ART11 in combination with fluorescence microscopy and cryo-electron tomography, we show that inhibiting phage nucleus formation arrests infections at an early stage in which the injected phage genome is enclosed within a membrane-bound early phage infection (EPI) vesicle. We demonstrate that early phage genes are transcribed by the virion-associated RNA polymerase from the genome within the compartment, making the EPI vesicle the first known example of a lipid membrane-bound organelle that separates transcription from translation in prokaryotes. Further, we show that the phage nucleus is essential for the phage life cycle, with genome replication only beginning after the injected DNA is transferred from the EPI vesicle to the newly assembled phage nucleus. Our results show that Chimalliviridae require two sophisticated subcellular compartments of distinct compositions and functions that facilitate successive stages of the viral life cycle.


Conflict of interest statement

Competing interest statement K.P. and J.P. have an equity interest in Linnaeus Bioscience Incorporated and receive income. The terms of this arrangement have been reviewed and approved by the University of California, San Diego, in accordance with its conflict-of-interest policies. The Regents of the University of California have patents issued and pending for CRISPR technologies on which J.A.D., B.F.C., B.A.A., D.F.S., E.C., J.P., K.P., E.G.A. and J.L. are inventors. J.A.D. is a cofounder of Caribou Biosciences, Editas Medicine, Scribe Therapeutics, Intellia Therapeutics, and Mammoth Biosciences. J.A.D. is a scientific advisory board member of Vertex, Caribou Biosciences, Intellia Therapeutics, Scribe Therapeutics, Mammoth Biosciences, Algen Biotechnologies, Felix Biosciences, The Column Group, and Inari. J.A.D. is Chief Science Advisor to Sixth Street, a Director at Johnson & Johnson, Altos and Tempus, and has research projects sponsored by Apple Tree Partners and Roche. D.F.S. is a cofounder and scientific advisory board member of Scribe Therapeutics. All other authors declare no competing interests.

Figures

Extended Data Fig. 1|
Extended Data Fig. 1|. Representative microscopy fields of uninfected or Goslar-infected WT E. coli (10, 30 or 60 mpi).
Cell outer membranes were stained with FM4–64 (magenta), all cell membranes were stained with MitoTracker Green FM (yellow) and DNA was stained with DAPI (cyan). Scale bar = 5 μm. White arrows: examples of multiple phage nuclei within an individual cell. Yellow arrows: examples of multiple MTG foci within an individual cell.
Extended Data Fig. 2|
Extended Data Fig. 2|. Mitotracker Green FM (MTG) foci and gp58 are associated with intracellular DNA foci or phage nuclei in WT E. coli.
a, Percentage of MTG foci that associate with DNA foci and larger phage nuclei over the course of infection in WT E. coli. n: WT uninfected (Uninf.) = 7, WT 10 mpi = 117, WT 30 mpi = 392, WT 60 mpi = 436, NT 60 mpi = 252, ChmA KD 60 mpi = 216. b, gp58-sfGFP (yellow) localization in WT E. coli at 10 mpi. Cell outer membranes were stained with FM4–64 (magenta) and DNA was stained with DAPI (cyan). Scale bar = 1 μm. c, Percentage of intracellular gp58-sfGFP foci associated with DNA foci in the same dataset as panel b. n = 40.
Extended Data Fig. 3|
Extended Data Fig. 3|. Goslar coinfections in fluorescence microscopy.
a, Percentage of cells containing specified numbers of phage DNA objects including mature phage nuclei or DNA foci 60 mpi. n: WT = 178, NT = 88, ChmAg1 = 88. b, Percentage of cells containing specified numbers of MitoTracker Green FM (MTG) foci in the same datasets as a.
Extended Data Fig. 4|
Extended Data Fig. 4|. Guide RNA and target chmA sequences.
The position and orientation of the chmA gene relative to its neighboring genes in the Goslar genome are shown above the WT chmA sequence that is targeted by ChmAg1 and ChmAg2, as well as the recoded region of chmA (chmA*). The translational start site is boxed in gray. Recoded nucleotides in chmA* are capitalized in pink. TSS: transcriptional start sites of chmA and nvRNAP β’ (1). The first nucleotide indicated for each TSS sequence is 91 nucleotides upstream of their respective translational start sites.
Extended Data Fig. 5|
Extended Data Fig. 5|. Lane view of a representative western blot collected on the ProteinSimple Jess Automated Western Blot System.
Samples of Goslar-infected non-targeting control (NT) and ChmA knockdown (ChmAg1 or ChmAg2) cells were collected at 60 mpi. The ladder and RpoB loading control were detected via chemiluminescence (gray). Goslar ChmA was detected via near-infrared (red).
Extended Data Fig. 6|
Extended Data Fig. 6|. Percentage of infected cells lysed up to 150 mpi.
Comparison of time-to-lysis for Goslar infections in the non-targeting (NT, n = 104) and knockdown (ChmAg1, n = 81) strains. Infected cells were identified by the observation of phage nuclei and/or characteristic cell envelope bulging by brightfield microscopy.
Extended Data Fig. 7|
Extended Data Fig. 7|. Representative microscopy fields of non-targeting control (NT) and ChmA knockdown (ChmAg1) cells infected with Goslar labeled with GFP-tagged injected phage protein gp58 at 60 mpi.
Outer membranes were stained with FM4–64 (magenta) and DNA was stained with DAPI (cyan). gp58-sfGFP is shown in yellow. White arrows indicate gp58-sfGFP foci associated with DNA foci and larger phage nuclei DNA. Scale bar = 5 μm.
Extended Data Fig. 8|
Extended Data Fig. 8|. Representative microscopy fields of uninfected or Goslar-infected non-targeting control (NT) and knockdown (ChmAg1) cells.
Cell outer membranes were stained with FM4–64 (magenta), all membranes were stained with MitoTracker Green FM (yellow) and DNA was stained with DAPI (cyan). Scale bar = 5 μm.
Extended Data Fig. 9|
Extended Data Fig. 9|. Representative microscopy fields of Goslar-infected non-targeting (NT) and knockdown (ChmAg1) cells with or without expression of ChmA* 60 mpi.
EV = empty vector. Cell outer membranes were stained with FM4–64 (magenta), all membranes were stained with MitoTracker Green FM (yellow) and DNA was stained with DAPI (cyan). Scale bar = 5 μm.
Extended Data Fig. 10|
Extended Data Fig. 10|. Quantification of phage DNA object cross-sectional area and total DAPI intensity during ChmA knockdown complementation.
a, Cross-sectional area (μm2) of phage DNA objects in complementation strains and extracellular phage capsids in the same microscopy fields. Dotted gray line: maximum cross-sectional area of extracellular capsid DNA. b, total DAPI intensity (mean intensity in AU * cross-sectional area in μm2) of the same phage DNA objects as in panel a. Dotted gray line: maximum total DAPI intensity of extracellular capsid DNA. Black lines: median. n for a and b: NT, EV = 202; ChmAg1, EV = 173; NT, ChmA* = 126; ChmAg1, ChmA* = 102, Capsids = 108. * p ≤ 0.05; ** p ≤ 0.01; *** p ≤ 0.001; **** p ≤ 0.0001 (Dunn’s multiple comparisons test).
Extended Data Fig. 11|
Extended Data Fig. 11|. Phage genome replication between 30 and 60 mpi in non-targeting control (NT) or ChmA knockdown (ChmAg1) cells.
Goslar DNA levels were quantified via qPCR. Two pairs of primers (set 1 and set 2) were used to confirm results. p values: primer set 1 = 0.0014, primer set 2 = 0.0102 (two-tailed, paired t-test).
Extended Data Fig. 12a|
Extended Data Fig. 12a|. Representative intracellular vesicles.
Tomogram slices through DNA-containing, membrane-bound intracellular vesicles in infected ChmA knockdown cells 90 mpi. Scale bars = 100 nm.
Extended Data Fig. 12b|
Extended Data Fig. 12b|. Vesicles with polysomes.
Slices through tomograms of vesicles in infected ChmA knockdown cells 90 mpi (left) and 30 mpi (middle and right). White arrows indicate polysomes. Scale bars = 200 nm.
Extended Data Fig. 13|
Extended Data Fig. 13|. Representative microscopy fields of non-targeting (NT) and ChmA knockdown (ChmAg1) cells infected with Goslar loaded with GFP-tagged virion RNAP subunit gp196.
Cell outer membranes were stained with FM4–64 (magenta) and DNA was stained with DAPI (cyan). sfGFP-gp196 is shown in yellow. Scale bar = 5 μm.
Extended Data Fig. 14|
Venn diagram of unique and overlapping expressed Goslar genes between 5 mpi and 30 mpi WT E. coli, ChmA knockdown 30 mpi and the control (NT) strain 30 mpi.
Extended Data Fig. 15|
Extended Data Fig. 15|. Normalized average fold change in transcript reads for each Goslar gene at 30 mpi (ChmAg1/NT).
Upregulation: >2 log2 fold change, downregulation: <−2 log2 fold change. Non-significant (ns) fold change: between dotted lines. Genes are displayed in the same order they are found in the Goslar genome. Bars representing Goslar core genes are color coded as indicated in the “Core Genome Blocks” legend.
Extended Data Fig. 16|
Extended Data Fig. 16|. Normalized average fold change in RNA-seq reads of a subset of Goslar genes (ChmAg1/NT 30 mpi).
Upregulation: >2 log2 fold change, downregulation: <−2 log2 fold change. Non-significant (ns) fold change: between dashed lines. Dark gray: genes required for phage nucleus assembly and/or function, as well as phage tubulin homolog Phuz expressed early during infection. Light gray: structural genes, the terminase large subunit and the Goslar RecA homolog expressed late during infection.
Extended Data Fig. 17|
Extended Data Fig. 17|. Lane view of a representative western blot collected on the ProteinSimple Jess Automated Western Blot System.
Samples of Goslar-infected non-targeting (NT) and ChmA knockdown (ChmAg1) cells were collected at 30 mpi. The ladder and RpoB loading control were detected via chemiluminescence (gray). Goslar target proteins ChmA, PicA and RecA were detected via near-infrared (red). Labels above lanes indicate primary antibody used in each lane.
Extended Data Fig. 18|
Extended Data Fig. 18|. Representative microscopy fields of E. coli cells expressing mCherry-ChmA infected with Goslar.
mCherry-ChmA is represented in magenta. All membranes were stained with Mitotracker Green FM (yellow) and DNA was stained with DAPI (cyan). Scale bar = 5 μm.
Extended Data Fig. 19|
Extended Data Fig. 19|. Percentages of mCherry-ChmA shells associated with MTG-stained EPI vesicles.
n: 10 mpi = 29, 30 mpi = 227, 60 mpi = 209.
Fig. 1|
Fig. 1|. Vesicles form early during Goslar infection and CRISPRi-ART knocks down phage nucleus protein ChmA.
a, Goslar life cycle: i) phage attachment and genome injection, ii) phage nucleus growth and genome replication. Inset: ChmA lattice in side-view (tetramer = cyan), iii) host cell lysis. b, Tomogram slice (top) and segmentation (bottom) of a DNA-containing, membrane-bound vesicle in a WT E. coli cell collected for imaging ~1 mpi. In the segmentation, outer and inner cell membranes are burgundy and pink respectively, ribosomes are yellow, vesicle membrane is orange, and DNA within the vesicle is cyan. c, Goslar infection progression in WT E. coli. White arrows = phage DNA. Magenta = Outer membranes (FM4–64), yellow = all membranes (MitoTracker-Green FM), cyan = DNA (DAPI). d, Goslar protein expression knockdown via CRISPRi-ART. Viral mRNAs (orange and blue) are exported from the phage nucleus and proteins are expressed by host ribosomes. Expression of a target protein is inhibited by dRfxCas13d (“13d”) programmed with guide RNA binding the corresponding transcript’s (orange) translational start site. dRfxCas13d and guide RNA are expressed from one plasmid (inset). e, Mean fold change in ChmA peak area in Goslar-infected E. coli lysates expressing dRfxCas13d and either ChmAg1 or ChmAg2 relative to the non-targeting guide (NT). Error bars = standard deviation. *** p < 0.001; **** p < 0.0001 (two-tailed one sample t-test). f, Representative plaque assay plates comparing Goslar plaque production on various strains. Guides: NT = non-targeting, ChmAg1 = ChmA knockdown. ChmA* = complementation vector expressing recoded ChmA (see Methods and Extended Data Fig. 4), EV = empty complementation vector. Scale bars: b = 100 nm; c = 1 μm.
Fig. 2|
Fig. 2|. ChmA knockdown inhibits phage DNA replication.
a, Non-targeting (NT) and ChmA knockdown (ChmAg1) cells infected with Goslar carrying gp58-sfGFP (yellow) 60 mpi. b, Percentage of intracellular gp58-sfGFP foci associated with phage DNA in the same dataset as panel a. n: NT = 123, ChmAg1 = 194. c, Goslar-infected non-targeting (NT) and ChmA knockdown (ChmAg1) cells infected with WT Goslar at 60 mpi. Intracellular vesicle membranes (and all other membranes) are stained with Mitotracker Green FM (yellow). d and e, Cross-sectional area (d) and total DAPI intensity (mean intensity in AU * cross-sectional area in μm2, e) of DAPI-stained phage DNA at 60 mpi in the non-targeting control (NT) and ChmA knockdown (ChmAg1) strains, 10 mpi in WT E. coli (WT) and in extracellular phage heads (Capsids). Dotted gray lines: maximum cross-sectional area and total DAPI intensity of extracellular capsid DNA. Black lines: median. n: NT = 171, ChmAg1 = 167, WT = 122, Capsids = 111. ** p < 0.01; *** p < 0.001; **** p < 0.0001 (Dunn’s multiple comparisons test). f, Goslar-infected non-targeting (NT) or knockdown (ChmAg1) cells 60 mpi with or without expression of ChmA*. EV = empty complementation vector. White arrows: DAPI-stained phage DNA. Magenta = Outer membranes (FM4–64), cyan = DNA (DAPI). Scale bars: a, c, f = 1 μm.
Fig. 3|
Fig. 3|. ChmA knockdown arrests Goslar infection at the vesicle stage
a, Tomogram slice (left) and segmentation (right) of ChmA knockdown cells with at least one DNA-containing vesicle. b, Distribution of vesicle diameters in samples collected for cryo-ET at 1 mpi in WT E. coli (n = 10) and 30 mpi (n = 20) and 90 mpi (n = 24) in the ChmA knockdown strain (ChmAg1). Standard deviations: WT E. coli 1 mpi = 5.5 nm, ChmAg1 30 mpi = 9.3 nm, ChmAg1 90 mpi = 23.9 nm. c, Tomogram slice (left) and segmentation (right) of a vesicle in the cytoplasm of a ChmA knockdown cell with polysomes extending from the vesicle surface. d, High-dose 2D projections of vesicles. The inner and outer leaflets of the lipid bilayer of the vesicle’s membrane are traced in orange. Cyt = cytoplasm, ves = vesicle lumen. e, Non-targeting (NT) and ChmA knockdown (ChmAg1) cells infected with Goslar carrying sfGFP-vRNAP (yellow) 60 mpi. White arrows: DAPI-stained phage DNA. Magenta = Outer membranes (FM4–64), cyan = DNA (DAPI). f, Percentage of intracellular sfGFP-vRNAP foci associated with phage DNA in the same dataset as panel e. n: NT = 330, ChmAg1 = 310. In the tomogram segmentations (a and c), outer and inner membranes are burgundy and pink respectively, ribosomes are yellow, polysomes are light green and purple, vesicle membranes are orange, and DNA within the vesicle is cyan. Scale bars: a, c = 100 nm d = 50 nm; e = 1 μm.
Fig. 4|
Fig. 4|. The early phage infection (EPI) vesicle is transcriptionally active.
a, IGV (Integrative Genomics Viewer) snapshots of RNA-seq average read counts for Goslar transcripts at 5, 15, 20, 30 and 60 mpi during infection of WT E. coli, as well as 30 mpi in the non-targeting (NT) strain and ChmA knockdown strain (ChmAg1). The common peaks were taken from all biological replicates, where the height of each peak represents the average read counts normalized to the highest peak. The aligned reads were binned in a 1 kb window to the Goslar genome. The bottom bar represents Goslar genome size (237kb). b, Heatmap of Pearson correlation coefficients comparing Goslar’s transcriptional profile under the same conditions as in panel a. c, Normalized average fold change in transcript reads for ChmA, PicA, and Goslar’s RecA homolog 30 mpi in the ChmA knockdown (ChmAg1) strains relative to the control (NT). Upregulation: >2 log2 fold change, downregulation: < log2 fold change (*). Non-significant (ns) fold change: between dotted lines. d, Average peak area of Goslar proteins ChmA, PicA and RecA signal detected by western blot performed on the ProteinSimple Jess instrument in the ChmA knockdown (ChmAg1) strain 30 mpi relative to the control (NT). ns = non-significant, p > 0.05; *** p < 0.001; **** p < 0.0001 (two-tailed one sample t-test). Error bars (c and d) = standard deviation.
Fig. 5|
Fig. 5|. The viral genome is transferred from the EPI vesicle to the phage nucleus.
a, Time-course fluorescence microscopy of host cells expressing mCherry-ChmA (magenta). White arrows = DAPI-stained phage DNA position. Yellow = all membranes (MitoTracker-Green FM). Cyan = DNA (DAPI). At 30 mpi, examples of the pre- (left) and post-genome transfer (right) phenotype are shown. Boxed regions are shown in b. b, Zoomed in images of EPI vesicles and phage nuclei from panel a (boxed areas). c, Percentage of MTG foci with indicated spatial relationships with viral DNA and mCherry-ChmA. n: 10 mpi = 145, 30 mpi = 512, 60 mpi = 404. d, Time-lapse of gp58-sfGFP (yellow) rotating with DAPI-stained phage nucleus (cyan) in the NT control strain. s = seconds. e, Model of early infection. i) Goslar injects its genome along with its virion RNA polymerase (vRNAP, pink) into the membrane-bound EPI vesicle. ii) Supported by nucleotide import into the EPI vesicle (light blue), early viral genes are transcribed by the vRNAP and the mRNAs are exported to the cytoplasm for translation by host ribosomes (yellow). iii) The viral genome is transferred from the EPI vesicle to the ChmA shell (dark blue). iv) DNA replication begins. Scale bars: a,b = 1 μm; d = 0.5 μm.

References

    1. Knipe D. M., Prichard A., Sharma S. & Pogliano J. Replication compartments of eukaryotic and bacterial DNA viruses: Common themes between different domains of host cells. Annu. Rev. Virol. 9, 307–327 (2022). - PMC - PubMed
    1. Nevers Q., Albertini A. A., Lagaudrière-Gesbert C. & Gaudin Y. Negri bodies and other virus membrane-less replication compartments. Biochim. Biophys. Acta Mol. Cell Res. 1867, 118831 (2020). - PMC - PubMed
    1. Schmid M., Speiseder T., Dobner T. & Gonzalez R. A. DNA virus replication compartments. J. Virol. 88, 1404–1420 (2014). - PMC - PubMed
    1. Chaikeeratisak V., Birkholz E. A. & Pogliano J. The Phage Nucleus and PhuZ Spindle: Defining Features of the Subcellular Organization and Speciation of Nucleus-Forming Jumbo Phages. Front. Microbiol. 12, 641317 (2021). - PMC - PubMed
    1. Taxonomy Browser. International Committee on Taxonomy of Viruses (ICTV) https://ictv.global/taxonomy.

Publication types