

This is a preprint.
Shared and divergent transcriptomic regulation in nucleus accumbens D1 and D2 medium spiny neurons by cocaine and morphine
- PMID: 37781621
- PMCID: PMC10541108
- DOI: 10.1101/2023.09.19.558477
Shared and divergent transcriptomic regulation in nucleus accumbens D1 and D2 medium spiny neurons by cocaine and morphine
Update in
-
Cocaine and morphine induce shared and divergent transcriptional regulation in nucleus accumbens D1 and D2 medium spiny neurons.Mol Psychiatry. 2025 Sep;30(9):4247-4257. doi: 10.1038/s41380-025-03004-1. Epub 2025 Apr 5. Mol Psychiatry. 2025. PMID: 40188314
Abstract
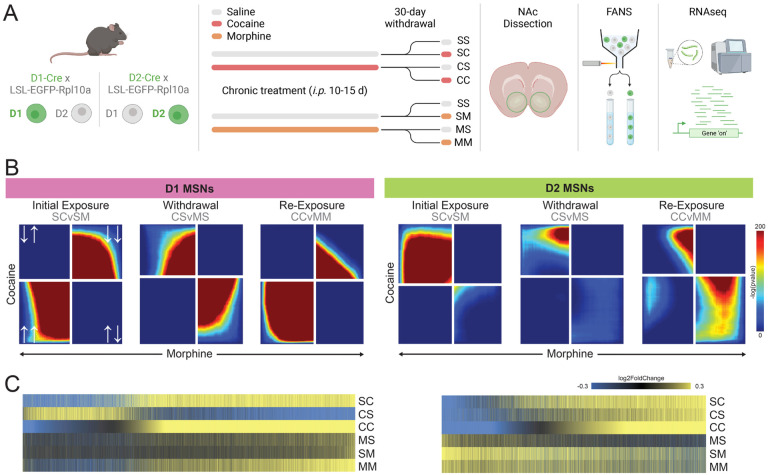
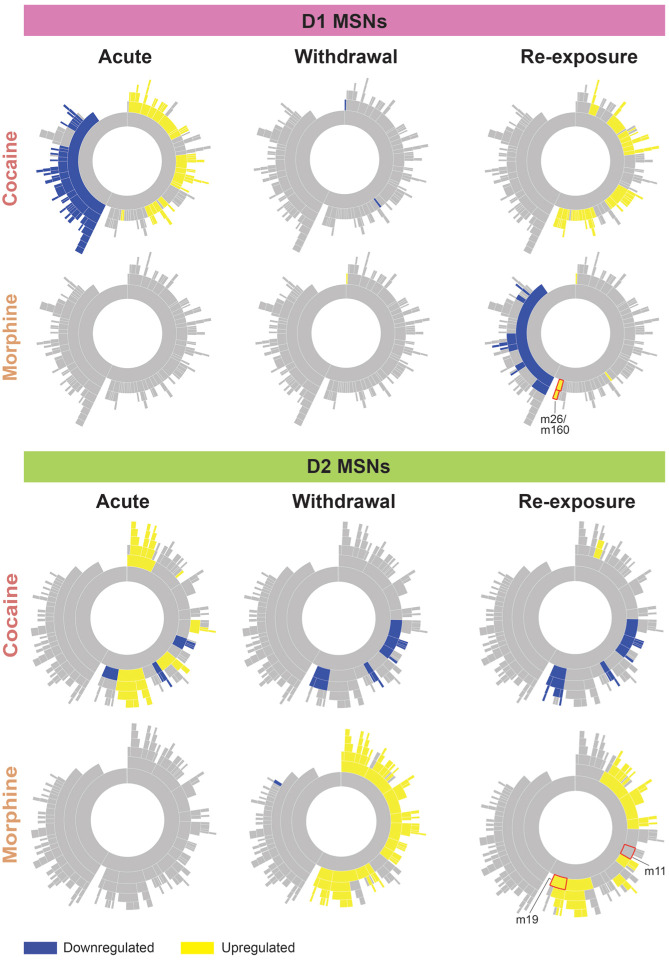
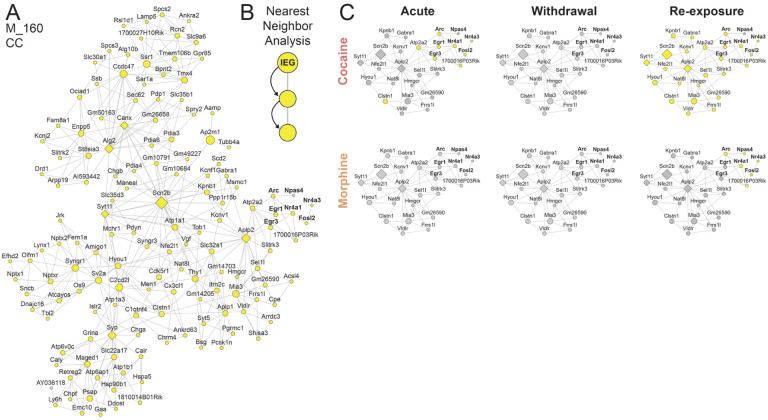
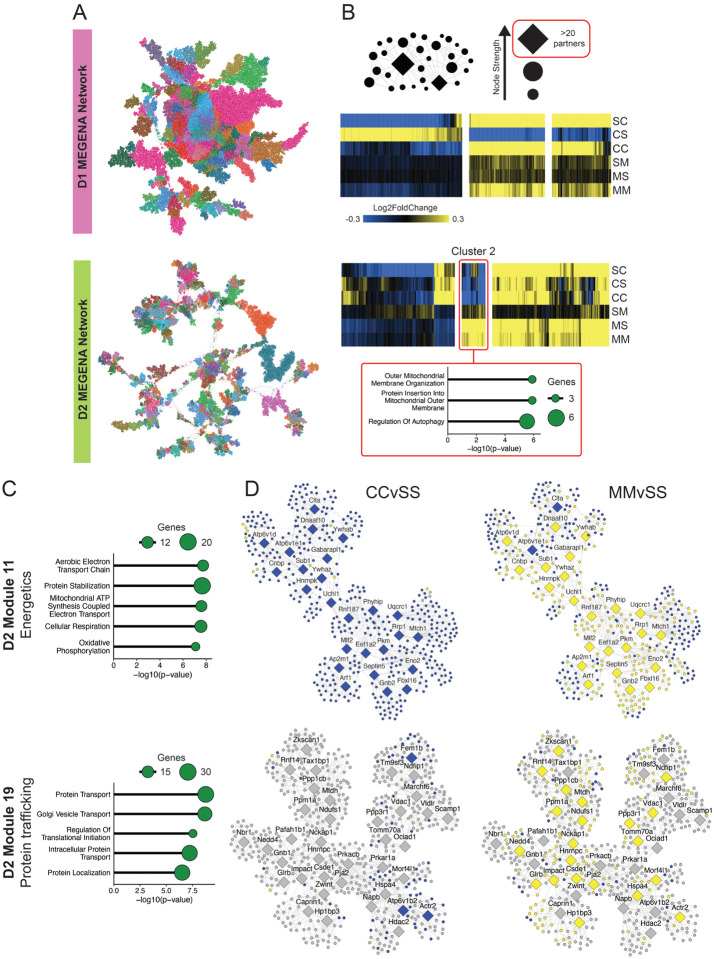
Substance use disorders (SUDs) induce widespread molecular dysregulation in the nucleus accumbens (NAc), a brain region pivotal for coordinating motivation and reward. These molecular changes are thought to support lasting neural and behavioral disturbances that promote drug-seeking in addiction. However, different drug classes exert unique influences on neural circuits, cell types, physiology, and gene expression despite the overlapping symptomatology of SUDs. To better understand common and divergent molecular mechanisms governing SUD pathology, our goal was to survey cell-type-specific restructuring of the NAc transcriptional landscape in after psychostimulant or opioid exposure. We combined fluorescence-activated nuclei sorting and RNA sequencing to profile NAc D1 and D2 medium spiny neurons (MSNs) across cocaine and morphine exposure paradigms, including initial exposure, prolonged withdrawal after repeated exposure, and re-exposure post-withdrawal. Our analyses reveal that D1 MSNs display many convergent transcriptional responses across drug classes during exposure, whereas D2 MSNs manifest mostly divergent responses between cocaine and morphine, with morphine causing more adaptations in this cell type. Utilizing multiscale embedded gene co-expression network analysis (MEGENA), we discerned transcriptional regulatory networks subserving biological functions shared between cocaine and morphine. We observed largely integrative engagement of overlapping gene networks across drug classes in D1 MSNs, but opposite regulation of key D2 networks, highlighting potential therapeutic gene network targets within MSNs. These studies establish a landmark, cell-type-specific atlas of transcriptional regulation induced by cocaine and by morphine that can serve as a foundation for future studies towards mechanistic understanding of SUDs. Our findings, and future work leveraging this dataset, will pave the way for the development of targeted therapeutic interventions, addressing the urgent need for more effective treatments for cocaine use disorder and enhancing the existing strategies for opioid use disorder.
Conflict of interest statement
Competing Interests The authors declare no competing financial interests.
Figures
Similar articles
-
Cocaine and morphine induce shared and divergent transcriptional regulation in nucleus accumbens D1 and D2 medium spiny neurons.Mol Psychiatry. 2025 Sep;30(9):4247-4257. doi: 10.1038/s41380-025-03004-1. Epub 2025 Apr 5. Mol Psychiatry. 2025. PMID: 40188314
-
Divergent Roles of Nucleus Accumbens D1- and D2-MSNs in Regulating Hedonic Feeding.bioRxiv [Preprint]. 2025 Jul 29:2025.07.23.666390. doi: 10.1101/2025.07.23.666390. bioRxiv. 2025. PMID: 40766710 Free PMC article. Preprint.
-
Cocaine-induced immediate-early gene expression in the nucleus accumbens: roles of separate cAMP sensors.bioRxiv [Preprint]. 2025 Apr 20:2025.04.15.648980. doi: 10.1101/2025.04.15.648980. bioRxiv. 2025. PMID: 40568139 Free PMC article. Preprint.
-
Psychological therapies for post-traumatic stress disorder and comorbid substance use disorder.Cochrane Database Syst Rev. 2016 Apr 4;4(4):CD010204. doi: 10.1002/14651858.CD010204.pub2. Cochrane Database Syst Rev. 2016. PMID: 27040448 Free PMC article.
-
Neurobiological Mechanisms of Action of Transcranial Direct Current Stimulation (tDCS) in the Treatment of Substance Use Disorders (SUDs)-A Review.J Clin Med. 2025 Jul 10;14(14):4899. doi: 10.3390/jcm14144899. J Clin Med. 2025. PMID: 40725591 Free PMC article. Review.
References
-
- Robinson TE, Berridge KC (1993): The neural basis of drug craving: an incentive-sensitization theory of addiction. Brain Res Brain Res Rev 18: 247–291. - PubMed
-
- Hyman SE, Malenka RC, Nestler EJ (2006): Neural mechanisms of addiction: the role of reward-related learning and memory. Annu Rev Neurosci 29: 565–598. - PubMed
-
- O’Brien CP (2003): Research advances in the understanding and treatment of addiction. Am J Addict 12: S36–S47. - PubMed
Publication types
Grants and funding
LinkOut - more resources
Full Text Sources