[Preprint]. 2023 Sep 19:2023.09.18.557933.
doi: 10.1101/2023.09.18.557933.

Early morning run-training results in enhanced endurance performance adaptations in mice

Affiliations

Early morning run-training results in enhanced endurance performance adaptations in mice

Stuart J Hesketh et al. bioRxiv. .

Abstract

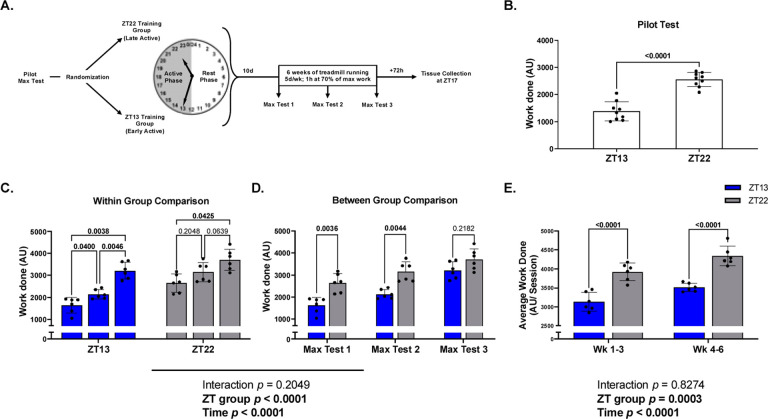
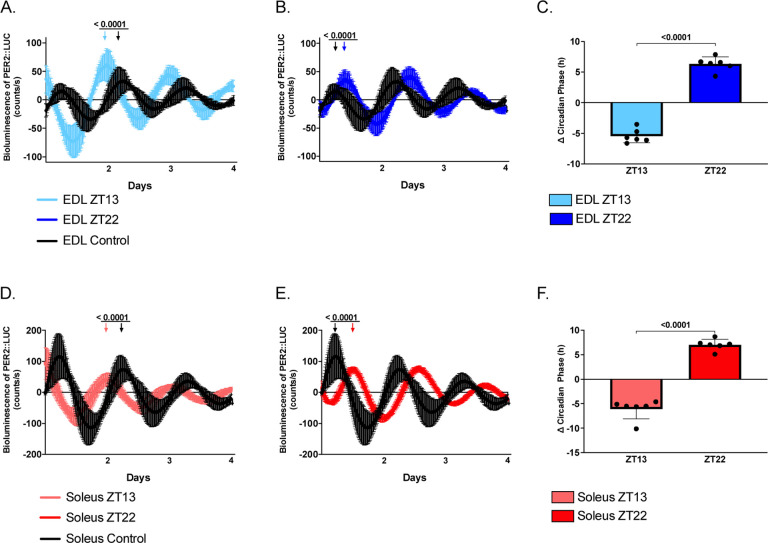
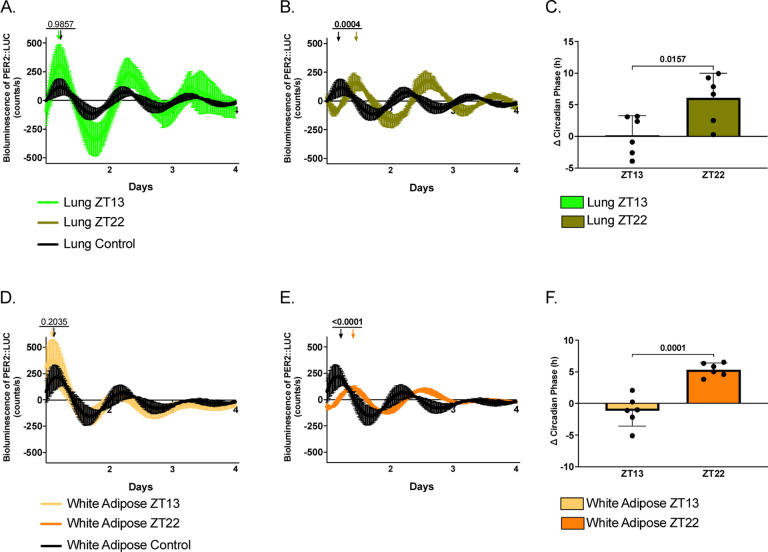
Time-of-day differences in acute exercise performance in mice are well established with late active phase (afternoon) runners exhibiting significantly greater endurance performance compared to early active phase (morning) runners. In this study, we asked if performance adaptations would be different when training for 6 weeks at two different times of day, and if this corresponds to steady state changes in the phase of peripheral tissue clocks. To address these questions, we endurance trained female PER2::Luciferase mice, at the same relative workload, either in the morning, at ZT13, or in the afternoon, at ZT22. Then, after training, we recorded luminescence from tissues of PER2::Luciferase mice to report timing of tissue clocks in several peripheral tissues. After 6 weeks, we found that both groups exhibited significant improvements in maximal endurance capacity (total treadmill work)(p < 0.0001), but the morning runners exhibited an enhanced rate of adaptation as there was no detectable difference in maximal endurance capacity (p = 0.2182) between the morning and afternoon runners. In addition, morning and afternoon runners exhibited divergent clock phase shifts with a significant 5-hour phase advance in the EDL (p < 0.0001) and soleus (p < 0.0001) of morning runners, but a phase delay in the EDL (p < 0.0001) and Soleus (p < 0.0001) of afternoon runners. Therefore, our data demonstrate that morning training enhances endurance adaptations compared to afternoon training in mice, and we suggest this is due to phase advancement of muscle clocks to better align metabolism with exercise performance.

Keywords: Circadian clock; endurance performance; exercise training; skeletal muscle.


Conflict of interest statement

Competing interests Authors have no competing interests to declare.

Figures

Figure 1.
Figure 1.. Time of exercise training reduces diurnal differences in exercise performance.
All data are presented as MEAN (SD) with individual values plotted, and significant p-values are bolded in the figure for identification. Each maximal test was conducted at ZT13 (blue bars) for the morning runners and at ZT22 (gray bars) for the afternoon runners. A. A schematic of the experimental design is presented to show the time-line of testing, grouping, and training. B. Ten days prior to the onset of training, a pilot test was conducted to confirm if diurnal differences in maximal run performance existed for Morning Runners (n = 9) Afternoon Runners (n = 9). C and D. Maximal endurance capacity testing was conducted prior to (Morning runners: n = 6); Afternoon Runners: n = 6), 3 weeks after, and 6 weeks after onset of training. Post-Hoc comparisons of morning runners and afternoon runners are shown through within-group and between-group comparisons. E. Average training volume of Morning and afternoon runners were also compared across weeks 1–3 and weeks 4–6.
Figure 2.
Figure 2.. Maximal capacity test blood markers and basal tissue glycogen content.
All data are presented as MEAN (SD) with individual values plotted, and significant p-values are bolded in the figure for identification. Each maximal test in A and B was conducted at ZT13 for the morning runners (blue bars)(n =6) and at ZT22 for the afternoon runners (gray bars)(n = 6). A and B. Acute blood markers of glucose and lactate were collected both pre and post each maximal testing bout. C and D. Tissue glycogen content for liver (μg/mg of tissue) and skeletal muscle (μg/mg of tissue) was collected 72h after completion of the final endurance testing session. Figures C and D are represented with black bars for control mice (n = 6), blue bars for morning runners (n = 6), and gray bars for afternoon runners (n = 6).
Figure 3.
Figure 3.. PER2::LUC mice cage activity and body composition profile.
Unless stated otherwise, data are displayed as MEAN (SD) with individual values plotted, and significant p-values are bolded in the figure for identification. Mice were individually housed for the duration of the time-of-day training program, and all animals were evaluated at weeks 1, 3, and 6 for cage activity and body composition. The sedentary control group is shown in black (n = 6), the ZT13 mass) are displayed to visually represent group comparisons over time.
Figure 4.
Figure 4.. Effects of 6 weeks exercise training on circadian phase of the skeletal muscle clock.
All data is represented as mean (SD) with individual values plotted for C and F, and significant p-values are bolded in the figure for identification. All animals in the sedentary control group (n = 6), ZT13 (n = 6) and ZT22 (n = 6) exercise training groups were killed 72 hours after their last bout of exercise, and tissues were placed in a lumicycle for culture at ZT17. Real-time bioluminescent tracing (baseline subtracted) of PER2::LUC activity is shown over 3 consecutive days for the explanted muscles. All data shows the sedentary control group as black. A and B. The extensor digitorum longus (EDL) muscle are shown in light blue for morning runners (ZT13) and in dark blue for the afternoon runners (ZT22), with the change in EDL phase from the control mice represented in C. D and E. The soleus is in light red for ZT13 and in dark red for ZT22, with the change in soleus phase from control mice shown in F. Arrows shown in A, B, D, and E indicate the timing of peak luminescence. For C and F, a decrease in phase indicates a phase advance, and an increase in phase represents a phase delay.
Figure 5.
Figure 5.. Effects of 6 weeks exercise training on circadian phase of the intrinsic clock for lung and white fat.
All data is represented as mean (SD) with individual values plotted for C and F, and significant p-values are bolded in the figure for identification. All animals in the sedentary control group (n = 6), ZT13 (n = 6) and ZT22 (n = 6) exercise training groups were killed 72 hours after their last bout of exercise, and tissues were placed in a lumicycle for culture at ZT17. Real-time bioluminescent tracing (baseline subtracted) of PER2::LUC activity is shown over 3 consecutive days for the explanted tissues. All data shows the sedentary control group in black. A and B. The lung tissue is shown in light green for the morning runners (ZT13) and in darker green for the afternoon runners (ZT22), with the lung phase difference compared to sedentary controls shown in C. D and E. White adipose tissue is shown in light orange for ZT13 and in darker orange for ZT22, with the white adipose phase difference compared to sedentary controls shown in F. Arrows shown in A, B, D, and E indicate the timing of peak luminescence. For (C) and (F), a decrease in phase indicates a phase advance, and an increase in phase represents a phase delay.

Similar articles

References

    1. Adamovich Y, Dandavate V, Ezagouri S, Manella G, Zwighaft Z, Sobel J, Kuperman Y, Golik M, Auerbach A, Itkin M, Malitsky S & Asher G (2021a). Clock proteins and training modify exercise capacity in a daytime-dependent manner. Proc Natl Acad Sci U S A 118, e2101115118. - PMC - PubMed
    1. Adamovich Y, Ezagouri S, Dandavate V & Asher G (2021b). Monitoring daytime differences in moderate intensity exercise capacity using treadmill test and muscle dissection. STAR Protoc 2, 100331. - PMC - PubMed
    1. Avila JJ, Kim SK & Massett MP (2017). Differences in Exercise Capacity and Responses to Training in 24 Inbred Mouse Strains. Front Physiol 8, 974. - PMC - PubMed
    1. Broussard JL, Ehrmann DA, Van Cauter E, Tasali E & Brady MJ (2012). Impaired insulin signaling in human adipocytes after experimental sleep restriction: a randomized, crossover study. Ann Intern Med 157, 549–557. - PMC - PubMed
    1. Chtourou H & Souissi N (2012). The effect of training at a specific time of day: a review. J Strength Cond Res 26, 1984–2005. - PubMed

Publication types