[Preprint]. 2023 Sep 20:2023.09.19.558525.
doi: 10.1101/2023.09.19.558525.

Site-Specific Crosslinking Reveals Phosphofructokinase-L Inhibition Drives Self-Assembly and Attenuation of Protein Interactions

Affiliations

Site-Specific Crosslinking Reveals Phosphofructokinase-L Inhibition Drives Self-Assembly and Attenuation of Protein Interactions

Athira Sivadas et al. bioRxiv. .

Update in

Abstract

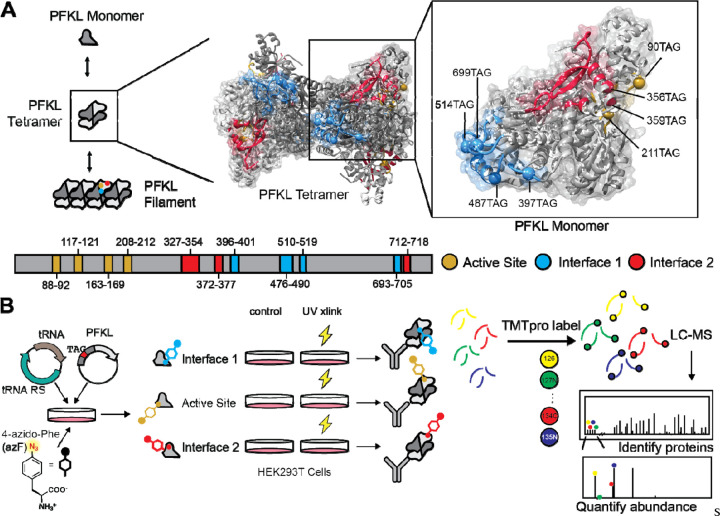
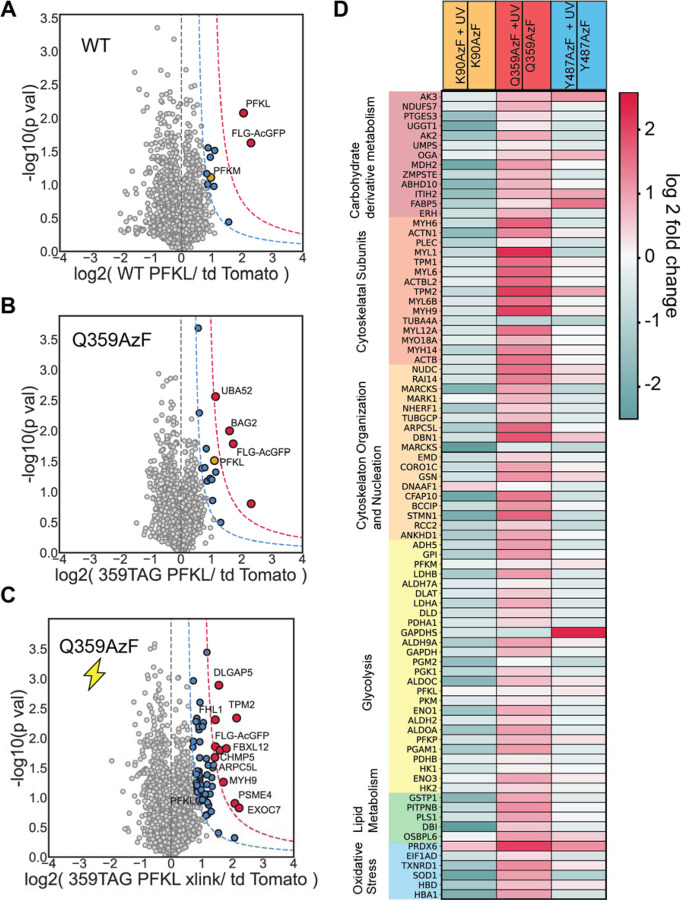
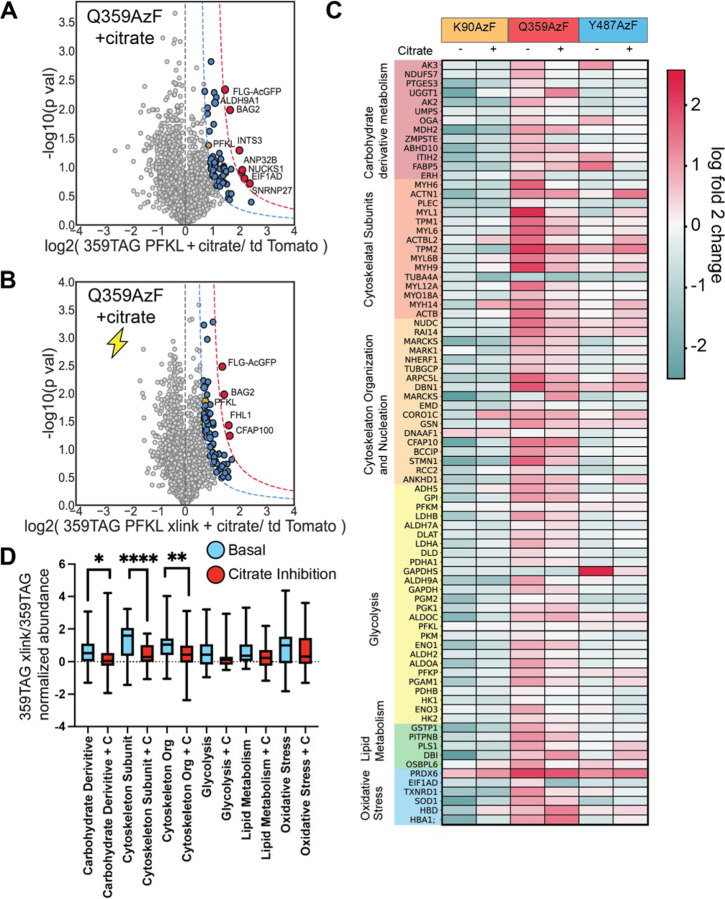
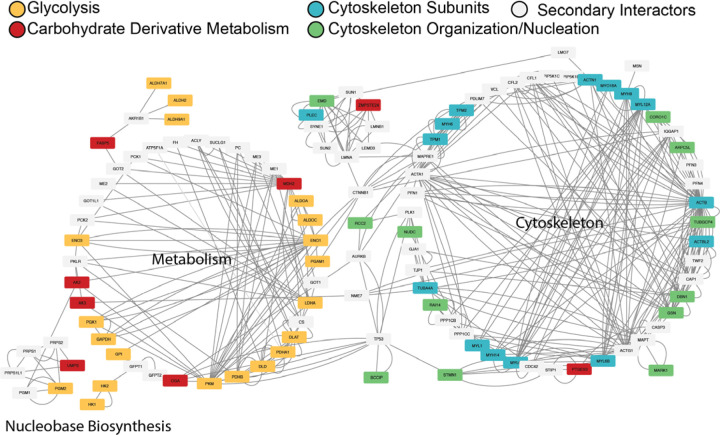
Phosphofructokinase is the central enzyme in glycolysis and constitutes a highly regulated step. The liver isoform (PFKL) compartmentalizes during activation and inhibition in vitro and in vivo respectively. Compartmentalized PFKL is hypothesized to modulate metabolic flux consistent with its central role as the rate limiting step in glycolysis. PFKL tetramers self-assemble at two interfaces in the monomer (interface 1 and 2), yet how these interfaces contribute to PFKL compartmentalization and drive protein interactions remains unclear. Here, we used site-specific incorporation of noncanonical photocrosslinking amino acids to identify PFKL interactors at interface 1, 2, and the active site. Tandem mass tag-based quantitative interactomics reveals interface 2 as a hotspot for PFKL interactions, particularly with cytoskeletal, glycolytic, and carbohydrate derivative metabolic proteins. Furthermore, PFKL compartmentalization into puncta was observed in human cells using citrate inhibition. Puncta formation attenuated crosslinked protein-protein interactions with the cytoskeleton at interface 2. This result suggests that PFKL compartmentalization sequesters interface 2, but not interface 1, and may modulate associated protein assemblies with the cytoskeleton.


Figures

Figure 1.
Figure 1.. Incorporating photochemical crosslinking amino acid 4-Azido-L-Phenylalanine (AzF) site-specifically into PFKL at different filament interfaces.
A. PFKL exists as an inactive monomer and forms tetramers to act as the third and rate-limiting step in glycolysis. PFKL also self-assembles into filaments in vitro and the interfaces of those filaments are shown on the tetramer and monomer for detail (PDB ID: 7LW1)(Amara et al., 2021) - the active site in gold, interface 1 s own in blue, and interface 2 shown in red(Webb et al., 2017). We introduce an amber stop codon at positions K90 and H211 in the active site, K397, Y487, Y514, and V699 in interface 1, as well as K356 and Q359 near interface 2. B. Schematic of the site-specific incorporation of AzF into PFKL. An AzF specific orthogonal tRNA/tRNA synthetase (RS) pair is co-transfected with PFKL containing an amber stop codon at the site of interest and cell growth media is supplemented with 1 mM AzF to allow for site-specific unnatural amino acid incorporation. Samples are then exposed to UV light to induce covalent crosslinking to interacting proteins. Finally, PFKL is immunopurified using a FLAG pulldown, crosslinked proteins are digested, TMT labeled, and pooled for LC-MS/MS quantification.
Figure 2.
Figure 2.. A. Representative Western blots of AzF dependent expression PFKL.
AzF was incorporated into active site. interface 2 substitution mutants K90TAG, H211TAG, K356TAG, Q359TAG, and interface 1 mutants K397TAG, Y487TAG, Y514TAG, Y699TAG. In cell lysates samples (input), 85 kDa PFKL, expression depends on the presence of 1 mM AzF supplemented in the media. B. Representative Western blots showing 268 nm UV dependent crosslinking band shifts in PFKL active site and interface 2 substitution mutants K90TAG, H211TAG, K356TAG, and Q359TAG. Active site mutants show weak crosslinked bands at > 250 kDa. Q359TAG shows robust crosslinking bands at 100kDa, indicating an interaction with a small protein of ~25kDa. Representative Western blots of interface 1 substitution mutants K397TAG, Y487TAG, Y514TAG, and Y699TAG. K397TAG shows robust crosslinking bands at 120kDa and > 250 kDa, Y487TAG shows crosslinking band shift at >250 kDa, and Y699TAG shows crosslinking at 150 kDa. C. K90TAG (active site), Q359TAG (interface 2), and Y487TAG (interface 1) show the most robust crosslinking bands and were thus selected for further analysis. Addition of the AcGFP1 fluorophore to these constructs increases the molecular weight of all bands by 25kDa. All three mutants retain the same crosslinking patterns. D. The activity of the different PFKL mutants with AzF incorporated was compared to that of WT PFKL for whole cell lysates. The x-axis represents the time after the reaction is initiated, and the y-axis represents [NADH] normalized to standards. [NADH] is proportional to enzyme activity. TdTomato represents a transfection control with only endogenous PFKL, while all other samples have endogenous PFKL as well as transfected PFKL.
Figure 3.
Figure 3.. Covalent crosslinking successfully enriches interacting proteins at interface 2 as measured by Q359AzF.
A. Volcano plot of WT PFKL over tdTomato mock transfection control for identification of interactors. The x-axis represents the log2 fold change of WT PFKL TMT quantification over the tdTomato TMT quantification across three biological replicates. The y-axis represents the -log10 transformed p-values, as calculated by a paired student’s t-test. Bait protein is labeled as PFKL and FLG-AcGFP1. Enrichment of bait proteins and lack of interactors demonstrates stringent washing steps remove non-covalent interacting proteins. High-confidence (red) and medium-confidence (blue) interactors are demarcated by curve cut off at 1σ’ and 2σ’ of the log2 fold change distribution respectively. Glycolytic interactors are represented in yellow. B. Volcano plot of Q359AzF over tdTomato mock transfection control for identification of interactors. Colored same as A (n = 4 biological replicates). C. Volcano plot of Q359AzF exposed to UV light and hence covalently crosslinked to interacting proteins compared tdTomato mock transfection control interactors across (n = 4). An increase of upregulated, statistically significant interactors indicates crosslinking was successful. Colored same as A. D. Heatmap comparing enrichment of interactors functioning in different cellular pathways (categorized according to GO-terms biological process) among the three mutants. The interactors enriched in the crosslinked samples are normalized to those enriched in the non-crosslinked samples. The log2 fold change is color coded (teal low, pink high enrichment). Site Q359 of PFKL near interface 2 demonstrates robust interactions with cytoskeletal subunits and a higher number of interactions overall compared to the other two sites.
Figure 4.
Figure 4.. Confocal microscopy of HEK293T cells transiently transfected with AcGFP1-PFKL.
Experimental samples were imaged 10 minutes after addition of citrate. A. WT PFKL in basal conditions. Fluorescence is diffuse, indicating that PFKL is dispersed throughout the cell. B. WT PFKL after addition of 20mM citrate. The fluorescence forms localizations around the periphery of the cell, indicating that PFKL is sequestering into puncta. C. 90TAG AcGFP1 PFKL mutant in basal conditions. D. 90TAG AcGFP1 PFKL mutant after addition of 20mM citrate. Localizations of fluorescence are still observed, but to a lower extent than seen for WT PFKL. E. 359TAG AcGFP1 PFKL mutant in basal conditions. F. 359TAG AcGFP1 PFKL mutant after addition of 20mM citrate. G. 487TAG AcGFP1 PFKL in basal conditions. H. 487TAG AcGFP1 PFKL after addition of 20mM citrate.
Figure 5.
Figure 5.. Sodium citrate treatment attenuates interaction with cytoskeletal and carbohydrate derivative metabolism proteins at interface 2.
A. Volcano plots of Q359AzF with 20 mM citrate. The x-axis represents the log2 fold change of interactors between Q359AzF treated citrate compared to the tdTomato control (n = 4 biological replicates). The Y axis represents the -log10 transformed p-values, as calculated by student’s t-test. Bait protein is labeled as PFKL and FLG-AcGFP1. High-confidence (red) and medium-confidence (blue) interactors are demarcated at the curve cut offs over 1σ’ and 2 σ’ respectively. Glycolytic interactors are represented in yellow. B. Volcano plots of Q359AzF with 20 mM citrate exposed to UV light across. Colored the same as A (n = 4). C. Heatmap comparing enrichment of interactors functioning in different cellular pathways (categorized according to GO-terms biological process) among the three assessed mutants. Each row represents the log2 fold change of crosslinked samples (e.g. + UV light) over the respective sample without crosslinking (e.g. no UV light). The addition of citrate to both the crosslinked and non-crosslinked samples in indicated. The interactors enriched in the crosslinked samples are normalized to those enriched in the non-crosslinked samples. The log2 fold change is color coded (teal low, pink high enrichment). D. Aggregated interactions by pathways from C. in the 359TAG xlink/359TAG and 359TAG xlink + citrate /359TAG + citrate conditions.
Figure 6.
Figure 6.. Protein interaction network reveals clusters between identified PFKL interactors.
STRING database search was performed for the top 20 interacting proteins. Extended and overlapping interactors between identified PFKL interactions in four important pathways: Glycolysis, Carbohydrate Derivative Metabolism, Cytoskeleton Subunit proteins, and Cytoskeleton Organization/Nucleation proteins. Primary PFKL interactors in the Glycolysis pathway are shown as gold rectangles, primary PFKL interactors in the Carbohydrate Derivative Metabolism are shown as red rectangles, primary PFKL interactors with Cytoskeleton Subunit proteins are shown as blue rectangles, and primary PFKL interactors with Cytoskeleton Organization proteins are shown as green rectangles. Overlapping secondary interactors scraped from the STRING database are shown as grey rectangles. PFKL, which interacts directly with all colored proteins, and proteins that failed to demonstrate any overlapping interactors were excluded for clarity.

Similar articles

References

    1. Akram M., 2013. Mini-review on Glycolysis and Cancer. J. Cancer Educ. 28, 454–457. 10.1007/s13187-013-0486-9 - DOI - PubMed
    1. Amara N., Cooper M.P., Voronkova M.A., Webb B.A., Lynch E.M., Kollman J.M., Ma T., Yu K., Lai Z., Sangaraju D., Kayagaki N., Newton K., Bogyo M., Staben S.T., Dixit V.M., 2021. Selective activation of PFKL suppresses the phagocytic oxidative burst. Cell 184, 4480–4494.e15. 10.1016/j.cell.2021.07.004 - DOI - PMC - PubMed
    1. Campanella M.E., Chu H., Low P.S., 2005. Assembly and regulation of a glycolytic enzyme complex on the human erythrocyte membrane. Proc. Natl. Acad. Sci. 102, 2402–2407. 10.1073/pnas.0409741102 - DOI - PMC - PubMed
    1. Chen C., Peng T., 2020. Protocol for Site-Specific Photo-Crosslinking Proteomics to Identify Protein-Protein Interactions in Mammalian Cells. STAR Protoc. 1, 100109. 10.1016/j.xpro.2020.100109 - DOI - PMC - PubMed
    1. Chin J.W., Cropp T.A., Anderson J.C., Mukherji M., Zhang Z., Schultz P.G., 2003. An Expanded Eukaryotic Genetic Code. Science 301, 964–967. 10.1126/science.1084772 - DOI - PubMed

Publication types