

This is a preprint.
Testing Adaptive Therapy Protocols using Gemcitabine and Capecitabine on a Mouse Model of Endocrine-Resistant Breast Cancer
- PMID: 37781632
- PMCID: PMC10541126
- DOI: 10.1101/2023.09.18.558136
Testing Adaptive Therapy Protocols using Gemcitabine and Capecitabine on a Mouse Model of Endocrine-Resistant Breast Cancer
Update in
-
Testing Adaptive Therapy Protocols Using Gemcitabine and Capecitabine in a Preclinical Model of Endocrine-Resistant Breast Cancer.Cancers (Basel). 2024 Jan 6;16(2):257. doi: 10.3390/cancers16020257. Cancers (Basel). 2024. PMID: 38254748 Free PMC article.
Abstract
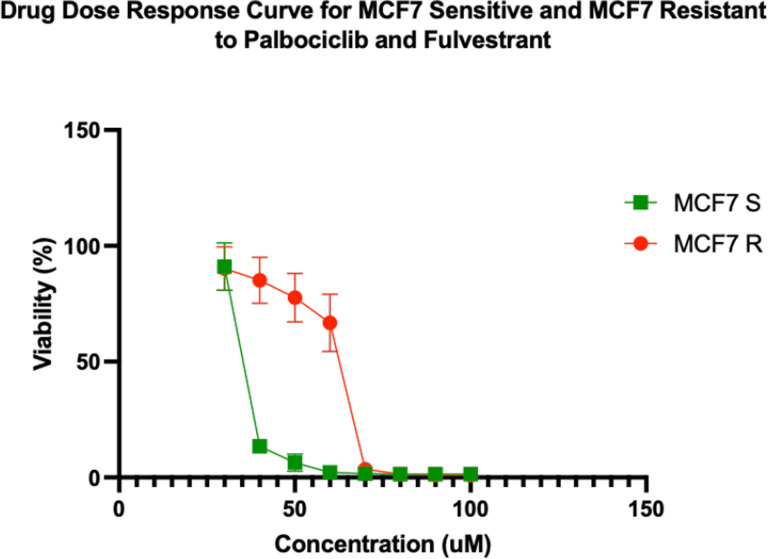
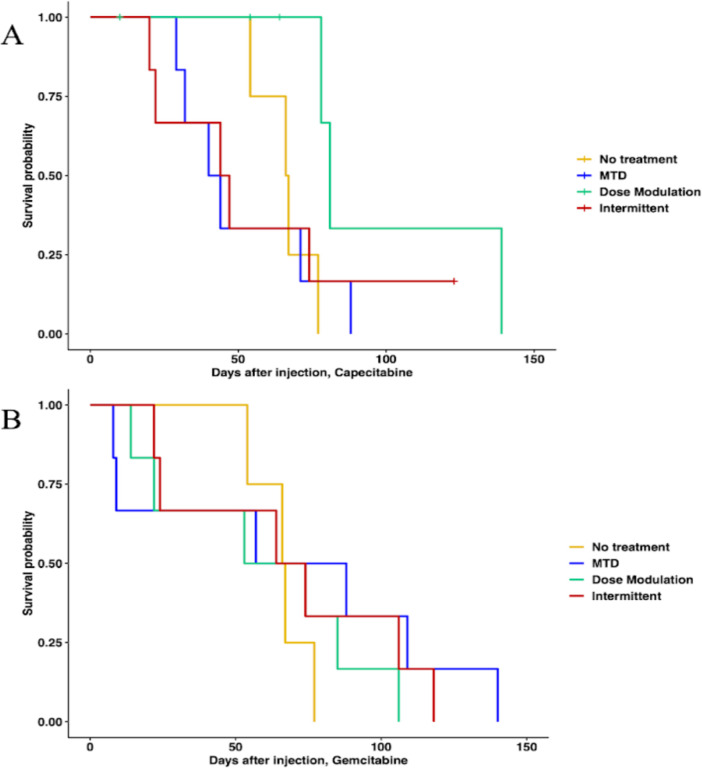
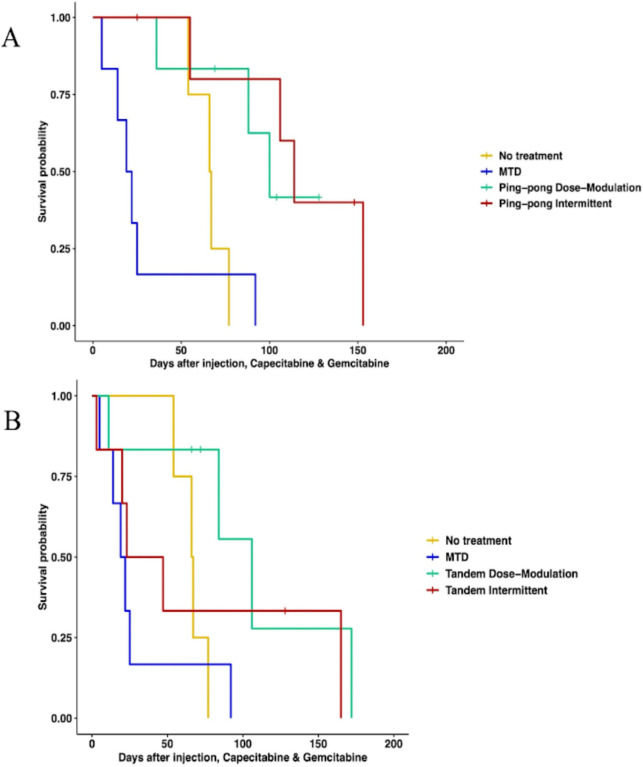
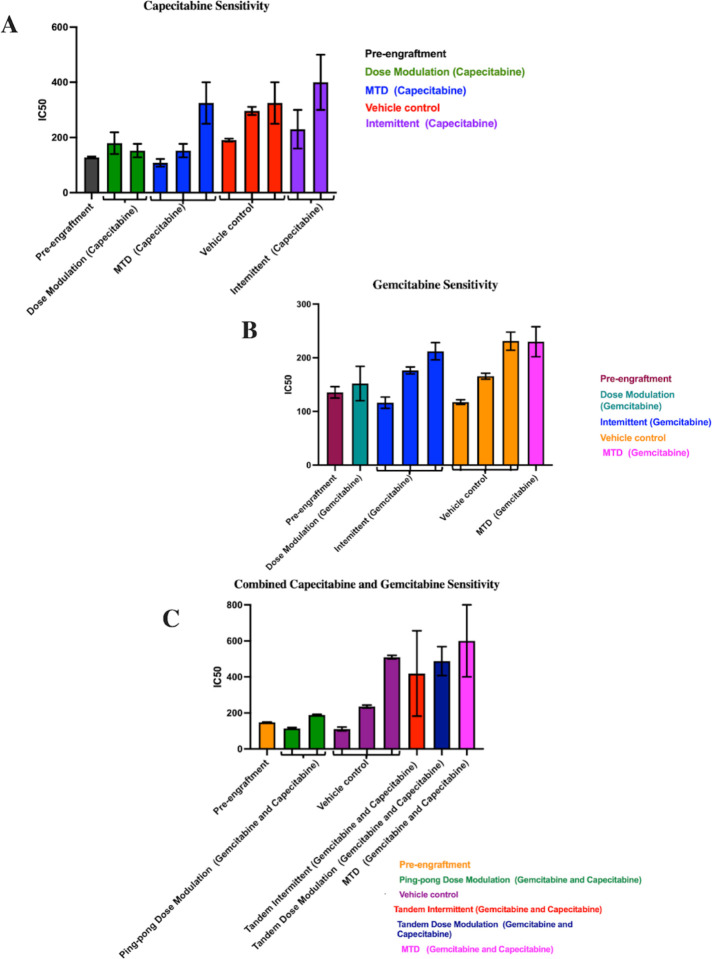
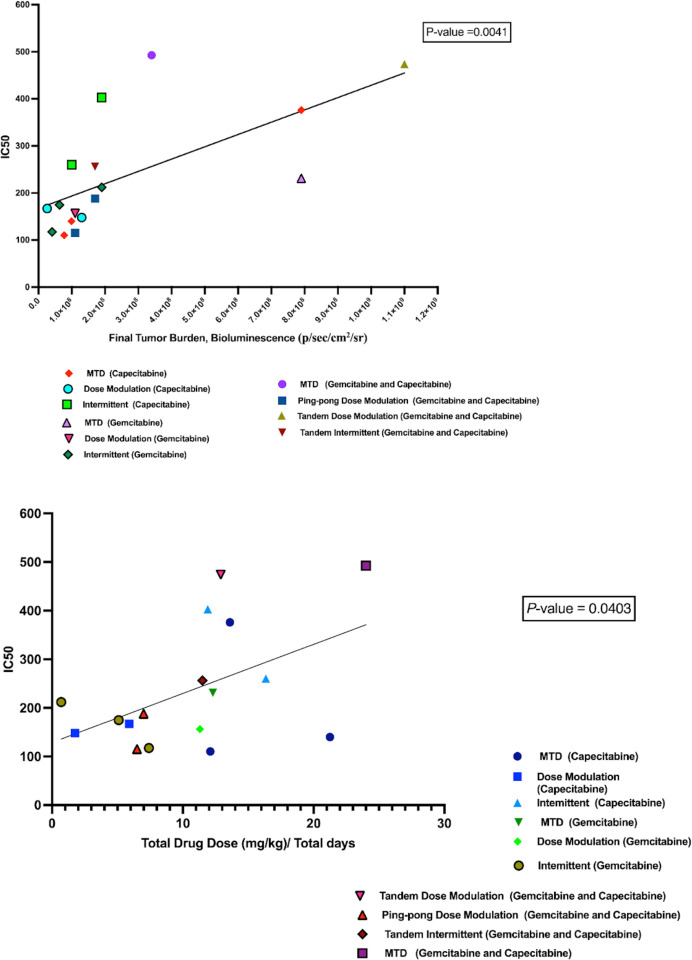
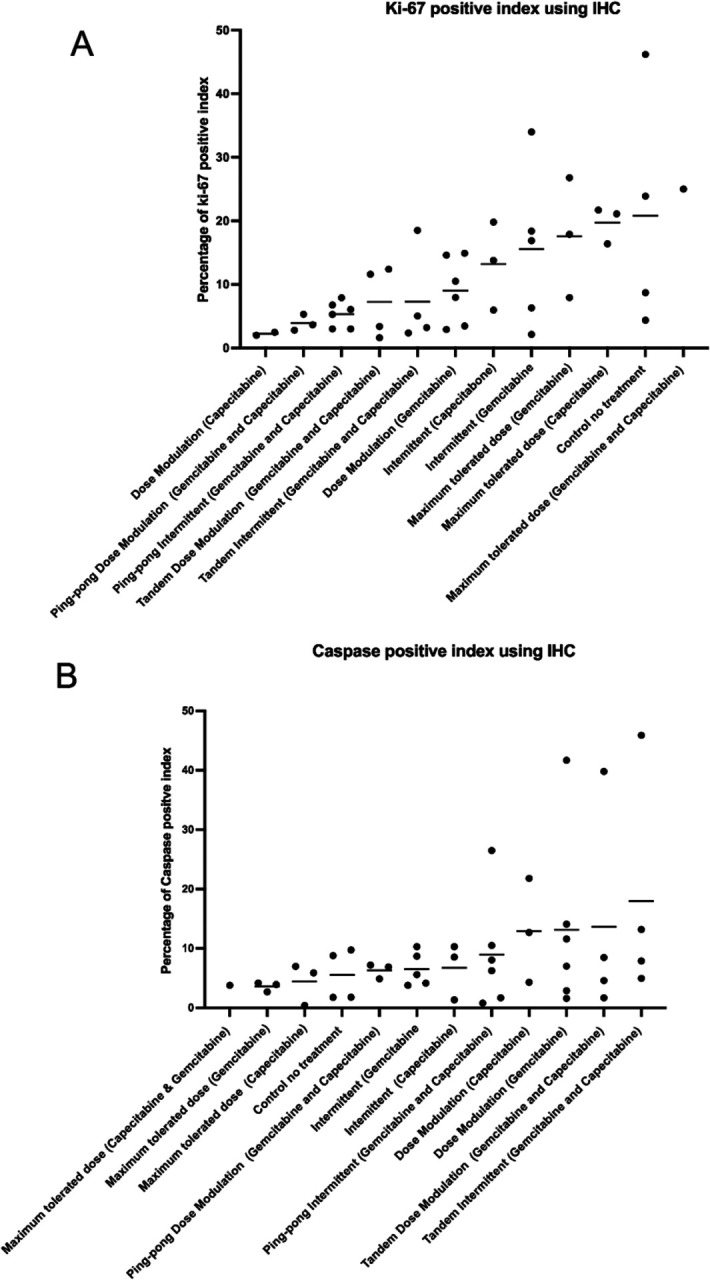
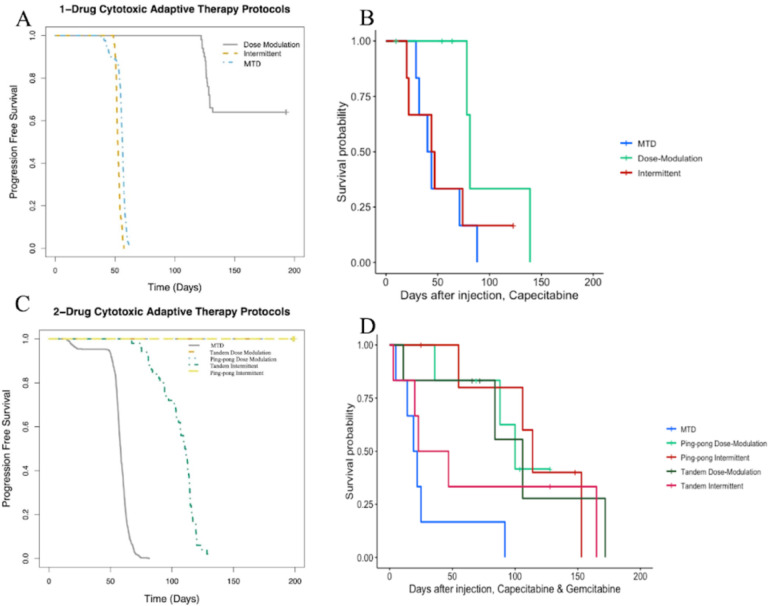
Highly effective cancer therapies often face limitations due to acquired resistance and toxicity. Adaptive therapy, an ecologically inspired approach, seeks to control therapeutic resistance and minimize toxicity by leveraging competitive interactions between drug-sensitive and drug-resistant subclones, prioritizing patient survival and quality of life over maximum cell kill. In preparation for a clinical trial in breast cancer, we used large populations of MCF7 cells to rapidly generate endocrine-resistance breast cancer cell line. We then mimicked second line therapy in ER+ breast cancers by treating the endocrine-resistant MCF7 cells in a mouse xenograft model to test adaptive therapy with capecitabine, gemcitabine, or the combination of those two drugs. Dose-modulation adaptive therapy with capecitabine alone increased survival time relative to MTD, but not statistically significant (HR: 0.22, 95% CI 0.043- 1.1 P = 0.065). However, when we alternated the drugs in both dose modulation (HR = 0.11, 95% CI: 0.024 - 0.55, P = 0.007) and intermittent adaptive therapies significantly increased survival time compared to high dose combination therapy (HR = 0.07, 95% CI: 0.013 - 0.42; P = 0.003). Overall, survival time increased with reduced dose for both single drugs (P < 0.01) and combined drugs (P < 0.001). Adaptive therapy protocols resulted in tumors with lower proportions of proliferating cells (P = 0.0026) and more apoptotic cells (P = 0.045). The results show that Adaptive therapy outperforms high-dose therapy in controlling endocrine-resistant breast cancer, favoring slower-growing tumors, and showing promise in two-drug alternating regimens.
Figures


Similar articles
-
Testing Adaptive Therapy Protocols Using Gemcitabine and Capecitabine in a Preclinical Model of Endocrine-Resistant Breast Cancer.Cancers (Basel). 2024 Jan 6;16(2):257. doi: 10.3390/cancers16020257. Cancers (Basel). 2024. PMID: 38254748 Free PMC article.
-
Capecitabine for hormone receptor-positive versus hormone receptor-negative breast cancer.Cochrane Database Syst Rev. 2021 May 26;5(5):CD011220. doi: 10.1002/14651858.CD011220.pub2. Cochrane Database Syst Rev. 2021. PMID: 34037241 Free PMC article.
-
Tamoxifen resistance alters sensitivity to 5-fluorouracil in a subset of estrogen receptor-positive breast cancer.PLoS One. 2021 Jun 8;16(6):e0252822. doi: 10.1371/journal.pone.0252822. eCollection 2021. PLoS One. 2021. PMID: 34101751 Free PMC article.
-
A phase I followed by a randomized phase II trial of two cycles carboplatin-olaparib followed by olaparib monotherapy versus capecitabine in BRCA1- or BRCA2-mutated HER2-negative advanced breast cancer as first line treatment (REVIVAL): study protocol for a randomized controlled trial.Trials. 2016 Jun 21;17(1):293. doi: 10.1186/s13063-016-1423-0. Trials. 2016. PMID: 27323902 Free PMC article. Clinical Trial.
-
Capecitabine: a review.Clin Ther. 2005 Jan;27(1):23-44. doi: 10.1016/j.clinthera.2005.01.005. Clin Ther. 2005. PMID: 15763604 Review.
References
-
- Barzman M, Bàrberi P, Birch ANE, Boonekamp P, Dachbrodt-Saaydeh S, Graf B, et al. Eight principles of integrated pest management. Agron Sustain Dev. 2015;35: 1199–1215.
Publication types
Grants and funding
LinkOut - more resources
Full Text Sources