. 2023 Oct 2;133(19):e169173.
doi: 10.1172/JCI169173.

Reduction of SPARC protects mice against NLRP3 inflammasome activation and obesity

Affiliations

Reduction of SPARC protects mice against NLRP3 inflammasome activation and obesity

Seungjin Ryu et al. J Clin Invest. .

Abstract

The comprehensive assessment of long-term effects of reducing intake of energy (CALERIE-II; NCT00427193) clinical trial established that caloric restriction (CR) in humans lowers inflammation. The identity and mechanism of endogenous CR-mimetics that can be deployed to control obesity-associated inflammation and diseases are not well understood. Our studies have found that 2 years of 14% sustained CR in humans inhibits the expression of the matricellular protein, secreted protein acidic and rich in cysteine (SPARC), in adipose tissue. In mice, adipose tissue remodeling caused by weight loss through CR and low-protein diet feeding decreased, while high-fat diet-induced (HFD-induced) obesity increased SPARC expression in adipose tissue. Inducible SPARC downregulation in adult mice mimicked CR's effects on lowering adiposity by regulating energy expenditure. Deletion of SPARC in adipocytes was sufficient to protect mice against HFD-induced adiposity, chronic inflammation, and metabolic dysfunction. Mechanistically, SPARC activates the NLRP3 inflammasome at the priming step and downregulation of SPARC lowers macrophage inflammation in adipose tissue, while excess SPARC activated macrophages via JNK signaling. Collectively, reduction of adipocyte-derived SPARC confers CR-like metabolic and antiinflammatory benefits in obesity by serving as an immunometabolic checkpoint of inflammation.

Keywords: Adipose tissue; Inflammation; Innate immunity; Metabolism; Obesity.


Conflict of interest statement

Conflict of interest: The authors have declared that no conflict of interest exists.

Figures

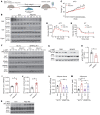
Figure 1
Figure 1. Inhibition of SPARC by CR is associated with improved metabolic outcomes in humans.
(A) Study design and adipose tissue sample collection from human CALERIE-II study for the transcriptomic analyses. (B and C) Information of study participants that underwent 14% sustained CR and weight loss and provided adipose tissues for RNA-Seq. (D) Baseline RPKM of significantly downregulated genes (Padj < 0.05, FC < –1.5) in RNA-Seq with human adipose tissue after 1 and 2 years of CR. (E) Heatmap of gene expression changes ranked by RPKM for top 30 genes that are significantly downregulated (Padj < 0.05, FC < –1.5) from baseline to year 1 or year 2. The colored circles indicate genes that are significantly downregulated in 1 year only (green), 2 years (blue), or both (red). (F) Regression analyses between percentage changes of SPARC, normalized expression, and percent changes in BMI, body fat percentage (upper), CRP, and ICAM1 (lower) of participants with 2 years of CR (n = 8). (G) q-PCR analysis of SPARC in human adipocytes, T cells, and monocytes (n = 6). (H) q-PCR analysis of SPARC mRNA from primary adipocytes isolated from SAT of overweight children before and after 8 weeks of CR (n = 6). Error bars represent the mean ± SEM. 2-tailed unpaired and paired t tests (C and H), 1-way ANOVA with Dunnett’s multiple comparisons test for adjusted P values (G), and Pearson correlation analysis (F) were performed for statistical analysis. *P < 0.05; ***P < 0.001; ****P < 0.0001.
Figure 2
Figure 2. Dietary restriction reduces adipose SPARC levels in mice.
(A and B) Schematic and the Sparc mRNA levels in subcutaneous adipose tissue (SAT) (n = 5, 4) and visceral adipose tissue (VAT) (n = 4, 5), and hypothalamus (n = 5, 5) in old mice (23 month) with or without life-long 40% CR. (CE) Schematic and q-PCR analysis of Sparc mRNA (C, D), and protein immunoblot analysis (E) of WT mice on normal diet (WT NP), WT mice fed low-protein diet (WT LP) and mice lacking FGF21 fed normal (Fgf21 KO NP) or low-protein diet (Fgf21 KO LP). Error bars represent the mean ± SEM. 2-tailed unpaired t tests (B) and 1-way ANOVA test with Bonferroni’s multiple comparisons test for adjusted P values (D) were performed for statistical analysis. *P < 0.05; **P < 0.01; ***P < 0.001; ****P < 0.0001.
Figure 3
Figure 3. HFD increases adipose SPARC.
(A and B) Schematic and Q-PCR analysis of Sparc mRNA in metabolic and immune tissues of mice fed chow (n = 3–6) and high-fat diet (HFD) (n = 3–6) for 8 weeks. (C) Immunoblot analysis of SPARC protein in SAT and VAT of mice fed chow and HFD for 8 weeks. (D and E) Schematic and q-PCR analysis of Sparc mRNA in mice fed HFD (60 Kcal% fat) and induced to undergo weight-loss by switching to control low calorie diet (14 Kcal% fat). Error bars represent the mean ± SEM. 2-tailed unpaired t tests (B) and 1-way ANOVA test with Tukey’s multiple comparisons test (E) were performed for statistical analysis. *P < 0.05.
Figure 4
Figure 4. SPARC controls adiposity.
(A) Schematic of experiments with inducible global Sparc KO mice. (B) Immunoblot analysis of SPARC protein in bone, VAT, and SAT in control Sparcfl/fl (Con), heterozygote (Sparcfl/+;CAG-CreER, Het iKO), and homozygote (Sparcfl/fl;CAG-CreER, Hom iKO) KO mice 6 weeks after tamoxifen injection. (C and D) Percentage of weight change of male (C) and female (D) littermate control (n = 10, 10), Het iKO (n = 10, 10), and Hom iKO (n = 5, 4) mice after tamoxifen injection. (E and F) Glucose tolerance test (GTT) (E), and insulin tolerance test (ITT) (F) of 14-month old (8 months after tamoxifen injection) male Con, Het iKO, and Hom iKO mice (n = 10, 10, 5). The blue star indicates statistical significance between Con and Het iKO mice, and the red star indicates statistical significance between Con and Hom iKO mice. Error bars represent the mean ± SEM. 2-way ANOVA test with Dunnett’s multiple comparisons test for adjusted P values (CF) were performed for statistical analysis. *P < 0.05; **P < 0.01; ***P < 0.001.
Figure 5
Figure 5. SPARC regulates EE in mice.
(AC) Metabolic cage analysis results of food intake (A), locomotive activity (B), and RER in 15-month old female Con, Het-iKO, and Hom-iKO mice (n = 6, 6, 4, respectively) (C). (D and E) Unnormalized EE by metabolic cage analysis of 15-month old female Con, Het-iKO, and Hom-iKO mice (n = 6, 6, 4, respectively). (F and G) Comparison of linear regression analyses about unnormalized energy expenditure (EE) and body mass between female Con and Het-iKO mice (n = 6, 6, respectively); ANCOVA (F) and between female Con and Hom-iKO mice (n = 6, 4, respectively) (G). Error bars represent the mean ± SEM. 2-tailed unpaired t tests were performed for statistical analysis (A, B, and E). *P < 0.05; **P < 0.01; ***P < 0.001.
Figure 6
Figure 6. Reduction of adipocyte-derived SPARC improves metabolic health.
(A) Schematic of experiments using Sparc floxed mouse (Con) and adipocyte specific Sparc KO mouse (Adip-KO). (B) Immunoblot analysis of SPARC protein in SAT, VAT, and hypothalamus (Hypo) in Con and Adip-KO mice. (C) Weight change in Con and Adip-KO female mice during 16 weeks of HFD (n = 12, 12, respectively). (D and E) GTT (D) and ITT (E) in Con and Adip-KO mice with 16 weeks of HFD (n = 7, 7, respectively). (F) Insulin (100 nM) response signaling at the indicated time in cultured primary adipocytes from Con and Adip-KO mice with or without SPARC (20 μg/mL) treatment for 24 hours. “N” indicates no treatment. (G and H) Immunoblot analysis and quantification of AKT phosphorylation (Ser 473) 5 minutes after insulin injection. The mice were pretreated with SPARC (100 μg) by i.p. injection 12 hours before the insulin injection and tissue collection. (I and J) Glycerol (I) and free fatty acid (FFA) (J) levels in ex vivo lipolysis assay with VAT from Con and Adip-KO mice after 24 hours of fasting (n = 4, 5, respectively). (K) Immunoblot analysis for lipolysis signaling in adipose tissue explants (SAT) from Con and Adip-KO mice after 24 hours of fasting (n = 4, 5, respectively). (L) Glycerol assay of SAT explants from Con and Adip-KO mice with or without ex vivo SPARC treatment (20 μg/mL) for 24 hours followed by stimulation with 10 μM norepinephrine (NE) (n = 4, 4, respectively). (M) Glycerol assay in differentiated adipocytes from adipose SVF of Con and Adip-KO mice with or without preincubation of SPARC (20 μg/mL) for 24 hours (n = 5, 4, respectively). The adipocytes were treated with NE (10 μM) for 4 hours to activate lipolysis and glycerol levels were measured in supernatants. Error bars represent the mean ± SEM. 2-tailed unpaired (C, H, I, and J), paired (L and M) t tests, and 2-way ANOVA test with Bonferroni’s multiple comparisons test for adjusted P values (D and E) were performed for statistical analysis. *P < 0.05; **P < 0.01.
Figure 7
Figure 7. Adipocyte-derived SPARC controls macrophage inflammation.
(A and B) Schematic and weight change of Con and Adip-KO mice with 21 weeks of HFD followed by 13 weeks of chow diet (n = 5, 5, respectively). (C) Body composition analysis of female Con and Adip-KO mice before and after diet change from HFD to chow diet (n = 4, 4, respectively). (D and E) q-PCR analysis of inflammatory gene (D) and components of inflammasome (E) in VAT macrophages (F4/80+) in obese mice switched to chow diet (n = 4, 4, respectively). (F) Inflammasome activation after pretreatment of SPARC protein for 24 hours following ATP (5mM) treatment with or without LPS (1 μg/mL) measured by caspase-1 Western blot analysis in cell lysate (lower) and supernatant (upper). Error bars represent the mean ± SEM. 2-tailed unpaired t tests were performed for statistical analysis. *P < 0.05; **P < 0.01; ***P < 0.001.
Figure 8
Figure 8. SPARC activates inflammation in macrophages via JNK signaling.
(A) Human SPARC or mock vector was overexpressed in RAW 264.7 cells by transient transfection (0.5 and 2.5 μg) and Western-blot analyses of SPARC, JNK and p38 MAPK are shown. The experiment was repeated in triplicate and performed twice. (B) q-PCR analysis of Il1b, Tnf, Nos2, and Il6 in RAW 264.7 cells with SPARC or mock vector overexpression. (C) Primary BMDMs were treated with SPARC (5–60 minutes) and JNK, p65 NF-κB, and p38 MPAK were quantified by immunoblot analysis. (D) Representative immunoblot of p-p65 NF-κB in BMDMs pretreated with STAT1, p38, and JNK inhibitor and in presence of SPARC (20 μg/mL). (E) q-PCR analysis of Il1b, Tnf, Nos2, and Il6 in BMDMs pretreated with p38 or JNK inhibitor followed by SPARC treatment (20 μg/mL). (F) Primary BMDMs were transfected with JNK and STAT1 siRNA and immunoblot analysis was performed to quantify Pro-IL-1β protein levels. The experiment was repeated in triplicate and performed twice. Error bars represent the mean ± SEM. 2-tailed unpaired t tests (B) and 1-way ANOVA test with Bonferroni’s multiple comparisons test for adjusted P values (E) were performed for statistical analysis. *P < 0.05; **P < 0.01; ***P < 0.001; ****P < 0.0001.

References

    1. Ingram DK, et al. Calorie restriction mimetics: an emerging research field. Aging Cell. 2006;5(2):97–108. doi: 10.1111/j.1474-9726.2006.00202.x. - DOI - PubMed
    1. Adler MI, et al. The lifespan-reproduction trade-off under dietary restriction is sex-specific and context-dependent. Exp Gerontol. 2013;48(6):539–548. doi: 10.1016/j.exger.2013.03.007. - DOI - PubMed
    1. Gardner EM, et al. Energy intake and response to infection with influenza. Annu Rev Nutr. 2011;31:353–367. doi: 10.1146/annurev-nutr-081810-160812. - DOI - PubMed
    1. Kirkwood TL, et al. Evolution, stress, and longevity. J Anat. 2000;197(Pt 4):587–590. doi: 10.1046/j.1469-7580.2000.19740587.x. - DOI - PMC - PubMed
    1. Roecker EB, et al. Reduced immune responses in rhesus monkeys subjected to dietary restriction. J Gerontol A Biol Sci Med Sci. 1996;51(4):B276–B279. doi: 10.1093/gerona/51A.4.B276. - DOI - PubMed

Publication types

Associated data