. 2023 Oct 2;133(19):e160517.
doi: 10.1172/JCI160517.

FTO fuels diabetes-induced vascular endothelial dysfunction associated with inflammation by erasing m6A methylation of TNIP1

Affiliations

FTO fuels diabetes-induced vascular endothelial dysfunction associated with inflammation by erasing m6A methylation of TNIP1

Chuandi Zhou et al. J Clin Invest. .

Abstract

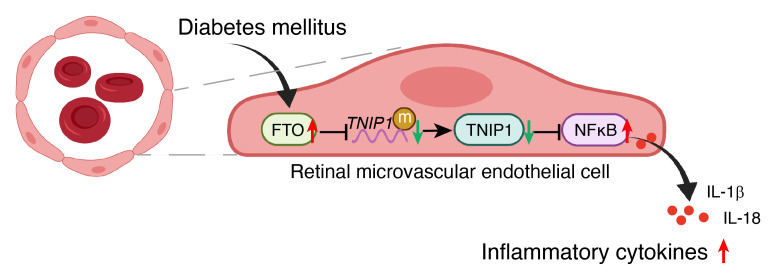
Endothelial dysfunction is a critical and initiating factor of the vascular complications of diabetes. Inflammation plays an important role in endothelial dysfunction regulated by epigenetic modifications. N6-methyladenosine (m6A) is one of the most prevalent epigenetic modifications in eukaryotic cells. In this research, we identified an m6A demethylase, fat mass and obesity-associated protein (FTO), as an essential epitranscriptomic regulator in diabetes-induced vascular endothelial dysfunction. We showed that enhanced FTO reduced the global level of m6A in hyperglycemia. FTO knockdown in endothelial cells (ECs) resulted in less inflammation and compromised ability of migration and tube formation. Compared with EC Ftofl/fl diabetic mice, EC-specific Fto-deficient (EC FtoΔ/Δ) diabetic mice displayed less retinal vascular leakage and acellular capillary formation. Furthermore, methylated RNA immunoprecipitation sequencing (MeRIP-Seq) combined with RNA-Seq indicated that Tnip1 served as a downstream target of FTO. Luciferase activity assays and RNA pull-down demonstrated that FTO repressed TNIP1 mRNA expression by erasing its m6A methylation. In addition, TNIP1 depletion activated NF-κB and other inflammatory factors, which aggravated retinal vascular leakage and acellular capillary formation, while sustained expression of Tnip1 by intravitreal injection of adeno-associated virus alleviated endothelial impairments. These findings suggest that the FTO-TNIP1-NF-κB network provides potential targets to treat diabetic vascular complications.

Keywords: Diabetes; Endothelial cells; Epigenetics; Inflammation; Vascular Biology.


Figures

Figure 1
Figure 1. Diabetes induces decreased m6A modification and increased FTO expression in human and mice.
(A) Dot blot showing reduced m6A content in the retinal fibrovascular membranes of patients with diabetic retinopathy (DR) (control group, n = 30; DR group, type 1 diabetes [left 2 columns], n = 10; type 2 diabetes [right 4 columns], n = 20; Student’s t test). MB, methylene blue staining. (B) A heatmap of RNA expression showing an overview of m6A-related genes in diabetic retinas. Fto was elevated stressed by diabetes (n = 3, Mann-Whitney U test). (C and D) qRT-PCR revealed higher levels of FTO in retinal fibrovascular membranes of patients with retinopathy due to type 1 (C, n = 10) or type 2 (D, n = 10) diabetes (Mann-Whitney U test). (E and F) Western blotting showing elevated expression of FTO in retinal fibrovascular membranes of patients with retinopathy due to type 1 (E, n = 6) or type 2 (F, n = 6) diabetes (Student’s t test). (G) Evans blue dye displayed that silencing Fto alleviated diabetes-induced retinal endothelium vascular leakage and enhanced Fto aggravated endothelium vascular leakage. A representative image with the quantification of the fluorescence signal is shown (n = 4, scale bar: 1 mm). (H) Retinal trypsin digestion assays indicate that silencing Fto presented with fewer acellular retinal capillaries after the induction of diabetes, and overexpressed Fto increased the number of acellular retinal capillaries. Red arrows indicate acellular capillaries. Acellular capillaries are quantified in 20 high-power fields and averaged (n = 4, scale bar: 50 μm). For G and H, significant differences were assessed by Kruskal-Wallis’s test followed by Bonferroni’s post hoc comparison test. Data are shown as the mean ± SD. *P < 0.05.
Figure 2
Figure 2. FTO causes retinal vascular endothelial dysfunction in diabetic mice.
(A) A schematic diagram showing the generation of endothelial cell–specific (EC-specific) Fto-deficient (EC FtoΔ/Δ) mice. (B) Immunofluorescence of FTO protein (red), cell nuclei (DAPI, blue), and retinal microvascular ECs (CD31, green) in EC Ftofl/fl and EC FtoΔ/Δ mice (scale bar: 5 μm). (C) PCR genotyping verified Fto exon 3 deletion in primary retinal microvascular ECs from EC FtoΔ/Δ mice. (D) Depletion of FTO protein in the primary retinal microvascular ECs from EC FtoΔ/Δ mice (n = 3). (E) Dot blot showing increased m6A content in EC FtoΔ/Δ mice (n = 6, Student’s t test). MB, methylene blue staining. (F) Endothelial knockout of Fto alleviated diabetes-induced retinal endothelium vascular leakage as shown in flat-mounted retinas stained with Evans blue dye. A representative image with the quantification of the fluorescence signal is shown (n = 4, scale bar: 1 mm). (G) EC FtoΔ/Δ mice presented with fewer acellular retinal capillaries after the induction of diabetes, as indicated by retinal trypsin digestion. Red arrows indicate acellular capillaries. Acellular capillaries were quantified in 20 high-power fields and averaged (n = 4, scale bar: 50 μm). (H) Transwell assays showing that FTO enhances the migration ability of human retinal microvascular ECs (HRMECs) cultivated in high glucose. The number of migrated cells was quantified (n = 4, scale bar: 200 μm). (I) FTO increased tube formation of HRMECs treated with high glucose. The average number of tube formation for each field was assessed (n = 4, scale bar: 200 μm). NG, normal glucose (5.5 mM) with D-mannitol as osmotic control; HG, high glucose (30 mM). For FI, significant differences were determined by 1-way ANOVA or Kruskal-Wallis’s test followed by Bonferroni’s post hoc comparison test. Data are shown as the mean ± SD. *P < 0.05.
Figure 3
Figure 3. Tnip1 is the target of m6A revealed by transcriptome-wide identification.
(A) Top enriched motifs of m6A peaks identified in diabetic and normal retinas. Samples from normal controls are numbered 1–3, as are samples from murine retinas with diabetic retinopathy. CDS, coding sequences. (B) Distribution of m6A sites plotted by mRNA transcripts. (C) Volcano plot showing m6A enrichment of genes in diabetic retinas. (D) Gene ontology (GO) analysis based on RNA-Seq for differentially expressed genes in diabetic retinas. The pathways in red are highly related to “Glucose metabolic process,” “Angiogenesis,” and “Epigenetic regulation.” (E) A plot indicating the m6A enrichment and mRNA expression of differentially expressed genes in diabetic retinas. Tnip1 is denoted for its remarkable demethylation and reduced level of mRNA. (F) Gene tracks based on RNA-Seq of Tnip1 using Integrative Genomics Viewer (IGV) in normal and diabetic murine retinas. rpm/bp, reads per million mapped reads per base pair. (G) Gene tracks based on MeRIP-Seq of Tnip1 using IGV in normal and diabetic murine retinas. DR, diabetic retinopathy.
Figure 4
Figure 4. The level of TNIP1 and its m6A modification are reduced in diabetic condition.
(AC) Reduced TNIP1 and enhanced FTO were detected by Western blotting in the retinal fibrovascular membranes of patients with retinopathy due to type 1 diabetes (A, n = 6), diabetic mouse retinas (B, n = 4), and human retinal microvascular endothelial cells (HRMECs) cultured in high glucose (C, n = 4) (Student’s t test). (DF) Reduced m6A modification of TNIP1 transcripts in the retinal fibrovascular membranes of patients with diabetic retinopathy (D, n = 3), diabetic mouse retinas (E, n = 3), and HRMECs treated with high glucose (F, n = 3), as assessed by m6A-RIP-qPCR assays. The value obtained for control group was set to 1 (Student’s t test). NG, normal glucose (5.5 mM) with D-mannitol as osmotic control; HG, high glucose (30 mM). *P < 0.05.
Figure 5
Figure 5. Tnip1 alleviates retinal vascular endothelial dysfunction in diabetic mice.
(A) Tnip1 alleviates diabetes-induced retinal endothelium vascular leakage, as observed by staining flat-mounted retinas with Evans blue dye. A representative image with the quantification of the fluorescence signal is shown (n = 4, scale bar: 1 mm). (B) Tnip1 attenuated acellular retinal capillary formation in diabetes, as indicated by retinal trypsin digestion. Red arrows indicate acellular capillaries. Acellular capillaries were quantified in 20 high-power fields and averaged (n = 4, scale bar: 50 μm). (C) Transwell assays showing that TNIP1 decreased the migration ability of HRMECs treated by high glucose. The number of migrated cells was quantified (n = 4, scale bar: 200 μm). (D) TNIP1 inhibited tube formation of HRMECs cultured in high glucose. The average number of tube formation for each field was assessed (n = 4, scale bar: 200 μm). NG, normal glucose (5.5 mM) with D-mannitol as osmotic control; HG, high glucose (30 mM). Significant differences were calculated by 1-way ANOVA or Kruskal-Wallis’s test followed by Bonferroni’s post hoc comparison test. Data are shown as the mean ± SD. *P < 0.05.
Figure 6
Figure 6. The FTO-TNIP1-NF-κB network regulates diabetes-induced retinal vascular endothelial dysfunction.
(A) Western blotting displaying higher TNIP1 expression and lower NF-κB expression in the retinas of endothelial cell–specific (EC-specific) Fto-deficient (EC FtoΔ/Δ) mice as compared with EC Ftofl/fl mice (n = 3). (B) Western blotting indicating that TNIP1 was inversely correlated with FTO expression, while the expression of NF-κB positively changed with FTO (n = 3). (C) Silencing Tnip1 by the intravitreal injection of adeno-associated virus (AAV) vectors containing siRNA-Tnip1 increased retinal vascular leakage in EC FtoΔ/Δ mice (n = 4, scale bar: 1 mm). (D) Silencing Tnip1 by the intravitreal injection of AAV vectors containing siRNA-Tnip1 increased the number of acellular capillaries in EC FtoΔ/Δ mice (n = 4, scale bar: 50 μm). (E) Immunofluorescence showing that downregulated FTO suppressed NF-κB, and this trend was reversed by silencing TNIP1 (n = 4, scale bar: 100 μm). Significant differences were assessed by 1-way ANOVA followed by Bonferroni’s post hoc comparison test. Data are shown as the mean ± SD. *P < 0.05.
Figure 7
Figure 7. FTO regulates Tnip1 expression by m6A modification.
(A) m6A-RIP-qPCR assays showed enhanced m6A modification in Tnip1 transcripts in endothelial cell (EC) FtoΔ/Δ mice as compared with EC) Ftofl/fl mice. The value obtained for the control group was set to 1 (n = 3, Mann-Whitney U test). (B) Elevated m6A modification in TNIP11 transcript after FTO knockdown, as assessed by gene-specific m6A-RIP-qPCR assays, in human retinal microvascular ECs (HRMECs). The value obtained for the control group was set to 1 (n = 3, Mann-Whitney U test). (C) qRT-PCR was conducted to detect TNIP1 mRNA after actinomycin D treatment (n = 3, repeated-measures ANOVA followed by Bonferroni’s test). (D) Schematic diagram depicting 8 mutants used in luciferase reporter assays, which are located in the TNIP1 3′ UTR of human and murine genomes. (E) Dual luciferase reporter assays showed the effect of overexpressed FTO on TNIP1 mRNA reporters with either wild-type or mutated m6A sites (n = 3, Mann-Whitney U test). (F) Left: A schematic model showing RNA probes used in RNA pull-down assays. Right: RNA pulldown of endogenous FTO proteins using synthetic TNIP1 RNA fragments with or without m6A modifications. FTO selectively recognized the dynamic m6A modification to regulate the lifetime of TNIP1 mRNA with the positive reference of YTHDF1.
Figure 8
Figure 8. Schematic diagram illustrating the mechanisms underlying the regulation of the FTO-TNIP1-NF-κB network in diabetes-induced retinal vascular endothelial dysfunction associated with inflammation.
In diabetes, excessive FTO expression leads to m6A demethylation of TNIP1 mRNA. TNIP1 depletion activates the NF-κB pathway and subsequently elevates the inflammatory cytokines, such as IL-1β and IL-18, finally leading to vascular endothelial dysfunction.

References

    1. Cho NH, et al. IDF diabetes atlas: global estimates of diabetes prevalence for 2017 and projections for 2045. Diabetes Res Clin Pract. 2018;138:271–281. doi: 10.1016/j.diabres.2018.02.023. - DOI - PubMed
    1. Birkeland KI, et al. Cardiovascular mortality and morbidity in patients with type 2 diabetes following initiation of sodium-glucose co-transporter-2 inhibitors versus other glucose-lowering drugs (CVD-REAL Nordic): a multinational observational analysis. Lancet Diabetes Endocrinol. 2017;5(9):709–717. doi: 10.1016/S2213-8587(17)30258-9. - DOI - PubMed
    1. Luscher TF, et al. Diabetes and vascular disease: pathophysiology, clinical consequences, and medical therapy: part II. Circulation. 2003;108(13):1655–1661. doi: 10.1161/01.CIR.0000089189.70578.E2. - DOI - PubMed
    1. Creager MA, et al. Diabetes and vascular disease: pathophysiology, clinical consequences, and medical therapy: part I. Eur Heart J. 2003;108(12):1527–2443. - PubMed
    1. Stehouwer CD, et al. Endothelial dysfunction and pathogenesis of diabetic angiopathy. Cardiovasc Res. 1997;34(1):55–68. doi: 10.1016/S0008-6363(96)00272-6. - DOI - PubMed

Publication types

MeSH terms