Hypoxia activates SREBP2 through Golgi disassembly in bone marrow-derived monocytes for enhanced tumor growth
- PMID: 37781951
- PMCID: PMC10646561
- DOI: 10.15252/embj.2023114032
Hypoxia activates SREBP2 through Golgi disassembly in bone marrow-derived monocytes for enhanced tumor growth
Abstract
Bone marrow-derived cells (BMDCs) infiltrate hypoxic tumors at a pre-angiogenic state and differentiate into mature macrophages, thereby inducing pro-tumorigenic immunity. A critical factor regulating this differentiation is activation of SREBP2-a well-known transcription factor participating in tumorigenesis progression-through unknown cellular mechanisms. Here, we show that hypoxia-induced Golgi disassembly and Golgi-ER fusion in monocytic myeloid cells result in nuclear translocation and activation of SREBP2 in a SCAP-independent manner. Notably, hypoxia-induced SREBP2 activation was only observed in an immature lineage of bone marrow-derived cells. Single-cell RNA-seq analysis revealed that SREBP2-mediated cholesterol biosynthesis was upregulated in HSCs and monocytes but not in macrophages in the hypoxic bone marrow niche. Moreover, inhibition of cholesterol biosynthesis impaired tumor growth through suppression of pro-tumorigenic immunity and angiogenesis. Thus, our findings indicate that Golgi-ER fusion regulates SREBP2-mediated metabolic alteration in lineage-specific BMDCs under hypoxia for tumor progression.
Keywords: Golgi-ER fusion; SREBP2; cholesterol biosynthesis; hypoxia; myeloid differentiation.
© 2023 The Authors. Published under the terms of the CC BY NC ND 4.0 license.
Conflict of interest statement
The authors declare that they have no conflict of interest.
Figures
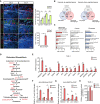
- A
Left, immunostaining of pre‐/post‐angiogenic allograft tumor of HSML cells. Endothelial cells indicated by CD31, myeloid cells by CD11b, macrophages by F4/80, and granulocytes by Gr‐1. Nucleus indicated by DAPI. Scale bars, 100 μm. Right, quantification of cell number or CD31+ area. Data represent mean ± SEM of n = 3 biological replicates.
- B
Venn diagram of hypoxia‐regulated genes in monocyte/macrophage lineage, cancer and fibroblast cells, up‐ or downregulated over twofold as measured by DNA microarray.
- C
Pathway analysis of twofold upregulated genes under hypoxic conditions measured by DNA microarray.
- D
Schematics of cholesterol biosynthesis pathway. Enzymes upregulated in hypoxic THP‐1 cells shown in red.
- E
mRNA expression level of cholesterol biosynthetic enzymes in THP‐1 cells. Data represent mean ± SEM of n = 3 biological replicates.
- F, G
Relative percentage inputs of histone, (F) methylation (H3K4me3), and (G) acetylation (H3K27Ac), on promoter and enhancer regions of HMGCS1, IDI1, MSMO1, and LSS in THP‐1 cells. Data represent mean ± SEM of n = 3 biological replicates.
- H
Total cellular cholesterol content in THP‐1 cells. Data represent mean ± SEM of n = 3 biological replicates.

Heatmap representation of differentially expressed genes in monocyte/macrophage lineage cells, cancer cells, and fibroblast cells under hypoxic conditions. Gene expression was measured by DNA microarray. Fold change of gene expression is indicated by color bar. Representative genes from the commonly and differentially regulated sections were listed.
mRNA expression levels of PDK1, LDHA, and VEGF in response to 24 h of control or hypoxic condition in monocyte/macrophage lineage (THP‐1), cancer (HeLa), and fibroblast (NHDF) cells. Data represent mean ± SEM of n = 3 biological replicates.
Relative cell growth of THP‐1, HeLa, and NHDF during 72 h of culture under control or hypoxic condition. Cell growth is assessed every 24 h by sulforhodamine (SRB) assay. Data represent mean ± SEM of n = 3 biological replicates.
Cell cycle analysis of THP‐1, HeLa, and NHDF under 24 h of control or hypoxic condition.
Pathway analysis of twofold downregulated genes in monocyte/macrophage lineage, cancer, and fibroblast cells under hypoxic conditions as measured by DNA microarray.
mRNA expression levels of HMGCS1 and LSS in response to 24 h of control or hypoxic condition in HeLa and NHDF cells. Data represent mean ± SEM of n = 3 biological replicates.
mRNA expression levels of HMGCS1, MSMO1, and LSS in response to 24 h of control or hypoxic condition in human acute lymphoblastoid cell line (BALL‐1). Data represent mean ± SEM of n = 3 biological replicates.
Relative % input of histone methylation (H3K4me3) on promoter regions of HMGCS1, MSMO1 and LSS measured by ChIP‐seq in human acute lymphoblastoid cell line (BALL‐1) with 24 h of exposure to hypoxic conditions. Data represent mean ± SEM of n = 3 biological replicates.
Relative % input of histone acetylation (H3K27Ac) on enhancer regions of HMGCS1, MSMO1, and LSS measured by ChIP‐seq in human acute lymphoblastoid cell line (BALL‐1) with 24 h of exposure to hypoxic conditions. Data represent mean ± SEM of n = 3 biological replicates.
Validation of HIF1α‐siRNA‐mediated effect in THP‐1 cells under control and hypoxic conditions. Data represent mean ± SEM of n = 3 biological replicates.
Effect of HIF1α‐siRNA on hypoxia‐induced expression of HIF1α target genes (PDK1, LDHA) and cholesterol biosynthetic genes (HMGCS1, HMGCR, IDI1, and LSS) in response to 24 h of control or hypoxic condition in THP‐1 cells. Data represent mean ± SEM of n = 3 biological replicates.

- A
Validation of SREBP2 and SREBP1 siRNA‐mediated effect in THP‐1 cells. siRNA knockdown was performed in THP‐1 cells under both normoxia and hypoxia. Data represent mean ± SEM of n = 3 biological replicates.
- B
Effect of siRNA‐SREBP2 on hypoxia‐induced expression of HMGCR, HMGCS1, and LSS mRNA in THP‐1 cells. siRNA knockdown was performed in THP‐1 cells under both normoxia and hypoxia. Data represent mean ± SEM of n = 3 biological replicates.
- C
Venn diagram of genes up‐ or downregulated over twofold and pathway analysis on genes upregulated under hypoxia and downregulated after SREBP2 silencing in THP‐1 cells.
- D, E
Active form (N) and inactive precursor form (P) of SREBP2 in nuclear extract (Nuc. Ext.) and membrane (Membrane) fractions of THP‐1 cells under (D) control (C), hypoxic (H) conditions, and (E) cholesterol‐deprived (Induced: Ind.) and cholesterol‐rich (Suppressed: Supp.) conditions.
- F
Hypoxia‐induced binding of SREBP2 on the promoter regions of HMGCS1, IDI1, LSS, and MSMO1 in THP‐1 cells. Data represent mean ± SEM of n = 3 biological replicates.
- G
Effect of cholesterol (10 μg/ml)/25OH‐cholesterol (1 μg/ml) treatment and hypoxia on SREBP2 target genes HMGCR and HMGCS1 in THP‐1 cells. Data represent mean ± SEM of n = 3 biological replicates.
- H
Immunofluorescent staining of TGN46—a Golgi marker (green), KDEL—an ER marker (red), and DAPI (blue) for nucleus in THP‐1 cells under control and hypoxic conditions. All scale bars, 5 μm. Quantification data represent mean ± SEM of n = 24 biological replicates.
- I
Proximity ligation assay (PLA) staining of TGN46 (Golgi), KDEL (ER), and DAPI (nucleus) in THP‐1 cells under control and hypoxic conditions. All scale bars, 20 μm. Quantification data represent mean ± SEM of n = 30 biological replicates.
- J
Immunofluorescent staining of TGN46 (Golgi), SREBP2, and DAPI (nucleus) in THP‐1 cells under control and hypoxic conditions. All scale bars, 5 μm. Quantification data represent mean ± SEM of n = 32 biological replicates.
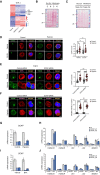
Heatmap representation of differentially expressed genes in monocyte/macrophage cells (THP‐1) when they undergo 24 h of hypoxia or knockdown of SREBP2 using two different siRNAs. Fold change of gene expression is indicated by color bar. Representative genes from differentially regulated section were listed.
Total protein staining (Ponceau S) confirming equal loading in the Western blot analysis of SREBP2 expression in THP‐1 cells, related to Fig 2D.
Total protein staining (Ponceau S) confirming equal loading in the Western blot analysis of SREBP2 expression in THP‐1 cells, related to Fig 2E.
Immunofluorescent staining of TGN46 (green), KDEL (red), and nucleus by DAPI (blue) in THP‐1 treated with vehicle or 1 μg/ml 25‐hydroxycholesterol (25‐OH) under control and hypoxic condition. TGN46+ area/cell indicating the extent of Golgi disassembly is quantified. All scale bars, 5 μm. Quantification data represent mean ± SEM of n = 24 biological replicates.
Immunofluorescent staining of TGN46 (green), KDEL (red), and nucleus by DAPI (blue) in THP‐1 treated with SCAP‐siRNA under control and hypoxic condition. TGN46+ area/cell indicating the extent of Golgi disassembly is quantified. All scale bars, 5 μm. Quantification data represent mean ± SEM of n = 24 biological replicates.
Immunofluorescent staining of TGN46 (green), SREBP2 (red), and nucleus by DAPI (blue) in THP‐1 treated with SCAP‐siRNA under control and hypoxic condition. SREBP2 intensity in nucleus is quantified. All scale bars, 5 μm. Quantification data represent mean ± SEM of n = 28 biological replicates.
Validation of SCAP‐siRNA‐mediated effect in THP‐1 cells under control or hypoxic conditions. Data represent mean ± SEM of n = 3 biological replicates.
Effect of SCAP‐siRNA on cholesterol biosynthetic genes (HMGCS1, HMGCR, IDI1, LSS, and MSMO1) in response to 24 h of control or hypoxic condition in THP‐1 cells. Data represent mean ± SEM of n = 3 biological replicates.
Validation of SCAP‐siRNA‐mediated effect in THP‐1 cells under vehicle (0.2% methanol) or 2 μg/ml Brefeldin A (BFA) treatment. Data represent mean ± SEM of n = 3 biological replicates.
Effect of SCAP‐siRNA on cholesterol biosynthetic gene (HMGCS1, HMGCR, IDI1, LSS, and MSMO1) in THP‐1 cells under vehicle (0.2% methanol) or 2 μg/ml BFA treatment. Data represent mean ± SEM of n = 3 biological replicates.
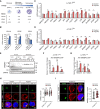
- A
Schematics of the cellular model used to study monocyte/macrophage differentiation.
- B
mRNA expression of monocyte/macrophage markers in THP‐1, A‐THP‐1early, and A‐THP‐1late cells. Data represent mean ± SEM of n = 3 biological replicates.
- C, D
mRNA expression of cholesterol biosynthetic enzymes in (C) A‐THP‐1early and (D) A‐THP‐1late cells. Data represent mean ± SEM of n = 3 biological replicates.
- E
Active form (N) and inactive precursor form (P) of SREBP2 in nuclear extract (Nuc. Ext.) and membrane (Membrane) fractions of THP‐1, A‐THP‐1early, and A‐THP‐1late cells under control, hypoxic conditions.
- F, G
Hypoxia‐induced binding of SREBP2 on the promoter regions of HMGCS1, IDI1, and MSMO1 in A‐THP‐1early and A‐THP‐1late cells. Data represent mean ± SEM of n = 3 biological replicates.
- H, I
Immunofluorescent staining of TGN46 (green), DAPI (blue) for nucleus, and (H) KDEL (red) or (I) SREBP2 (red) in A‐THP‐1early and A‐THP‐1late cells under hypoxic conditions. All scale bars, 5 μm. Quantification data represent mean ± SEM of n = 24 (I) and 32 (H) biological replicates.

Immunofluorescent staining of TGN46 (green), KDEL (red), and nucleus by DAPI (blue) in THP‐1 treated with vehicle (0.1% DMSO) or 40 μg/ml Mepanipyrim under control or hypoxic conditions. All scale bars, 5 μm. TGN46+ area/cell, indicating the extent of Golgi disassembly is quantified. Quantification data represent mean ± SEM of n = 24 biological replicates.
Immunofluorescent staining of TGN46 (green), SREBP2 (red), and nucleus by DAPI (blue) in THP‐1 treated with vehicle or 40 μg/ml Mepanipyrim under control or hypoxic conditions. All scale bars, 5 μm. SREBP2 intensity in nucleus is quantified. Quantification data represent mean ± SEM of n = 32 biological replicates.
mRNA expression level of cholesterol biosynthetic genes (HMGCS1, IDI1, LSS, and MSMO1) in THP‐1 cells treated with vehicle or 40 μg/ml Mepanipyrim under control or hypoxic conditions. Data represent mean ± SEM of n = 3 biological replicates.
Immunofluorescent staining of TGN46 (green), KDEL (red), and nucleus by DAPI (blue) in THP‐1 treated with vehicle or 10 μM Nocodazole. All scale bars, 5 μm. Quantification data represent mean ± SEM of n = 24 biological replicates.
mRNA expression level of cholesterol biosynthetic genes (HMGCS1, IDI1, LSS, and MSMO1) in THP‐1 cells treated with vehicle or 10 μM Nocodazole. Data represent mean ± SEM of n = 3 biological replicates.
Immunofluorescent staining of TGN46 (green), KDEL (red), and nucleus by DAPI (blue) in THP‐1 treated with vehicle or 2 μg/ml Brefeldin A (BFA). All scale bars, 5 μm. Quantification data represent mean ± SEM of n = 24 biological replicates.
Immunofluorescent staining of TGN46 (green), SREBP2 (red), and nucleus by DAPI (blue) in THP‐1 treated with vehicle or 2 μg/ml BFA. All scale bars, 5 μm. Quantification data represent mean ± SEM of n = 24 biological replicates.
mRNA expression level of cholesterol biosynthetic genes (HMGCS1, IDI1, LSS, and MSMO1) in THP‐1 cells treated with vehicle or 2 μg/ml BFA. Data represent mean ± SEM of n = 3 biological replicates.
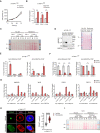
Relative cell growth of A‐THP‐1late cells during 72 h of culture under control or hypoxic condition. Cell growth is assessed every 24 h by sulforhodamine (SRB) assay. Data represent mean ± SEM of n = 3 biological replicates.
mRNA expression levels of VEGF, PDK1, and LDHA in response to 24 h of control or hypoxic condition in A‐THP‐1late cells. Data represent mean ± SEM of n = 3 biological replicates.
Total protein staining (Ponceau S) confirming equal loading in the Western blot analyses of SREBP2 expression in THP‐1, A‐THP‐1early and A‐THP‐1late cells, related to Fig 3E.
(Left) Active form (N) and inactive precursor form (P) of SREBP2 in nuclear extract (Nuc. Ext.) and membrane (Membrane) fractions of A‐THP‐1late cells under cholesterol‐deprived (Induced: Ind.) and cholesterol‐rich (Suppressed: Supp.) conditions. (Right) Total protein staining (Ponceau S) confirming equal loading.
Relative % input of histone methylation (H3K4me3) and acetylation (H3K27Ac) on promoter regions and enhancer regions, respectively, of HMGCS1, IDI1, and MSMO1 in A‐THP‐1early cells with 24 h of exposure to hypoxia. Data represent mean ± SEM of n = 3 biological replicates.
Relative % input of histone methylation (H3K4me3) and acetylation (H3K27Ac) on promoter regions and enhancer regions, respectively, of HMGCS1, IDI1, and MSMO1 in A‐THP‐1late cells with 24 h of exposure to hypoxia. Data represent mean ± SEM of n = 3 biological replicates.
Relative % input of histone methylation (H3K4me3) and acetylation (H3K27Ac) on promoter regions and enhancer regions, respectively, of HMGCR, MVD, FDPS, and FDFT1 in THP‐1, A‐THP‐1early, or A‐THP‐1late cells with 24 h of exposure to hypoxia. Data represent mean ± SEM of n = 3 biological replicates.
Immunofluorescent staining of TGN46 (green), KDEL (red), and nucleus by DAPI (blue) in A‐THP‐1late cells treated with 10 μM Nocodazole. TGN46+ area/cell indicating the extent of Golgi disassembly is quantified. All scale bars, 5 μm. Quantification data represent mean ± SEM of n = 24 biological replicates.
Total protein staining (Ponceau S) confirming equal loading in the Western blot analyses of SREBP2 expression in PMA‐stimulated macrophages, related to Fig 4D, respectively.

Schematics of THP‐1 differentiation upon PMA and resting treatments.
mRNA expression of monocyte/macrophage markers in THP‐1 cells with/without PMA and resting treatments. Data represent mean ± SEM of n = 3 biological replicates.
mRNA expression of cholesterol biosynthetic enzymes in THP‐1 cells with/without PMA and resting treatments under control/hypoxic conditions. Data represent mean ± SEM of n = 3 biological replicates.
Active form (N) and inactive precursor form (P) of SREBP2 in nuclear extract (Nuc. Ext.) and membrane (Membrane) fractions of PMA‐stimulated macrophages under control/hypoxic conditions.
Hypoxia‐induced binding of SREBP2 on the promoter regions of HMGCS1, IDI1, LSS and MSMO1 in PMA‐stimulated macrophages. Data represent mean ± SEM of n = 3 biological replicates.
Immunofluorescent staining of TGN46—a Golgi marker (green), KDEL—an ER marker (red), and DAPI (blue) for nucleus in PMA‐stimulated macrophages under control/hypoxic conditions. All scale bars, 10 μm. Quantification data represent mean ± SEM of n = 24 biological replicates.
Proximity ligation assay (PLA) staining of TGN46 (Golgi), KDEL (ER), and DAPI (nucleus) in PMA‐stimulated macrophages under control/hypoxic conditions. All scale bars, 20 μm. Quantification data represent mean ± SEM of n = 30 biological replicates.
Immunofluorescent staining of TGN46 (Golgi), SREBP2, and DAPI (nucleus) in PMA‐stimulated macrophages under control/hypoxic conditions. All scale bars, 10 μm. Quantification data represent mean ± SEM of n = 32 biological replicates.
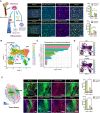
Immunohistochemical staining of SREBP2, HMGCS1, and hypoxic regions in murine bone marrow. SREBP2+/HMGCS1+ cells (red); hypoxia probe (green); Topro3 for nucleus (blue). Scale bars, 100 μm. Quantification data represent mean ± SEM of n = 5 biological replicates.
Uniform Manifold Approximation and Projection (UMAP) of human adult bone marrow cells, classified by single‐cell RNA‐sequencing analysis.
Pathway analysis of cholesterol biosynthetic genes in each of human bone marrow cell subcluster.
Expression profile of macrophage marker (CD35) and monocyte marker (CD32) on human bone marrow cells.
Immunohistochemical staining of SREBP2, HMGCS1, and hypoxic regions in tumors formed by subcutaneous injection of HSML cells. SREBP2+/HMGCS1+ cells (red); hypoxia probe (green); DAPI for nucleus (blue). Scale bars, 100 μm. Quantification data represent mean ± SEM of n = 5 biological replicates.
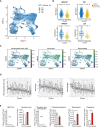
Uniform Manifold Approximation and Projection (UMAP) of human adult bone marrow cells with corresponding expression levels of hypoxic signature genes.
Single‐cell expression level of cholesterol biosynthetic genes (HMGCS1, HMGCR, IDI1, LSS) in human adult bone marrow cells, compared between cholesterol biosynthesis high clusters (7, 0, 17, 4, 12) and low clusters (15, 19, 14, 5, 16), related to Fig 5C.
UMAP of human bone marrow cells and their single‐cell expression profile of signature genes for hematopoietic stem cells, monocytes, and macrophages.
Signature scores of hematopoietic stem cells, monocytes, and macrophages for each subcluster of human bone marrow cells. Data represent mean ± SEM of at least three independent data sets.
Cellular content of cholesterol biosynthesis pathway metabolites in mouse bone marrow‐derived monocyte/macrophage cells treated under control or hypoxic conditions for 24 h. Data represent mean ± SEM of n = 3 biological replicates.
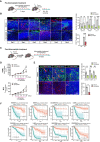
Schematics of subcutaneous tumor model with atorvastatin pre‐treatment.
Immunostaining of HSML allograft tumor at pre‐angiogenic (Day 2) and post‐angiogenic state (Day 4) with pre‐treatment of atorvastatin. Endothelial cells indicated by CD31, myeloid cells by CD11b, macrophages by F4/80, granulocytes by Gr‐1, and nucleus by DAPI, respectively. Scale bars, 100 μm. Quantification data represent mean ± SEM of n = 3 biological replicates.
Schematics of subcutaneous tumor model with atorvastatin post‐treatment.
Tumor growth of HSML and B16 tumor allografts with continuous atorvastatin administration. Data represent mean ± SEM of n = 5 biological replicates.
Immunostaining of HSML allograft tumor with post‐treatment of atorvastatin. Endothelial cells indicated by CD31, myeloid cells by CD11b, macrophage cells by F4/80, granulocytes by Gr‐1, and nucleus by DAPI, respectively. Scale bars, 50 μm. Quantification data represent mean ± SEM of n = 3 biological replicates.
Kaplan–Meier analysis of hypoxia‐related genes in multiple cancer types. Overall survival rates of patients with breast, brain, colorectal, liver, ovarian, lung, sarcoma, and pancreatic cancer.
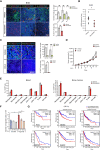
Immunostaining of B16 allograft tumor with post‐treatment of atorvastatin. Endothelial cells are indicated by CD31, myeloid cells by CD11b, macrophage cells by F4/80, granulocytes by Gr‐1, and nucleus by DAPI, respectively. Scale bars, 50 μm. Quantification data represent mean ± SEM of n = 3 biological replicates.
Effect of atorvastatin on Ccl2 expression in B16 tumor allografts. Data represent mean ± SEM of n = 7 biological replicates.
Immunostaining of B16 allograft tumor with treatment of CCL2 inhibitor (bindarit) at 10 mg/kg every 5 days. Endothelial cells indicated by CD31 (red), myeloid cells by CD11b (green), macrophage cells by F4/80 (green), and nucleus by DAPI, respectively. Scale bars, 100 μm. Quantification data represent mean ± SEM of n = 3 biological replicates.
Tumor growth of B16 tumor allografts with continuous CCL2 inhibitor administration. Data represent mean ± SEM of n = 5 biological replicates.
Composition of immune cells (% in CD45+ cells) in mouse blood and bone marrow after treatment of vehicle or atorvastatin (10 mg/kg/day) for 7 days. The population of immune cells was distinguished by flow cytometry analysis: Neutrophils (CD45+Ly‐6C+Ly‐6G+); monocyte (CD45+Ly‐6CHighLy‐6G−); dendritic cells (CD45+CD11c+); macrophages (CD45+F4/80+CD11b+); CD4+ T cells (CD45+CD4+); CD8+ T cells (CD45+CD8+); B cells (CD45+B220+); NK cells (CD45+NK1.1+). Data represent mean ± SEM of n = 3 biological replicates.
Trans‐well migration assay of THP‐1 under control or hypoxic condition with silencing of SREBP2. Data represent mean ± SEM of n = 3 biological replicates.
Survival rate of six types of cancer patients with low or high expression of nine cholesterol biosynthesis signature genes (HMGCS1, HMGCR, MVD, IDI1, FDPS, FDFT1, SQLE, LSS, MSMO1), normalized by the expression of monocyte marker gene CD11b.
References
-
- Adams CM, Reitz J, De Brabander JK, Feramisco JD, Li L, Brown MS, Goldstein JL (2004) Cholesterol and 25‐hydroxycholesterol inhibit activation of SREBPs by different mechanisms, both involving SCAP and Insigs. J Biol Chem 279: 52772–52780 - PubMed
-
- Benjamini Y, Hochberg Y (1995) Controlling the false discovery rate: a practical and powerful approach to multiple testing. J R Stat Soc B: Stat Methodol 57: 289–300
-
- Brown MS, Goldstein JL (1997) The SREBP pathway: regulation of cholesterol metabolism by proteolysis of a membrane‐bound transcription factor. Cell 89: 331–340 - PubMed
Publication types
MeSH terms
Substances
Associated data
- Actions
- Actions
Grants and funding
- Cannon Foundation (The Cannon Foundation)
- Japan Agency for Medical Research and Development (AMED)
- Koyanagi Foundation
- Kurata Memorial Hitachi Science and Technology Foundation
- 22H04922/MEXT | Japan Society for the Promotion of Science (JSPS)
- 21K19399/MEXT | Japan Society for the Promotion of Science (JSPS)
- 20H04834/MEXT | Japan Society for the Promotion of Science (JSPS)
- 19H03496/MEXT | Japan Society for the Promotion of Science (JSPS)
- 19K22553/MEXT | Japan Society for the Promotion of Science (JSPS)
- 23K18234/MEXT | Japan Society for the Promotion of Science (JSPS)
- Naito Science and Engineering Foundation ( )
- SGH Foundation (SGH)
- Sumitomo Foundation ()
- Takeda Foundation ( )
- The Shimadzu Science Foundation
- Uehara Memorial Foundation (UMF)
LinkOut - more resources
Full Text Sources
Medical
Molecular Biology Databases
Research Materials

