. 2023 Oct 2:12:RP88049.
doi: 10.7554/eLife.88049.

Mice lacking triglyceride synthesis enzymes in adipose tissue are resistant to diet-induced obesity

Affiliations

Mice lacking triglyceride synthesis enzymes in adipose tissue are resistant to diet-induced obesity

Chandramohan Chitraju et al. Elife. .

Abstract

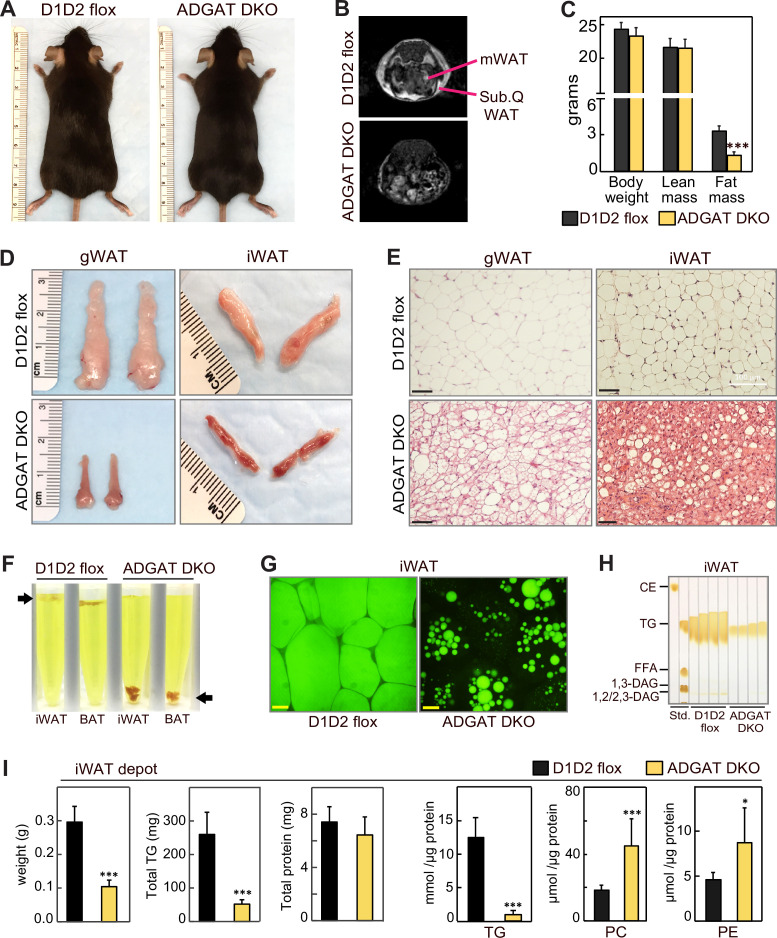
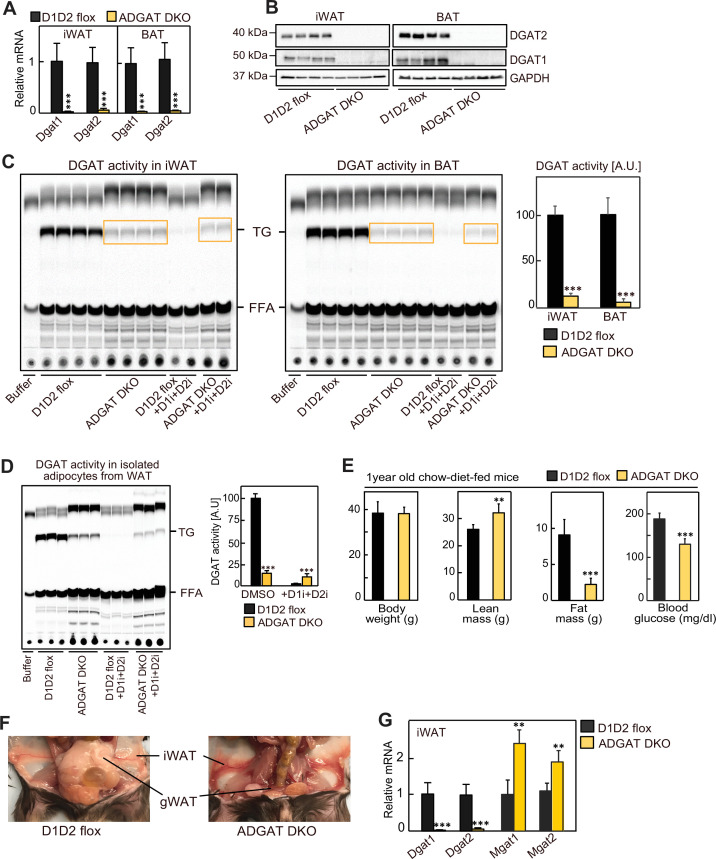
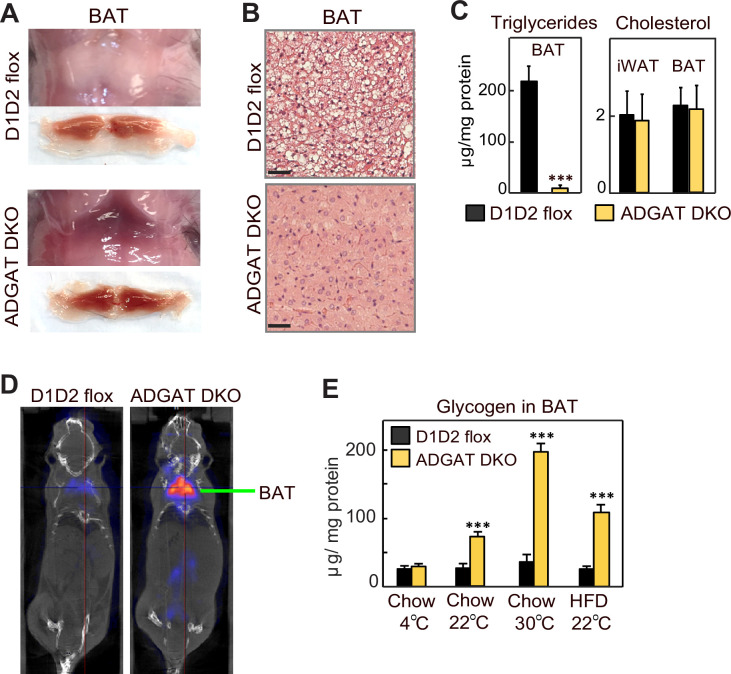
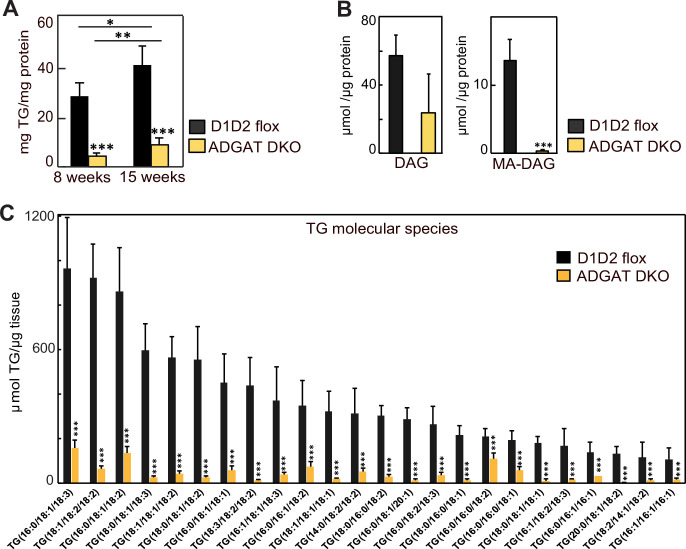
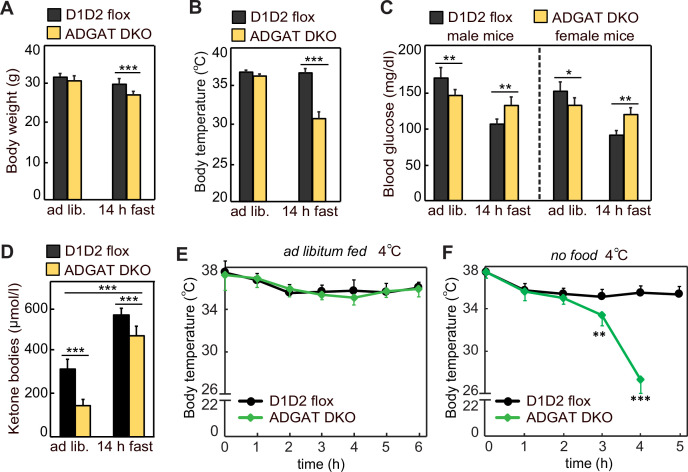
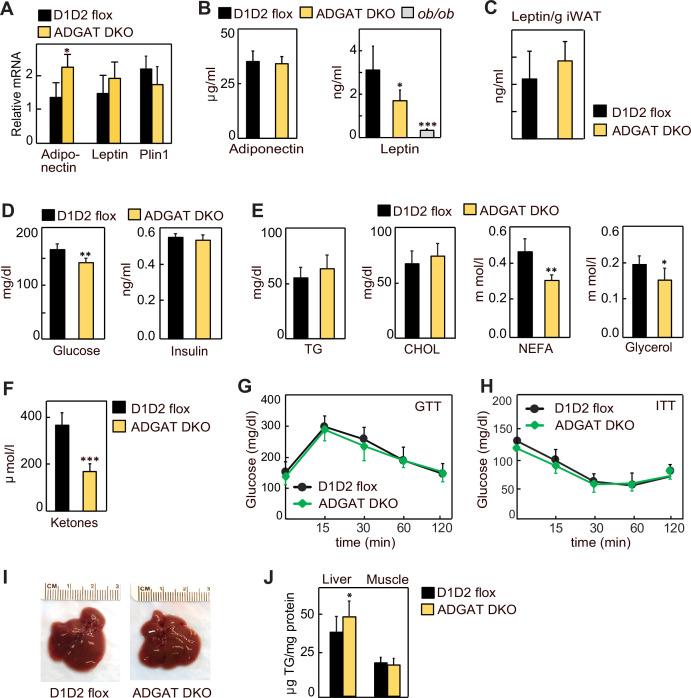
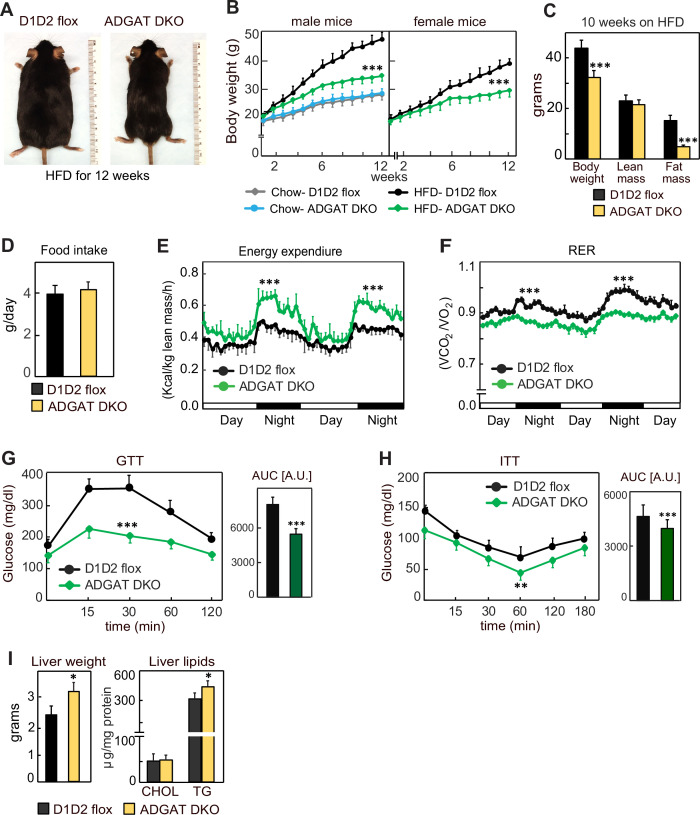
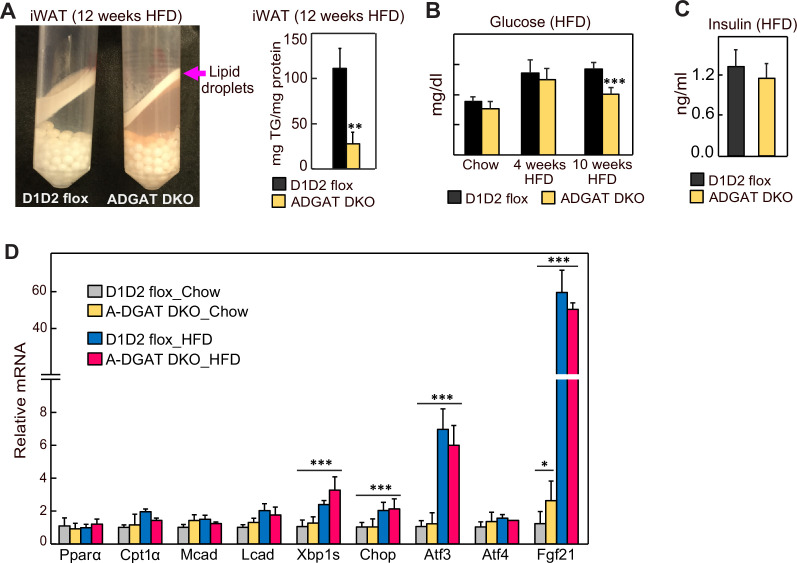
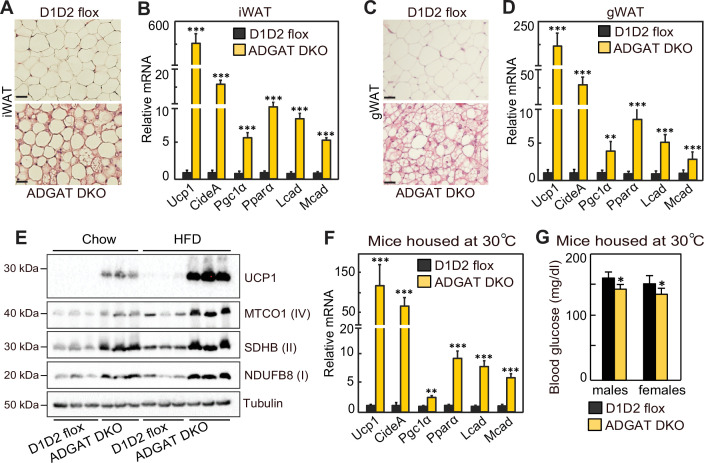
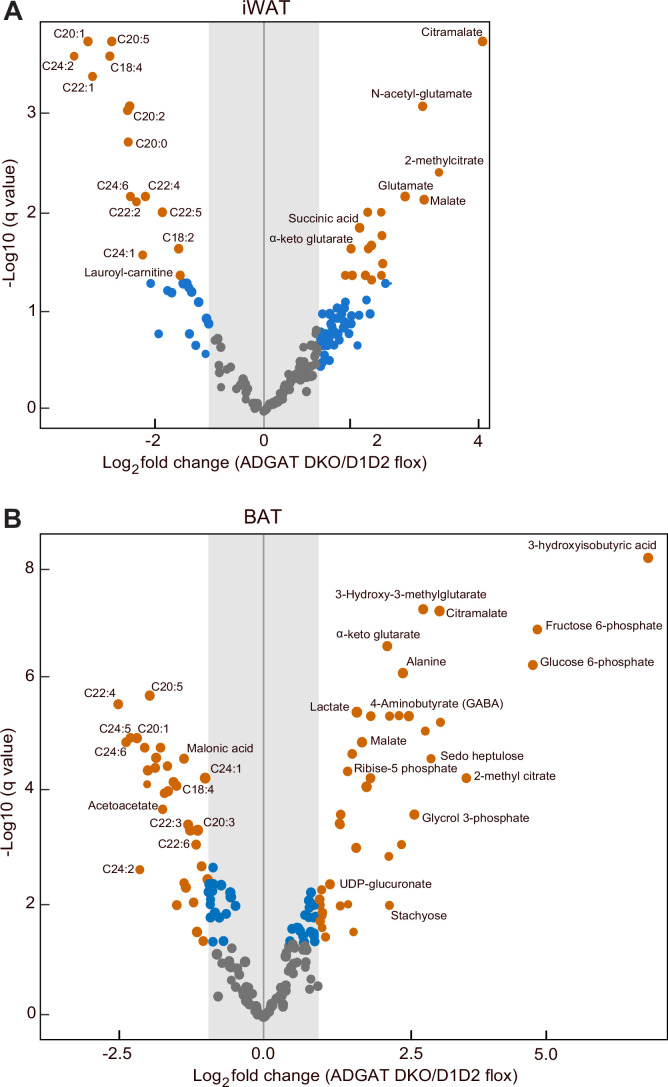
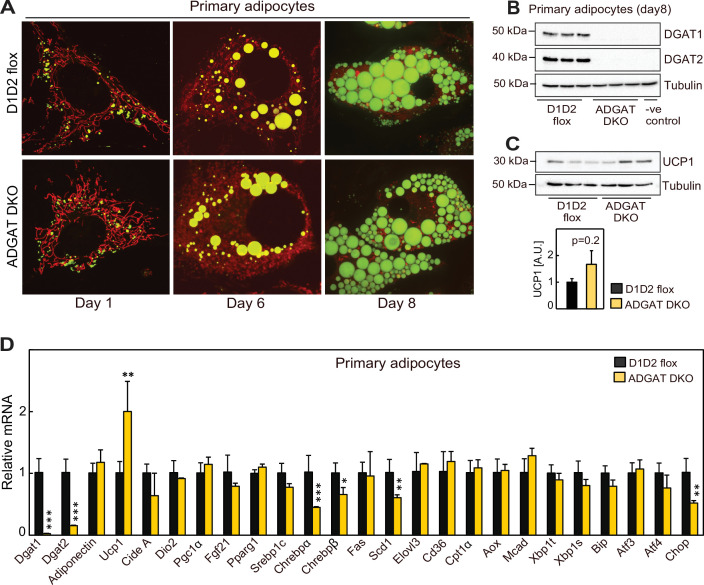
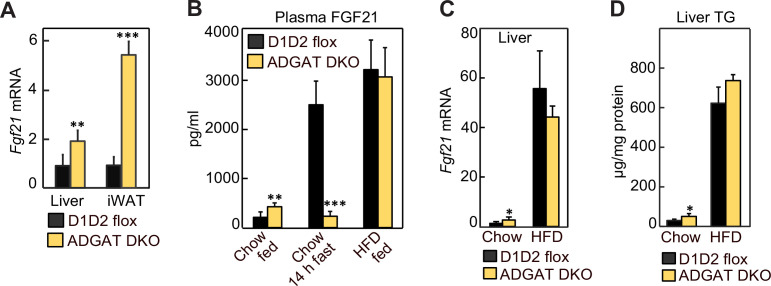
Triglycerides (TGs) in adipocytes provide the major stores of metabolic energy in the body. Optimal amounts of TG stores are desirable as insufficient capacity to store TG, as in lipodystrophy, or exceeding the capacity for storage, as in obesity, results in metabolic disease. We hypothesized that mice lacking TG storage in adipocytes would result in excess TG storage in cell types other than adipocytes and severe lipotoxicity accompanied by metabolic disease. To test this hypothesis, we selectively deleted both TG synthesis enzymes, DGAT1 and DGAT2, in adipocytes (ADGAT DKO mice). As expected with depleted energy stores, ADGAT DKO mice did not tolerate fasting well and, with prolonged fasting, entered torpor. However, ADGAT DKO mice were unexpectedly otherwise metabolically healthy and did not accumulate TGs ectopically or develop associated metabolic perturbations, even when fed a high-fat diet. The favorable metabolic phenotype resulted from activation of energy expenditure, in part via BAT (brown adipose tissue) activation and beiging of white adipose tissue. Thus, the ADGAT DKO mice provide a fascinating new model to study the coupling of metabolic energy storage to energy expenditure.

Keywords: adipose tissue; fat; glucose metabolism; lipodystrophy; medicine; metabolism; mouse; triglyceride.


Conflict of interest statement

CC, AF, YA, KW, BY, SH, TW, RF No competing interests declared

Figures

Figure 1.
Figure 1.. ADGAT DKO mice have reduced fat mass and triglycerides in adipose tissue.
(A) Chow-diet-fed ADGAT DKO mice appear normal. Representative photographs of control and ADGAT DKO female mice fed a chow diet. (B) Fat depots were decreased in ADGAT DKO mice. Nuclear magnetic resonance imaging of chow-diet-fed male mice. mWAT, mesenteric white adipose tissue; Sub.Q WAT, subcutaneous white adipose tissue. (C) ADGAT DKO mice have decreased fat mass. Dual-energy X-ray absorptiometry (DEXA) analysis of lean mass and fat mass of chow-diet-fed male mice (n=8). (D) Fat depots were atrophied in ADGAT DKO mice. Representative photographs of inguinal white adipose tissue (iWAT) and gonadal white adipose tissue (gWAT) from male mice (n=8). (E) gWAT and iWAT of ADGAT DKO mice contain multi-locular lipid droplets in adipocytes. H&E-stained sections of gWAT and iWAT from chow-diet-fed male mice (n=6). Scale bars, 50 µm. (F) WAT and brown adipose tissue (BAT) of ADGAT DKO mice were denser than controls and sink in an aqueous buffer with fixative (1.25% formaldehyde, 2.5% glutaraldehyde, and 0.03% picric acid in 0.1 M sodium cacodylate buffer, pH 7.4, density = 1.01 g/ml) used to fix tissue for electron microscopy. (G) Lipid droplets (LDs) in iWAT of ADGAT DKO mice stain with BODIPY. Confocal fluorescence microscopy images of adipose tissue. LDs were stained by BODIPY 493/503. Scale bar, 25 µm. (H) WAT of ADGAT DKO mice contain triglycerides. Thin layer chromatography analysis of lipids from iWAT of male mice (n=4). TGs, triglycerides; CE, cholesterol esters, FFA, free fatty acids; DAG, diacylglycerol. (I) Increased phospholipid levels in iWAT of ADGAT DKO mice. Lipids in iWAT were extracted and quantified by mass spectrometry (n=8). Data are presented as mean ± SD. *p<0.05, ***p<0.001.
Figure 1—figure supplement 1.
Figure 1—figure supplement 1.. ADGAT DKO mice have reduced DGAT1 and DGAT2 expression in adipose tissue.
(A) Dgat1 and Dgat2 transcripts levels were decreased in inguinal white adipose tissue (iWAT) and brown adipose tissue (BAT) of ADGAT DKO mice. Relative mRNA levels in iWAT and BAT of male mice fed a chow diet (n=6). (B) DGAT1 and DGAT2 proteins were absent in iWAT and BAT of ADGAT DKO mice. Western blot analysis of DGAT1 and DGAT2 in iWAT and BAT of male mice fed a chow diet (n=4). (C) In vitro DGAT activity was decreased in lysates of iWAT and BAT of ADGAT DKO male mice (n=4). (D) In vitro DGAT activity was decreased in isolated adipocytes from iWAT of ADGAT DKO male mice (n=4). (E) Body weights, lean mass, and fat mass analysis of 1-year-old male mice fed a chow diet (n=10). (F) Gross appearance of WAT depots in male mice. **p<0.01, ***p<0.001. (G) Relative mRNA levels of MGAT enzymes in iWAT of male mice fed a chow diet (n=6).
Figure 1—figure supplement 2.
Figure 1—figure supplement 2.. ADGAT DKO mice have reduced triglycerides in brown adipose tissue (BAT).
(A) Gross appearance of brown adipose tissue (BAT). (B) H&E-stained sections of inguinal BAT (iBAT) (n=6). Scale bars, 50 µm. (C) Triglycerides and total cholesterol levels in BAT (n=6). (D) [18F]-FDG-PET/CT scans of male mice administered CL 316,243. (E) Glycogen levels in iBAT of male mice (n=6). Data are presented as mean ± SD. ***p<0.001.
Figure 1—figure supplement 3.
Figure 1—figure supplement 3.. Most of the triglyceride molecular species were decreased in adipose tissue of ADGAT DKO mice.
(A) Triglycerides were decreased in inguinal white adipose tissue (iWAT) of ADGAT DKO male mice (n=6). Triglyceride levels were measured using Infinity Triglyceride Reagent. (B) Diacylglycerol and mono alkyl-diacylglycerol were decreased in iWAT of ADGAT DKO mice (n=6). Lipids were quantified by mass spectrometry. (C) Triglyceride molecular species were decreased in iWAT of ADGAT DKO mice (n=6). Lipids were quantified by mass spectrometry. Data are presented as mean ± SD. *p<0.05, **p<0.01, ***p<0.001.
Figure 2.
Figure 2.. Adipose tissue triglyceride (TG) stores are required to prevent a torpor-like state during fasting.
(A) Body weights of male mice fed ad libitum or fasted 14 hr (n=10). Ad lib., ad libitum fed. (B) Core body temperature of male mice housed at room temperature and fed ad libitum or fasted for 14 hr (n=10). (C) Blood glucose levels in male and female mice fed ad libitum or fasted for 14 hr (n=8). (D) Levels of plasma ketone bodies in male mice fed ad libitum or fasted for 14 hr (n=8). (E and F) Core body temperature of male mice housed in cold (5°C) with or without food (n=10). Data are presented as mean ± SD. *p<0.05, **p<0.01, ***p<0.001.
Figure 3.
Figure 3.. Lipodystrophy is uncoupled from detrimental metabolic effects in ADGAT DKO mice.
(A) Adiponectin and leptin mRNA levels were moderately increased in inguinal white adipose tissue (iWAT) of ADGAT DKO mice. Relative mRNA levels of leptin and adiponectin in iWAT of chow-diet-fed male mice (n=6). (B) Plasma levels of adiponectin were normal, and leptin levels were moderately decreased in ad libitum chow-diet-fed male mice (n=8). (C). Plasma leptin levels normalized per gram of WAT mass (n=8). (D) ADGAT DKO mice had normal glucose and insulin levels. Glucose and insulin levels in ad libitum chow-diet-fed male mice (n=8). (E) Decreased free fatty acids in ADGAT DKO mice. Levels of plasma metabolites in ad libitum chow-diet-fed male mice (n=8). (F) Decreased ketones in ad libitum chow-diet-fed ADGAT DKO male mice (n=8). TG, triglycerides; CHOL, cholesterol; NEFA, non esterified fatty acids (G and H) Glucose and insulin tolerance tests were normal in chow-diet-fed male mice (n=10). (I) ADGAT DKO mice had non-steatotic livers. Representative photographs of livers from chow-diet-fed mice. (J) Triglycerides were moderately increased in livers of ADGAT DKO mice. Triglyceride levels in livers and skeletal muscle of chow-diet-fed male mice (n=6). Data are presented as mean ± SD. *p<0.05, **p<0.01, ***p<0.001.
Figure 4.
Figure 4.. ADGAT DKO mice are resistant to diet-induced obesity and glucose intolerance.
(A) ADGAT DKO mice stay lean on a high-fat diet (HFD). Representative photographs of male mice fed on HFD for 12 weeks. (B) Both male and female ADGAT DKO mice gained ~40% less body weight than control mice. Body weights of mice fed on a chow-diet or HFD (n=15 for males, n=12 for females). (C) ADGAT DKO mice had decreased fat mass on HFD feeding. Dual-energy X-ray absorptiometry (DEXA) analysis of lean mass and fat mass of HFD fed male mice (n=10). (D) ADGAT DKO male mice had normal food intake during HFD feeding (n=5). (E and F) ADGAT DKO mice had increased energy expenditures. Energy expenditure and respiratory quotient on HFD-fed male mice measured by indirect calorimetry. Values were normalized to lean mass (n=4). (G and H) ADGAT DKO mice were protected from HFD-induced glucose intolerance and insulin resistance. Glucose- and insulin-tolerance tests were performed on HFD-fed (for 9 or 10 weeks, respectively) male mice (n=10). AUC, area under the curve. (I) Liver weights and triglyceride levels were moderately increased in HFD-fed ADGAT DKO male mice (n=6). Data are presented as mean ± SD. *p<0.05, **p<0.01, ***p<0.001.
Figure 4—figure supplement 1.
Figure 4—figure supplement 1.. ADGAT DKO mice gradually activate an alternative mechanism to synthesize triglycerides.
(A) Lipid droplets (LDs) isolated from inguinal white adipose tissue (iWAT) of mice fed a high-fat diet (HFD). (B) Blood glucose levels in HFD-fed male mice (n=8). (C) Insulin levels in HFD-fed male mice (n=8). (D) Relative mRNA levels in livers of HFD mice (n=6). Data are presented as mean ± SD. *p<0.05, **p<0.01, ***p<0.001.
Figure 5.
Figure 5.. Beiging of white adipose tissue (WAT) in ADGAT DKO mice.
(A) ADGAT DKO mice contain multi-locular lipid droplets (LDs) in adipocytes of inguinal WAT (iWAT). H&E-stained sections of iWAT from male mice fed a chow diet and housed at room temperature (n=6). Scale bars, 50 µm. (B) Increased expression of thermogenic marker genes in iWAT of ADGAT DKO mice. Relative mRNA levels of thermogenic genes in iWAT of male mice fed a chow diet and housed at room temperature (n=6). (C) ADGAT DKO mice contain multi-locular LDs in adipocytes of gonadal white adipose tissue (gWAT). H&E-stained sections of gWAT from male mice fed a chow diet and housed at room temperature (n=6). Scale bars, 50 µm. (D) Increased expression of thermogenic marker genes in gWAT of ADGAT DKO mice. Relative mRNA levels of thermogenic genes in gWAT of male mice fed a chow diet and housed at room temperature (n=6). (E) High-fat diet (HFD) feeding increases levels of UCP1 in iWAT of ADGAT DKO mice. Immunoblot analysis of UCP1 and OXPHOS proteins in iWAT of male mice fed either a chow diet or an HFD (n=3). Mice were housed at room temperature. (F) Beiging was intact in iWAT of thermoneutral-housed ADGAT DKO mice. Relative mRNA levels of thermogenic genes in iWAT of chow-diet-fed male mice housed at thermoneutral temperature for 6 weeks (n=6). (G) Blood glucose levels were normal in thermoneutral-housed ADGAT DKO mice. Glucose levels in male mice fed a chow diet and housed at thermoneutral temperature for 6 weeks (n=8). Data are presented as mean ± SD. *p<0.05, **p<0.01, ***p<0.001.
Figure 5—figure supplement 1.
Figure 5—figure supplement 1.. Analysis of metabolites in inguinal white adipose tissue (iWAT) of ADGAT DKO mice.
(A) Volcano plot showing differentially abundant metabolites in inguinal white adipose tissue (iWAT) of chow-diet-fed male mice (n=8). (B) Volcano plot showing differentially abundant metabolites in inguinal brown adipose tissue (iBAT) of chow-diet-fed male mice (n=8). Orange dots represent metabolites with more than twofold change (adjusted p values or q<0.05). Blue dots represent metabolites with more than twofold change but not statistically significant. Gray dots represent metabolites that were unchanged between control and ADGAT DKO mice.
Figure 5—figure supplement 2.
Figure 5—figure supplement 2.. Primary adipocytes cultured from inguinal white adipose tissue (iWAT) of ADGAT DKO mice contain lipid droplets.
(A) Primary adipocytes differentiated from stromal vascular fraction of inguinal white adipose tissue (iWAT) from ADGAT DKO male mice contain lipid droplets (LDs). LDs were stained by BODIPY 493/503. (B and C) Western blot analysis of DGATs and UCP1 in primary adipocytes (n=3). (D) Relative mRNA levels in day 8 primary adipocytes loaded with oleic acid for 16 hr (n=3). Data are presented as mean ± SD. *p<0.05, **p<0.01, ***p<0.001.
Figure 5—figure supplement 3.
Figure 5—figure supplement 3.. Fibroblast growth factor 21 (FGF21) levels were increased in ADGAT DKO mice.
(A) FGF21 transcript levels were increased in inguinal white adipose tissue (iWAT) and livers of ADGAT DKO mice. Relative mRNA levels of FGF21 in iWAT and livers of chow-diet-fed male mice (n=6). (B) FGF21 levels were increased in ADGAT DKO mice. Plasma levels of FGF21 in chow-diet-fed (ad libitum fed or 14 hr fasted) or high-fat diet (HFD)-fed male mice (n=8). (C) FGF21 transcript levels in livers of chow-diet- or HFD-fed male mice (n=6). (D) Triglyceride levels in livers of chow-diet- or HFD-fed male mice (n=6). Data are presented as mean ± SD. *p<0.05, **p<0.01, ***p<0.001.

Update of

References

    1. Abu-Odeh M, Zhang Y, Reilly SM, Ebadat N, Keinan O, Valentine JM, Hafezi-Bakhtiari M, Ashayer H, Mamoun L, Zhou X, Zhang J, Yu RT, Dai Y, Liddle C, Downes M, Evans RM, Kliewer SA, Mangelsdorf DJ, Saltiel AR. FGF21 promotes thermogenic gene expression as an autocrine factor in adipocytes. Cell Reports. 2021;35:109331. doi: 10.1016/j.celrep.2021.109331. - DOI - PMC - PubMed
    1. Becher T, Palanisamy S, Kramer DJ, Eljalby M, Marx SJ, Wibmer AG, Butler SD, Jiang CS, Vaughan R, Schöder H, Mark A, Cohen P. Brown adipose tissue is associated with cardiometabolic health. Nature Medicine. 2021;27:58–65. doi: 10.1038/s41591-020-1126-7. - DOI - PMC - PubMed
    1. Cases S, Smith SJ, Zheng YW, Myers HM, Lear SR, Sande E, Novak S, Collins C, Welch CB, Lusis AJ, Erickson SK, Farese RV. Identification of a gene encoding an acyl CoA:diacylglycerol acyltransferase, a key enzyme in triacylglycerol synthesis. PNAS. 1998;95:13018–13023. doi: 10.1073/pnas.95.22.13018. - DOI - PMC - PubMed
    1. Cases S, Stone SJ, Zhou P, Yen E, Tow B, Lardizabal KD, Voelker T, Farese RV. Cloning of DGAT2, a second mammalian diacylglycerol acyltransferase, and related family members. The Journal of Biological Chemistry. 2001;276:38870–38876. doi: 10.1074/jbc.M106219200. - DOI - PubMed
    1. Chen HC, Smith SJ, Ladha Z, Jensen DR, Ferreira LD, Pulawa LK, McGuire JG, Pitas RE, Eckel RH, Farese RV. Increased insulin and leptin sensitivity in mice lacking acyl CoA:diacylglycerol acyltransferase 1. The Journal of Clinical Investigation. 2002;109:1049–1055. doi: 10.1172/JCI14672. - DOI - PMC - PubMed

Publication types