The burden of nonalcoholic fatty liver disease (NAFLD) is rapidly growing in every region of the world from 1990 to 2019
- PMID: 37782469
- PMCID: PMC10545420
- DOI: 10.1097/HC9.0000000000000251
The burden of nonalcoholic fatty liver disease (NAFLD) is rapidly growing in every region of the world from 1990 to 2019
Abstract
Background: The latest meta-analyses suggest NAFLD is increasing globally. Its limitations may preclude accurate estimates. We evaluated the global NAFLD burden and its' trends in prevalence and NAFLD liver-related mortality (LRM) by sex, age, region, and country over the past 3 decades using data from the Global Burden of Disease (GBD) 2019 study.
Methods: Crude and age-standardized NAFLD prevalence and NAFLD-LRM rates were obtained for all-age individuals with NAFLD from 204 countries/territories between 1990 and 2019. Joinpoint trend analysis assessed time trends. Weighted average of the annual percent change (APC) over the period 1990-2019 and 2010-2019 were reported.
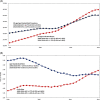
Results: All-age (children and adults) crude global NAFLD prevalence increased:10.5% (561 million)-16.0% (1,236 million); an APC increase: + 1.47% (95% CI, 1.44%, 1.50%). Among adults (+20 y), crude NAFLD prevalence increased (1990: 17.6%, 2019:23.4%; APC: + 1.00%, 95% CI: 0.97%, 1.02%). In all-age groups, the crude NAFLD-LRM rate (per 100,000) increased (1990: 1.75%, 2019: 2.18%; APC: + 0.77% (95% CI, 0.70%, 0.84%). By Joinpoint analysis, from 2010 to 2019, worsening all-age trends in NAFLD prevalence and LRM were observed among 202 and 167 countries, respectively. In 2019, there were 1.24 billion NAFLD prevalent cases and 168,969 associated deaths; Asia regions accounted for 57.2% of all-age prevalent cases and 46.2% of all-age NAFLD-LRM. The highest all-age crude NAFLD prevalence rate was the Middle East and North Africa (LRM 26.5%); the highest all-age crude NAFLD-LRM rate was Central Latin America (5.90 per 100,000).
Conclusions: NAFLD is increasing globally in all-age groups-over 80% of countries experienced an increase in NAFLD and NAFLD-LRM. These data have important policy implications for affected countries and for global health.
Copyright © 2023 The Author(s). Published by Wolters Kluwer Health, Inc. on behalf of the American Association for the Study of Liver Diseases.
Conflict of interest statement
Zobair M. Younossi consulted and received grants from AbbVie, Bristol Myers Squibb, GENFIT, Gilead, Intercept, Madrigal, Merck, Novo Nordisk, Siemens, Terns, and Viking. The remaining authors have no conflicts to report.
Figures


References
-
- Pan Q, Fan J, Yilmaz Y. Pathogenetic pathways in nonalcoholic fatty liver disease: An incomplete Jigsaw puzzle. Clin in Liver Disease. 2023;27:317–332; (In Press). - PubMed
-
- Younossi Z, Anstee QM, Marietti M, Hardy T, Henry L, Eslam M, et al. Global burden of NAFLD and NASH: Trends, predictions, risk factors and prevention. Nat Rev Gastroenterol Hepatol. 2018;15:11–20. - PubMed
-
- Paik JM, Golabi P, Younossi Y, Mishra A, Younossi ZM. Changes in the global burden of chronic liver diseases from 2012 to 2017: The Growing Impact of NAFLD. Hepatology. 2020;72:1605–1616. - PubMed
-
- Younossi ZM, Stepanova M, Younossi Y, Golabi P, Mishra A, Rafiq N, et al. Epidemiology of chronic liver diseases in the USA in the past three decades. Gut. 2020;69:564–568. - PubMed
MeSH terms
LinkOut - more resources
Full Text Sources
Medical
Miscellaneous

