. 2023 Oct 10;120(41):e2306020120.
doi: 10.1073/pnas.2306020120. Epub 2023 Oct 2.

Localized microbially induced inflammation influences distant healthy tissues in the human oral cavity

Affiliations

Localized microbially induced inflammation influences distant healthy tissues in the human oral cavity

Kristopher A Kerns et al. Proc Natl Acad Sci U S A. .

Abstract

Variation in human immune response to the same bacterial or viral pathogen is well established in the literature. Variation in immune response to microbial challenge has also been observed within the human oral cavity. Our recent study focused on characterizing observed variations in microbially induced gingival inflammation-resulting in three distinct clinical Inflammatory Responder Types (IRTs): High-IRT, Low-IRT, and Slow-IRT. Here, we applied a high-resolution temporal multiomic analysis during microbially induced inflammation in order to characterize the effects of localized oral inflammation on distant healthy tissues in young healthy adults. Our results highlight a nonlocalized subclinical effect with alterations in proinflammatory host mediators and an ecological shift toward dysbiosis within the subgingival microbiome in an IRT-dependent manner-despite maintained oral hygiene. Our results provide mechanistic insight into how healthy tissues within humans are influenced by distant localized inflammation and may ultimately become susceptible to disease.

Keywords: experimental gingivitis; host response; mucosal inflammation; periodontal disease; subgingival microbiome.


Conflict of interest statement

The authors declare no competing interest.

Figures

Fig. 1.
Fig. 1.
EG incorporating a split mouth design reveals control sites are not static and vary by IRT. (A) Study overview highlighting the clinical EG model. (B) Proportion of clinical IRTs (Materials and Methods). (C) PI stratified by IRT test and control sites during the Induction phase (Days 0 to 21). (D) Mean PI by IRT test and control sites during the Induction phase. (E) GI stratified by IRT test and control sites during the Induction phase. Red dashed line represents a GI value of 1.5 and represents the difference between high and low levels of clinically observed inflammation. (F) Mean GI by IRT test and control sites during the Induction phase. (G) BOP stratified by IRT test and control sites during the Induction phase. (H) Mean BOP by IRT test and control sites during the Induction phase. (I) GCF volume stratified by IRT test and control sites during the Induction phase. (J) Mean GCF volume by IRT test and control sites during the Induction phase. (K) Bacterial Load (16S rRNA gene copies) stratified by IRT test and control sites during the Induction phase. (L) Mean Bacterial Load by IRT test and control sites during the Induction phase. Significance level indicated by asterisks: *P < 0.05, **P ≤ 0.01, ***P ≤ 0.001, and ****P ≤ 0.0001. All significance test results between test and control sites provided in SI Appendix,Tables S6–S11 and Figs. S1 and S2).
Fig. 2.
Fig. 2.
Changes in subgingival plaque diversity are observed in healthy control sites and varies by IRT. (A) Alpha diversity measured by Observed ASVs and Shannon Indices. (B) Bray–Curtis Dissimilarity Index for each IRT test site compared to baseline (Day 0) over the Induction phase (Days 0 to 21). (C) Bray–Curtis Dissimilarity Index for each IRT control site compared to baseline over the Induction phase. (D) Beta Diversity calculated using Weighted Unifrac Distances and visualized by PCoA for each IRT test and control sites. Marginal Boxplots indicate PC1 and PC2 over the Induction phase. Boxes represent the distribution of data and medians ± interquartile ranges; whiskers and outliers >1.5 IQR below (above) the 25th (75th) percentile. Trend lines represent loess regression mean values across all time points. Dashed lines represent test sites, and solid lines represent control sites. Statistical analysis was performed using the nonparametric Wilcoxon-Rank Sum Test adjusted by FDR. Weighted Unifrac Beta Diversity was assessed for significance using the PERMANOVA, 999 permutations. Significance level indicated by asterisks: *P < 0.05, **P ≤ 0.01.
Fig. 3.
Fig. 3.
Microbiome compositions shift within healthy control sites in a responder-dependent manner. (A) Mean relative abundance of phylum level agglomerated data are shown for each clinical IRT Test and Control sites over the Induction phase (Days 0 to 21). Dashed lines represent Test sites, and solid lines represent Control sites. Statistical significance for changes in relative abundance during the Induction phase are reported in table 1. (BG) Fold Change using Genus level agglomerated data over the Induction Phase compared to baseline (Day 0) stratified by IRT Test and Control sites. Genera positively associated with gingival inflammation, gingivitis, and/or periodontitis are highlighted in red. (H - J) Summary of the number of Genera with a Fold Change greater than 1.0 by IRT Test and Control site over the Induction phase. Inset figures of Bacterial Load (Log10 transformed 16S copy numbers) are shown for each IRT Test and Control site over the Induction phase. A dashed red line is shown across all IRTs for reference. Dashed lines represent Test sites, and solid lines represent Control sites. (KM) Percent relative abundance of agglomerated data at the phylum level grouped by IRT Test and Control sites over the Induction period where dashed lines represent Test sites and solid lines represent Control sites (e.g., HTB = High-IRT Test Bacteroidetes; HTF = High-IRT Test Firmicutes; HCB = High-IRT Control Bacteroidetes; HCF = High-IRT Control Firmicutes). Graphical interpretation of the temporal shifts in community composition are highlighted by IRT, respectively (e.g., HT Shift = High-IRT Test Shift; HC Shift = High-IRT Control Shift). Trend lines represent mean values by IRT test or control over the Induction phase. Whiskers represent SE.
Fig. 4.
Fig. 4.
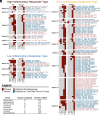
ASVs are detected contralaterally between test and control sites. ASV level data were converted to a presence–absence matrix and plotted as a heatmap in order to identify contralateral detection between test and control sites over the induction period (Days 0 to 21) by clinical IRT. Gram-negative and CPR genera that were enriched in test sites were selected for this analysis resulting in a total of 3,509 ASVs. Red text represents ASVs that were detected simultaneously between test and control sites by subject. Blue text represents ASVs that were detected in test sites prior to any detection in control sites by subject. (A) High-IRT by subject resulted in 29 (0.83%) ASVs that were contralaterally detected. 6/6 subjects had a contralaterally detected ASV. (B) Low-IRT by subject resulted in 15 (0.43%) ASVs that were contralaterally detected. 3/6 subjects had a contralaterally detected ASV. (C) Slow-IRT by subject resulted in 89 (2.5%) ASVs that were contralaterally detected. 8/9 subjects had a contralaterally detected ASV. (D) A Table of the gram-negative and CPR genera used in this analysis, the number of species detected within those genera as well as the number of corresponding ASVs for each genera.
Fig. 5.
Fig. 5.
Induced inflammation in test sites changes chemokine profiles in control sites. (A) CCL2 by IRT test and control during the Induction phase (Days 0 to 21). (B) IL-10 by IRT test and control during the Induction phase. (C) CCL1 by IRT test and control during the Induction phase. (D) Macrophage MIF by IRT test and control during the Induction phase. (E) Row-wise z-scored heatmap of host inflammatory mediators (28) clustered using the k-means algorithm for IRT test and control sites over the Induction phase. Select chemokines associated with periodontal inflammation and health are highlighted in red. (F) Trajectories of clustered chemokines over the Induction phase represented by the SD from the mean chemokine value. Gray dashed line represents major host mediator shift within test sites. Boxes represent data and medians ± interquartile ranges; whiskers and outliers >1.5 IQR below (above) the 25th (75th) percentile. Trend lines represent loess regression mean values across all time points. Statistical analysis was performed using logistic regression adjusted by FDR. Significance level indicated by asterisks. Significance levels: *P < 0.05, **P < 0.01, and ***P < 0.001. Clusters containing statistically significant changing host mediators and those associated with periodontal inflammation are highlighted in red.
Fig. 6.
Fig. 6.
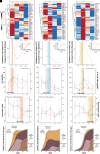
Maturing plaque in test sites induces host mediator changes in control sites which precede a shift in the control site microbiome. (AC) A row-wise z-scored heatmap of LFC of chemokines compared to baseline (Day 0) among different clinical IRT control sites. Key inflammatory mediators are highlighted in red text. (DF) Quantification of the number of mediators with a LFC greater than 1 over the Induction phase by IRT control site. Shaded boxes highlight the shift in host mediators within respective control sites. Inset clinical Gingival Inflammation (GI) plots for the Induction phase by IRT test and control sites. Red dashed line represents GI = 1.5. (GI) IL-8 (Left y axis), IL-6, and TNF-a (Right y axis) among IRT control sites over the Induction phase. Shaded boxes highlight the shift in host mediators within respective control sites. (JL) Percent relative abundance of Firmicutes (Left y axis) and Bacteroidetes (Right y axis) using agglomerated data at the phylum level. Trendlines represent the mean value. Solid lines represent IRT control sites and dashed lines represent IRT test sites. Labels represent IRT test and control sites by Phylum (i.e., HTF—High Test Firmicutes, HCF—High Control Firmicutes, HTB—High Test Bacteroidetes, HCB—High Control Bacteroidetes). Shaded boxes highlight the shift in host mediators within respective control sites. (MO) Graphical interpretation of the temporal relationships of the microbiome and host mediators between test and control sites over the Induction phase.

References

    1. Bamashmous S., et al. , Human variation in gingival inflammation. Proc. Natl. Acad. Sci. U.S.A. 118, e2012578118 (2021). - PMC - PubMed
    1. Loe H., Silness J., Periodontal disease in pregnancy. I. Prevalence and severity. Acta Odontol. Scand. 21, 533–551 (1963). - PubMed
    1. Trombelli L., et al. , Experimental gingivitis: Reproducibility of plaque accumulation and gingival inflammation parameters in selected populations during a repeat trial. J. Clin. Periodontol. 35, 955–960 (2008). - PubMed
    1. Trombelli L., et al. , Modulation of clinical expression of plaque-induced gingivitis. III. Response of "high responders" and "low responders" to therapy. J. Clin. Periodontol. 31, 253–259 (2004). - PubMed
    1. Trombelli L., et al. , Modulation of clinical expression of plaque-induced gingivitis. II. Identification of "high-responder" and "low-responder" subjects. J. Clin. Periodontol. 31, 239–252 (2004). - PubMed

Publication types

LinkOut - more resources