Review
. 2023 Mar;52(1):104176.
doi: 10.1016/j.lpm.2023.104176. Epub 2023 Sep 30.

Diagnostic criteria and etiopathogenesis of type 2 diabetes and its complications: Lessons from the Pima Indians

Affiliations
Review

Diagnostic criteria and etiopathogenesis of type 2 diabetes and its complications: Lessons from the Pima Indians

Helen C Looker et al. Presse Med. 2023 Mar.

Abstract

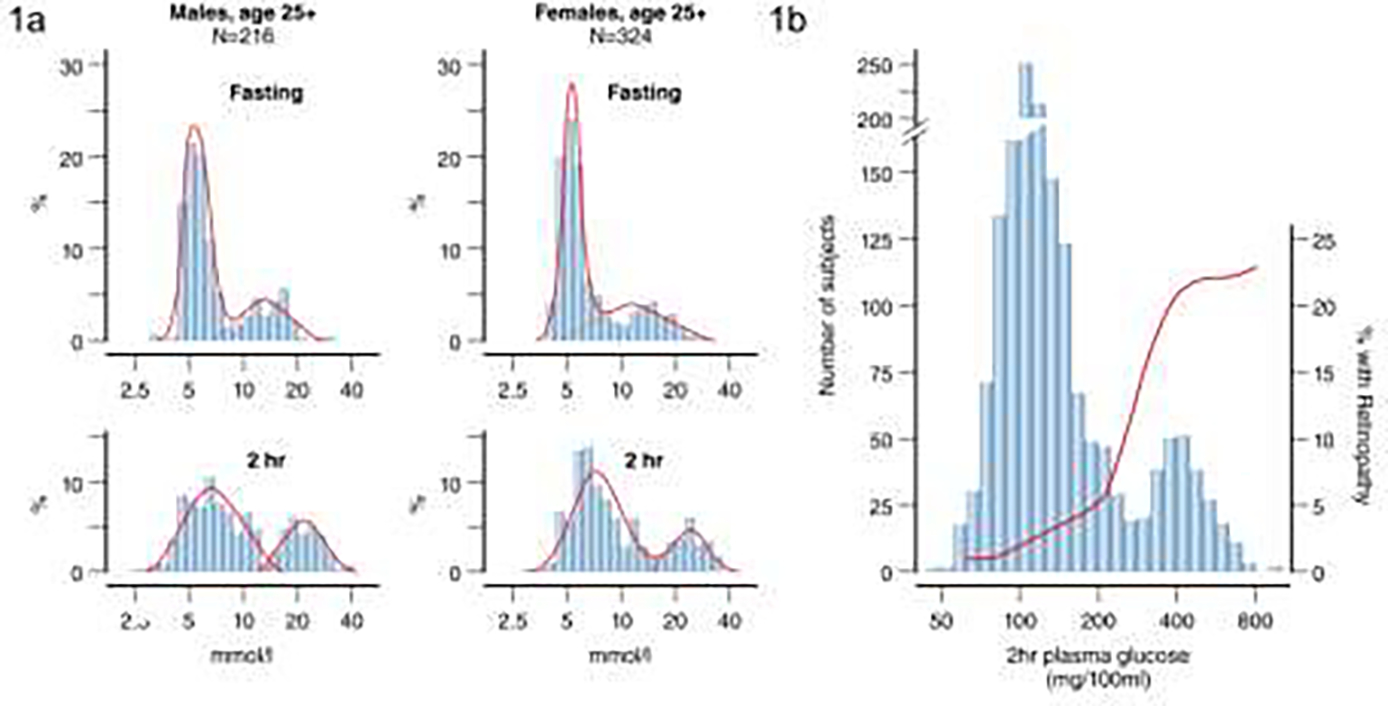
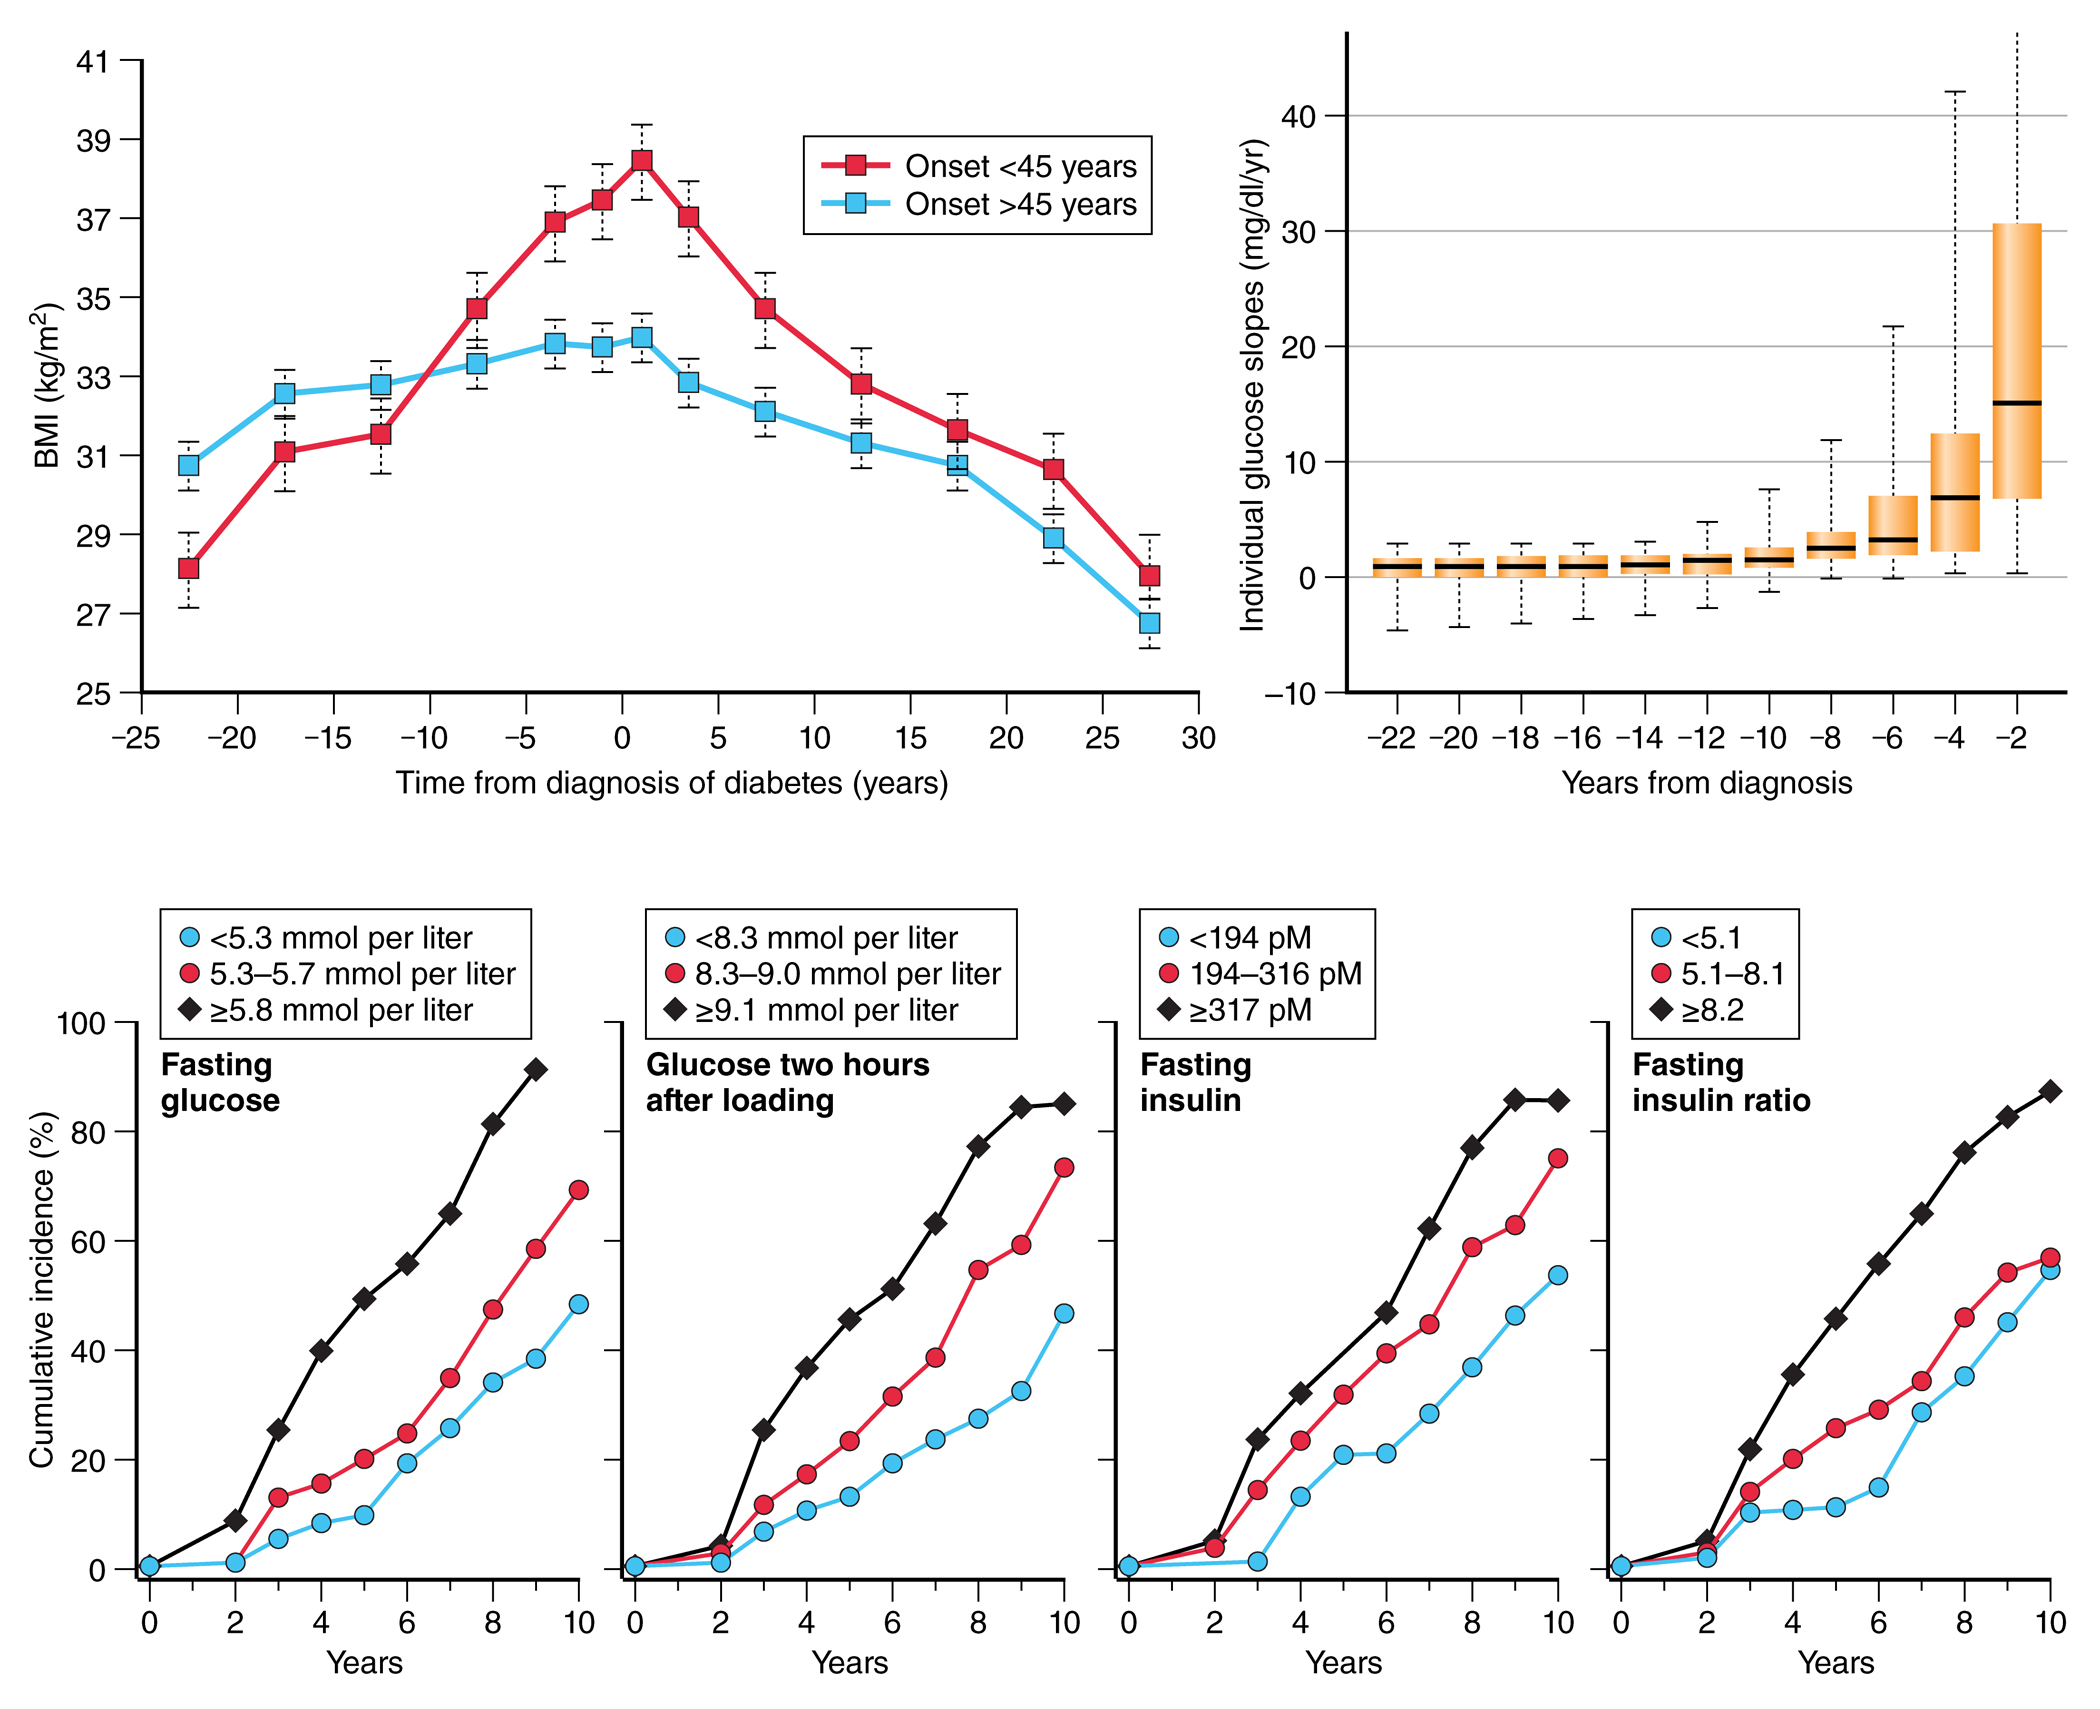
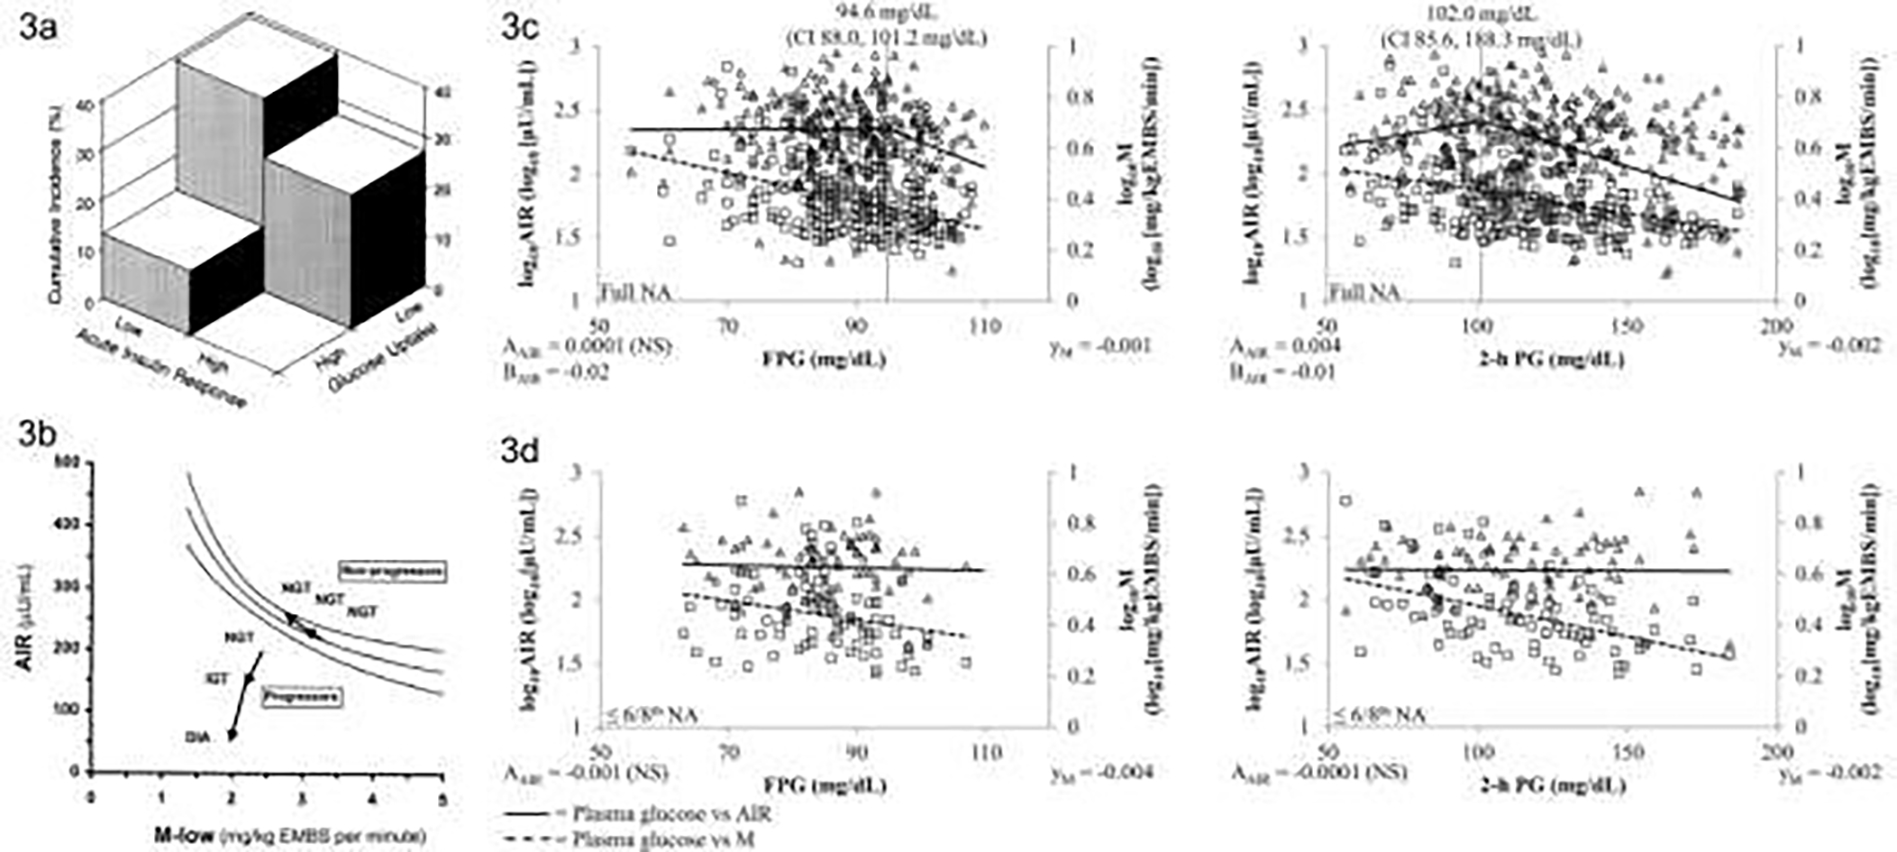
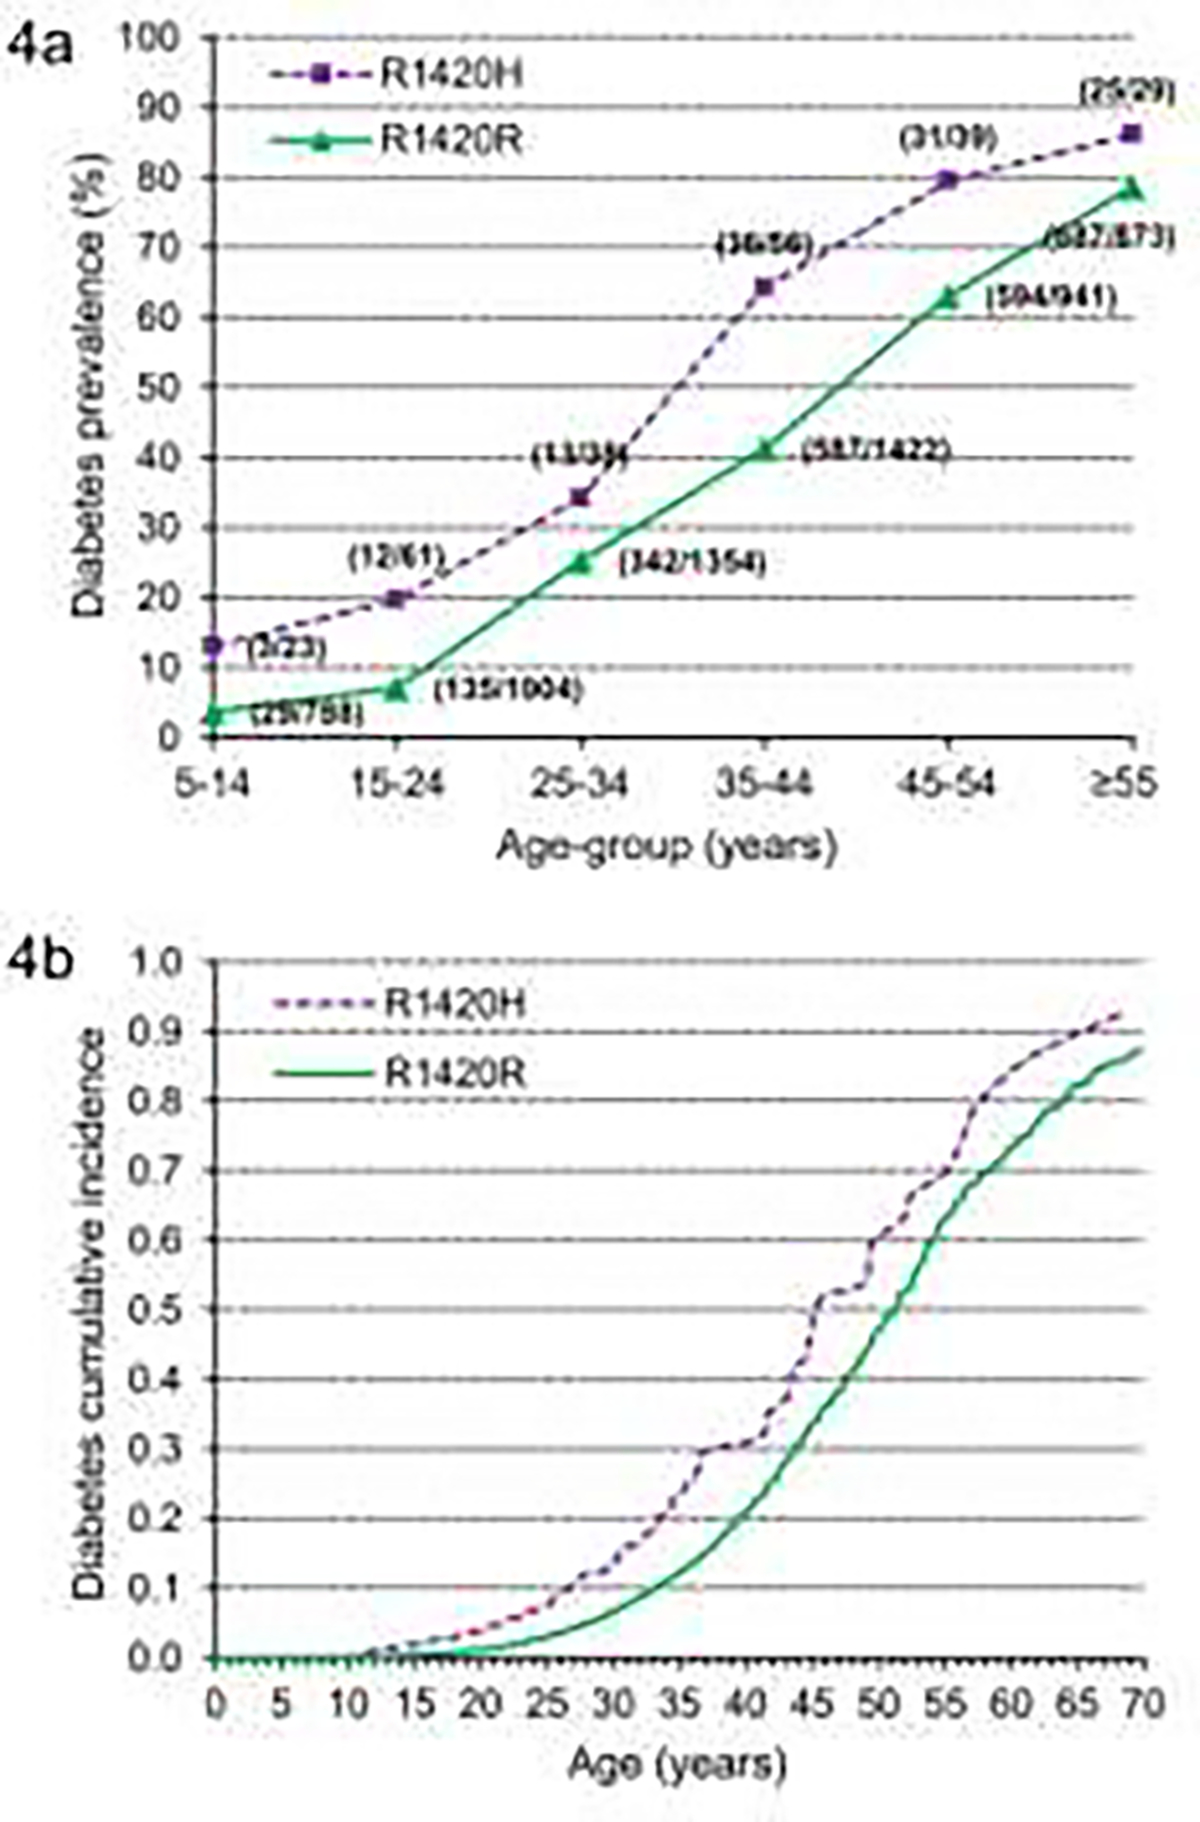
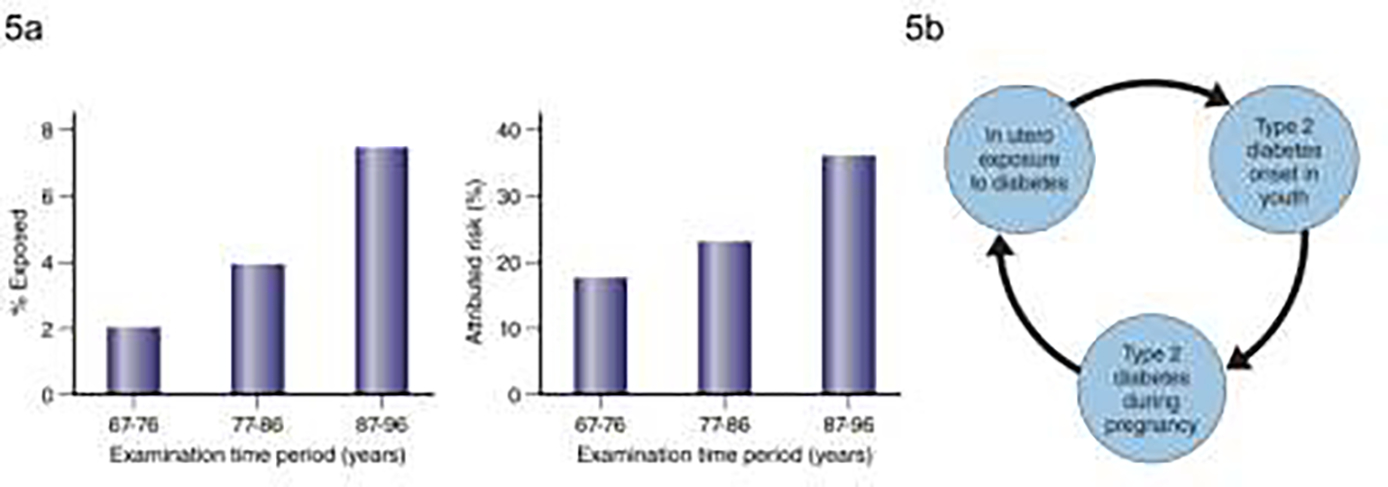
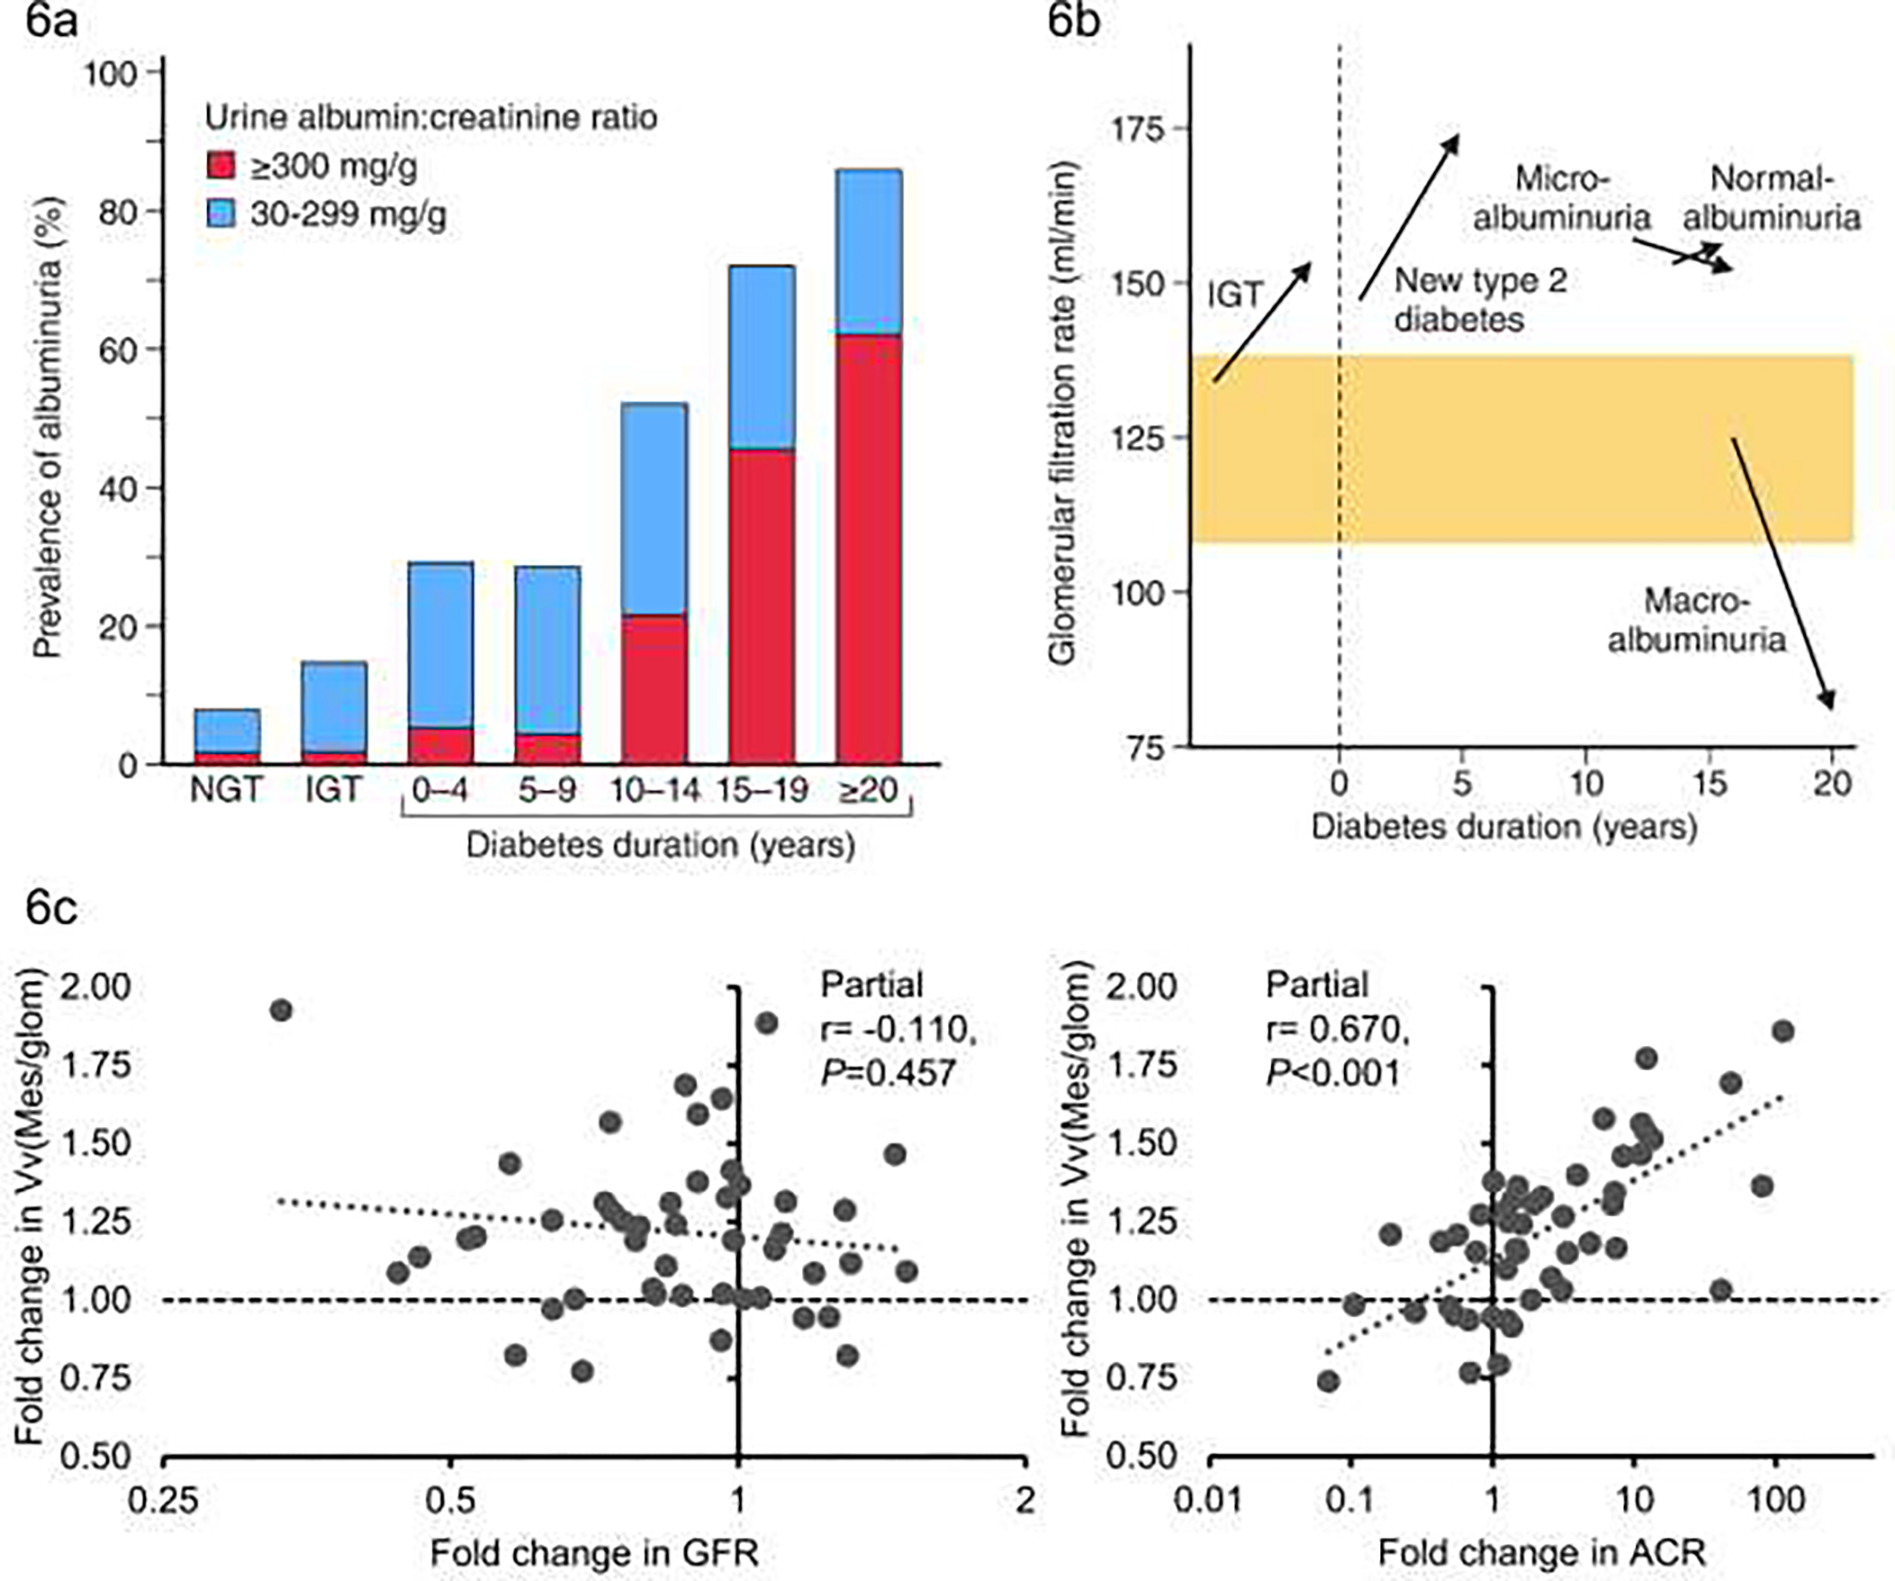
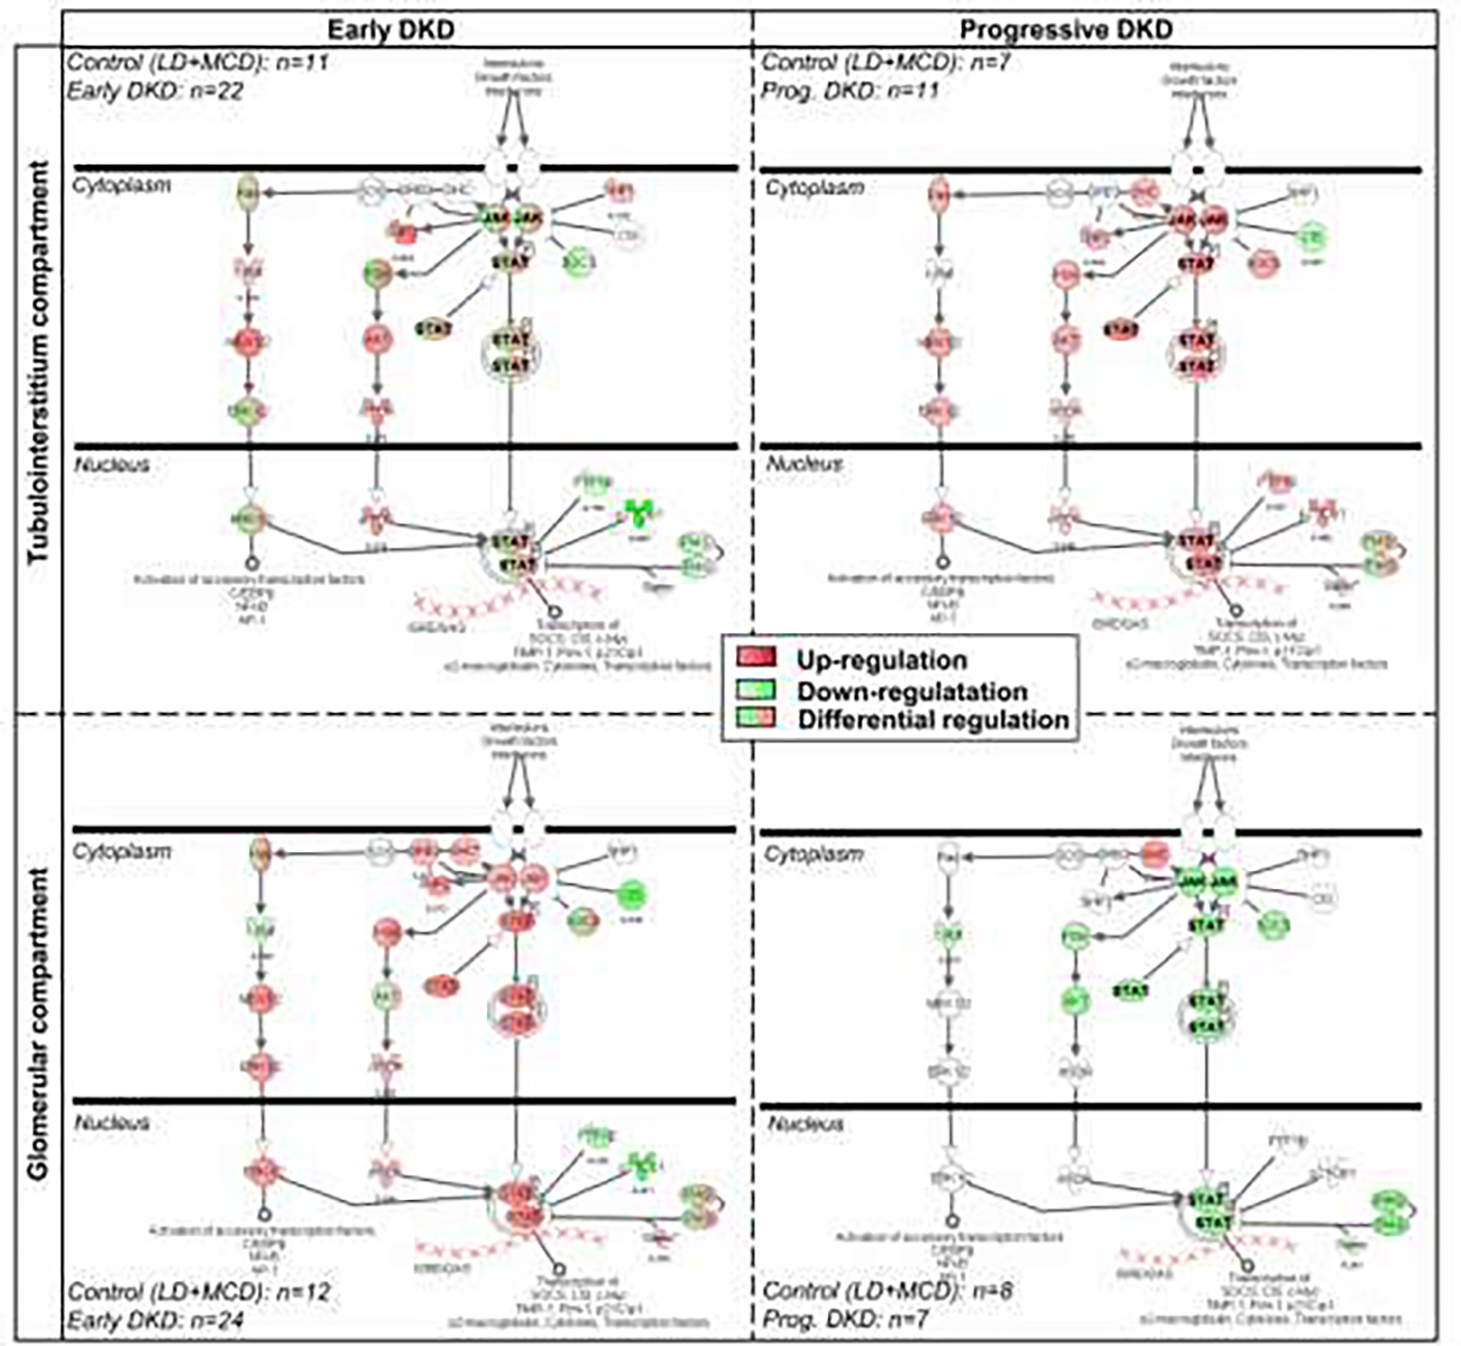
The Phoenix Epidemiology and Clinical Research Branch of the National Institute of Diabetes and Digestive and Kidney Diseases has conducted prospective studies of diabetes and its complications in the Pima Indians living in Arizona, USA for over 50 years. In this review we highlight areas in which these studies provided vital insights into the criteria used to diagnose type 2 diabetes, the pathophysiologic changes that accompany the development of type 2 diabetes, and the course and determinants of diabetes complications-focusing specifically on diabetic kidney disease. We include data from our longitudinal population-based study of diabetes and its complications, studies on the role of insulin resistance and insulin secretion in the pathophysiology of type 2 diabetes, and in-depth studies of diabetic kidney disease that include measures of glomerular function and research kidney biopsies. We also focus on the emerging health threat posed by youth-onset type 2 diabetes, which was first seen in the Pima Indians in the 1960s and is becoming an increasing issue worldwide.

Keywords: American Indians; Complications; Pathophysiology; Type 2 diabetes.


Conflict of interest statement

Disclosure of interest The authors declare that they have no competing interests.

Figures

FIGURE 1:
FIGURE 1:
a) Distribution of fasting and 2-hour glucose in Pima Indians for men and women aged over 25 years at time of examination– data shows bimodal distribution (Adapted from Rushforth et al, 1979 ); b) Bimodal glucose distribution and prevalence of retinopathy as assessed by fundoscopy in 1640 adult Pima Indians aged 15–64 years for men and 15–74 years for women demonstrating rise in prevalence of retinopathy around a cut-point of 200 mg/dl (11.1 mmol/l) (Adapted from Dorf et al, 1976). NOTE: Figure 1b uses non-SI units.
FIGURE 2:
FIGURE 2:
a) Change in body mass index in Pima Indian adults before and after diagnosis of diabetes. Each point represents the mean +/− standard error for each 5-year duration band, divided by age of onset of diabetes (Adapted from Looker et al, 2001 ); b) Distribution of instantaneous glucose slopes (rates of change of glucose in individuals) in 55 Pima Indians by time from diabetes diagnosis. Data are medians with 25th and 75th percentiles with ranges shown by error bars (Adapted from Mason et al, 2007 ); c) cumulative incidence of diabetes based on tertiles of fasting glucose, 2-hour glucose, fasting insulin, and 2-hour insulin showing highest cumulative incidence of diabetes in the highest tertile of each measure (Adapted from Saad et al 1988 ). NOTE: Figure 2b uses non-SI units.
FIGURE 3:
FIGURE 3:
a) Cumulative incidence of diabetes according to whether measures of acute insulin response and glucose uptake fall below or above the median – the highest cumulative incidence is seen in the participants with below median values of both measures (From Lillioja et al, 1993); b) Disposition index for participants with NGT compared to participants who progressed from NGT to IGT and then diabetes – shows the relationship in the progressors does not fall on the normal hyperbolic curve even when still NGT and continues to move away from the curve as glycemia worsens (From Weyer et al, 1999); c) Acute insulin response (AIR) of full heritage Pima Indians and; d) those with ≤3/4th Pima heritage relative to increasing fasting (FPG) and 2-h plasma glucose (2-h PG) concentrations. Triangles mark the relationship of AIR and plasma glucose concentrations, whereas squares stand for the relationship between the rate of insulin-dependent glucose disposal (M) and plasma glucose concentrations. For plasma glucose concentration vs. AIR, AAIR gives the slope up to the plasma glucose concentration of the inflexion point. BAIR indicates the slope for this relationship beyond that point. The inflexion point is marked by a vertical line and its respective plasma glucose concentration with 95% confidence interval (CI) is reported. Where no inflexion point was found, AAIR gives the overall slope. In each panel, development of AIR relative to plasma glucose concentrations is indicated by a line. The trendline for plasma glucose concentrations vs. M is indicated by a dashed line, and its slope is reported (yM). Slopes and trendlines for plasma glucose concentrations vs. AIR and M, respectively, were tested for statistical significance (NS, not significant). Values for AIR and M were log10-transformed to meet linear distribution. Abbreviations: AIR, acute insulin response; DIA, type 2 diabetes; EMBS, estimated metabolic body size; IGT, impaired glucose tolerance; NA, Native Americans; NGT, normal glucose tolerance. (From Heinitz et al, 2018 ) NOTE: Figures 3c and 3d use non-SI units.
FIGURE 4:
FIGURE 4:
a) Prevalence of type 2 diabetes for Arg1420His carriers and noncarriers shown in individuals grouped by their age at last exam. Numbers in parentheses indicate the number of subjects with diabetes (numerator) and total number of subjects (denominator) for each age-group; (From Baier et al, 2015 ) b) Type 2 diabetes cumulative incidence adjusted for sex, birth year, and ancestry (American Indian/European admixture based on genetic markers and self-reported fraction Pima Indian heritage). Mean onset age was calculated from the parameters of the Weibull model for an individual born in 1940, and the mean age for all other covariates was 45.0 years for Arg1420His and 52.1 years for Arg1420Arg. (From Baier et al, 2015 )
FIGURE 5:
FIGURE 5:
a) Prevalence of exposure to diabetes in utero in children aged 5–19 years by examination period in the left-hand panel and attributable risk for diabetes in children aged 5–19 years in the in right-hand panel (Adapted from Dabelea et al, 2000); b) the “vicious cycle” of in utero exposure to diabetes leading to young onset of diabetes in the offspring leading to more of the offspring’s children exposed to diabetes in utero (Adapted from Knowler et al, 1990).
FIGURE 6:
FIGURE 6:
a) Prevalence of albuminuria by glycemia and diabetes duration (blue bars for ACR 30–299 mg/dl), red bars for ACR >= 300 mg/dl) NGT = normal glucose tolerance, IGT = impaired glucose tolerance (Adapted from Nelson et al 1989); b) Changes in mean glomerular filtration rate by glycemia stage, diabetes duration and degree of albuminuria - normoalbuminuria = ACR <30 mg/dl micro-albuminuria = ACR 30–299 mg/dl, also known as moderate albuminuria; macroalbuminuria = ACR >= 300 mg/dl) also known as severe albuminuria (Adapted from Nelson et al, 1996); c) Association of fold change in fractional mesangial volume with fold change in ACR (right panel) and fold change in GFR (left panel) partial correlation coefficients are adjusted for age, sex and baseline values of ACR and GFR respectively (Adapted from Looker et al, 2019).
FIGURE 7:
FIGURE 7:
JAK/Stat canonical pathway in diabetic kidney disease as assessed by Ingenuity Pathway Analysis software. The expression patterns in the Pima Indian samples (marked ‘Early DKD’) and in the European samples (marked ‘Progressive DKD’). Red indicates increased expression, green reduced expression and green with red for differential expression (Adapted from Berthier et al, 2009 ).
FIGURE 8:
FIGURE 8:
Ingenuity Pathway (Ingenuity Systems, QIAGEN, Redwood City, CA) network showing significant pathways (P ≤ 0.05) enriched by cortical interstitial fractional volume (VvInt)-correlated transcripts. Pathways are connected by 1 or more shared genes. The network displays 2 principal domains driven by negatively correlated (left) and positively correlated (right) transcripts. The nodes (pathways) are connected by (edges) genes shared among them. (From Nair et al, 2018 ).
FIGURE 9:
FIGURE 9:
a) Diagram outlining the hyperfiltration study design showing the groups defined based on timing of peak GFR in relation to kidney biopsy, and interrogation of gene expression data to identify genes associated with hyperfiltration followed by examination of single cell data to identify cell types associated with the enriched hyperfiltration genes leading to development of a model for cross-talk between cell types in hyperfiltration (From Steffansson et al, 2022); b) molecular insights into hyperfiltration associated with early DKD. CALCRL, calcitonin receptor like receptor; COL1A2, collagen type I alpha 2 chain; COL3A1, collagen type III alpha 1 chain; DLL4, delta-like canonical notch ligand 4; EDN1, endothelin-1; EDNRA, endothelin receptor A; ELN, elastin; Gas6, growth arrest–specific gene 6; HES1, hes family bHLH transcription factor 1; ICAM, intercellular adhesion molecule; JUN, Jun proto-oncogene; MMP2, matrix metallopeptidase 2; MYC, MYC proto-oncogene; NOTCH4, notch receptor 4; NRP1, neuropilin 1; PDGFB, platelet derived growth factor subunit B; S1PR1, sphingosine-1-phosphate receptor 1; TAGLN, transgelin; TGFB1, transforming growth factor-β1; TGFBR2, transforming growth factor-β receptor 2; TIMP2, TIMP metallopeptidase inhibitor 2; VEGF165R, vascular endothelial growth factor 165 receptor; VEGFA, vascular endothelial growth factor A (From Steffansson et al, 2022).
FIGURE 10:
FIGURE 10:
a) Incidence of proteinuria (urine protein-to-creatinine ratio ≥0.5 g/g) by age of onset of diabetes black circles – diabetes diagnosed age <20 years, black squares – diabetes diagnosed age 20–39 years, black triangles – diabetes diagnosed age 40–59 years. Test for trend, P = 0.77, calculated using Mantel-Haenzel test to compare incidence rates between age groups, controlling for diabetes duration (From Krakoff et al, 2003 ); b) Sex adjusted incidence rates of kidney failure by age of onset for Pima Indians aged between 25 and 54 years – red bars for youth-onset type 2 diabetes (age of onset under 20 years) and blue bars older-onset type 2 diabetes (age of onset over 20 years) (Adapted from Pavkov et al ); c) Association of selected kidney structure measures with age at onset of diabetes. Plots show correlation of residuals for each structural measure and age at onset of diabetes adjusted for attained age, sex, HbA1c, BMI, and GFR (From Looker et al, 2022).

Similar articles

Cited by

References

    1. Knowler WC, Bennett PH, Hamman RF, Miller M. Diabetes incidence and prevalence in Pima Indians: a 19-fold greater incidence than in Rochester, Minnesota. American journal of epidemiology 1978;108:497–505. - PubMed
    1. Knowler WC, Bennett PH, Bottazzo GF, Doniach D. Islet cell antibodies and diabetes mellitus in Pima Indians. Diabetologia 1979;17:161–4. - PubMed
    1. Savage PJ, Bennett PH, Senter RG, Miller M. High prevalence of diabetes in young Pima Indians: evidence of phenotypic variation in a genetically isolated population. Diabetes 1979;28:937–42. - PubMed
    1. Dabelea D, Palmer JP, Bennett PH, Pettitt DJ, Knowler WC. Absence of glutamic acid decarboxylase antibodies in Pima Indian children with diabetes mellitus. Diabetologia 1999;42:1265–6. - PubMed
    1. Baier LJ, Muller YL, Remedi MS, et al. ABCC8 R1420H Loss-of-Function Variant in a Southwest American Indian Community: Association With Increased Birth Weight and Doubled Risk of Type 2 Diabetes. Diabetes 2015;64:4322–32. - PMC - PubMed

MeSH terms