

Hepatocyte nuclear factor 4α mediated quinolinate phosphoribosylltransferase (QPRT) expression in the kidney facilitates resilience against acute kidney injury
- PMID: 37783445
- PMCID: PMC10843022
- DOI: 10.1016/j.kint.2023.09.013
Hepatocyte nuclear factor 4α mediated quinolinate phosphoribosylltransferase (QPRT) expression in the kidney facilitates resilience against acute kidney injury
Abstract
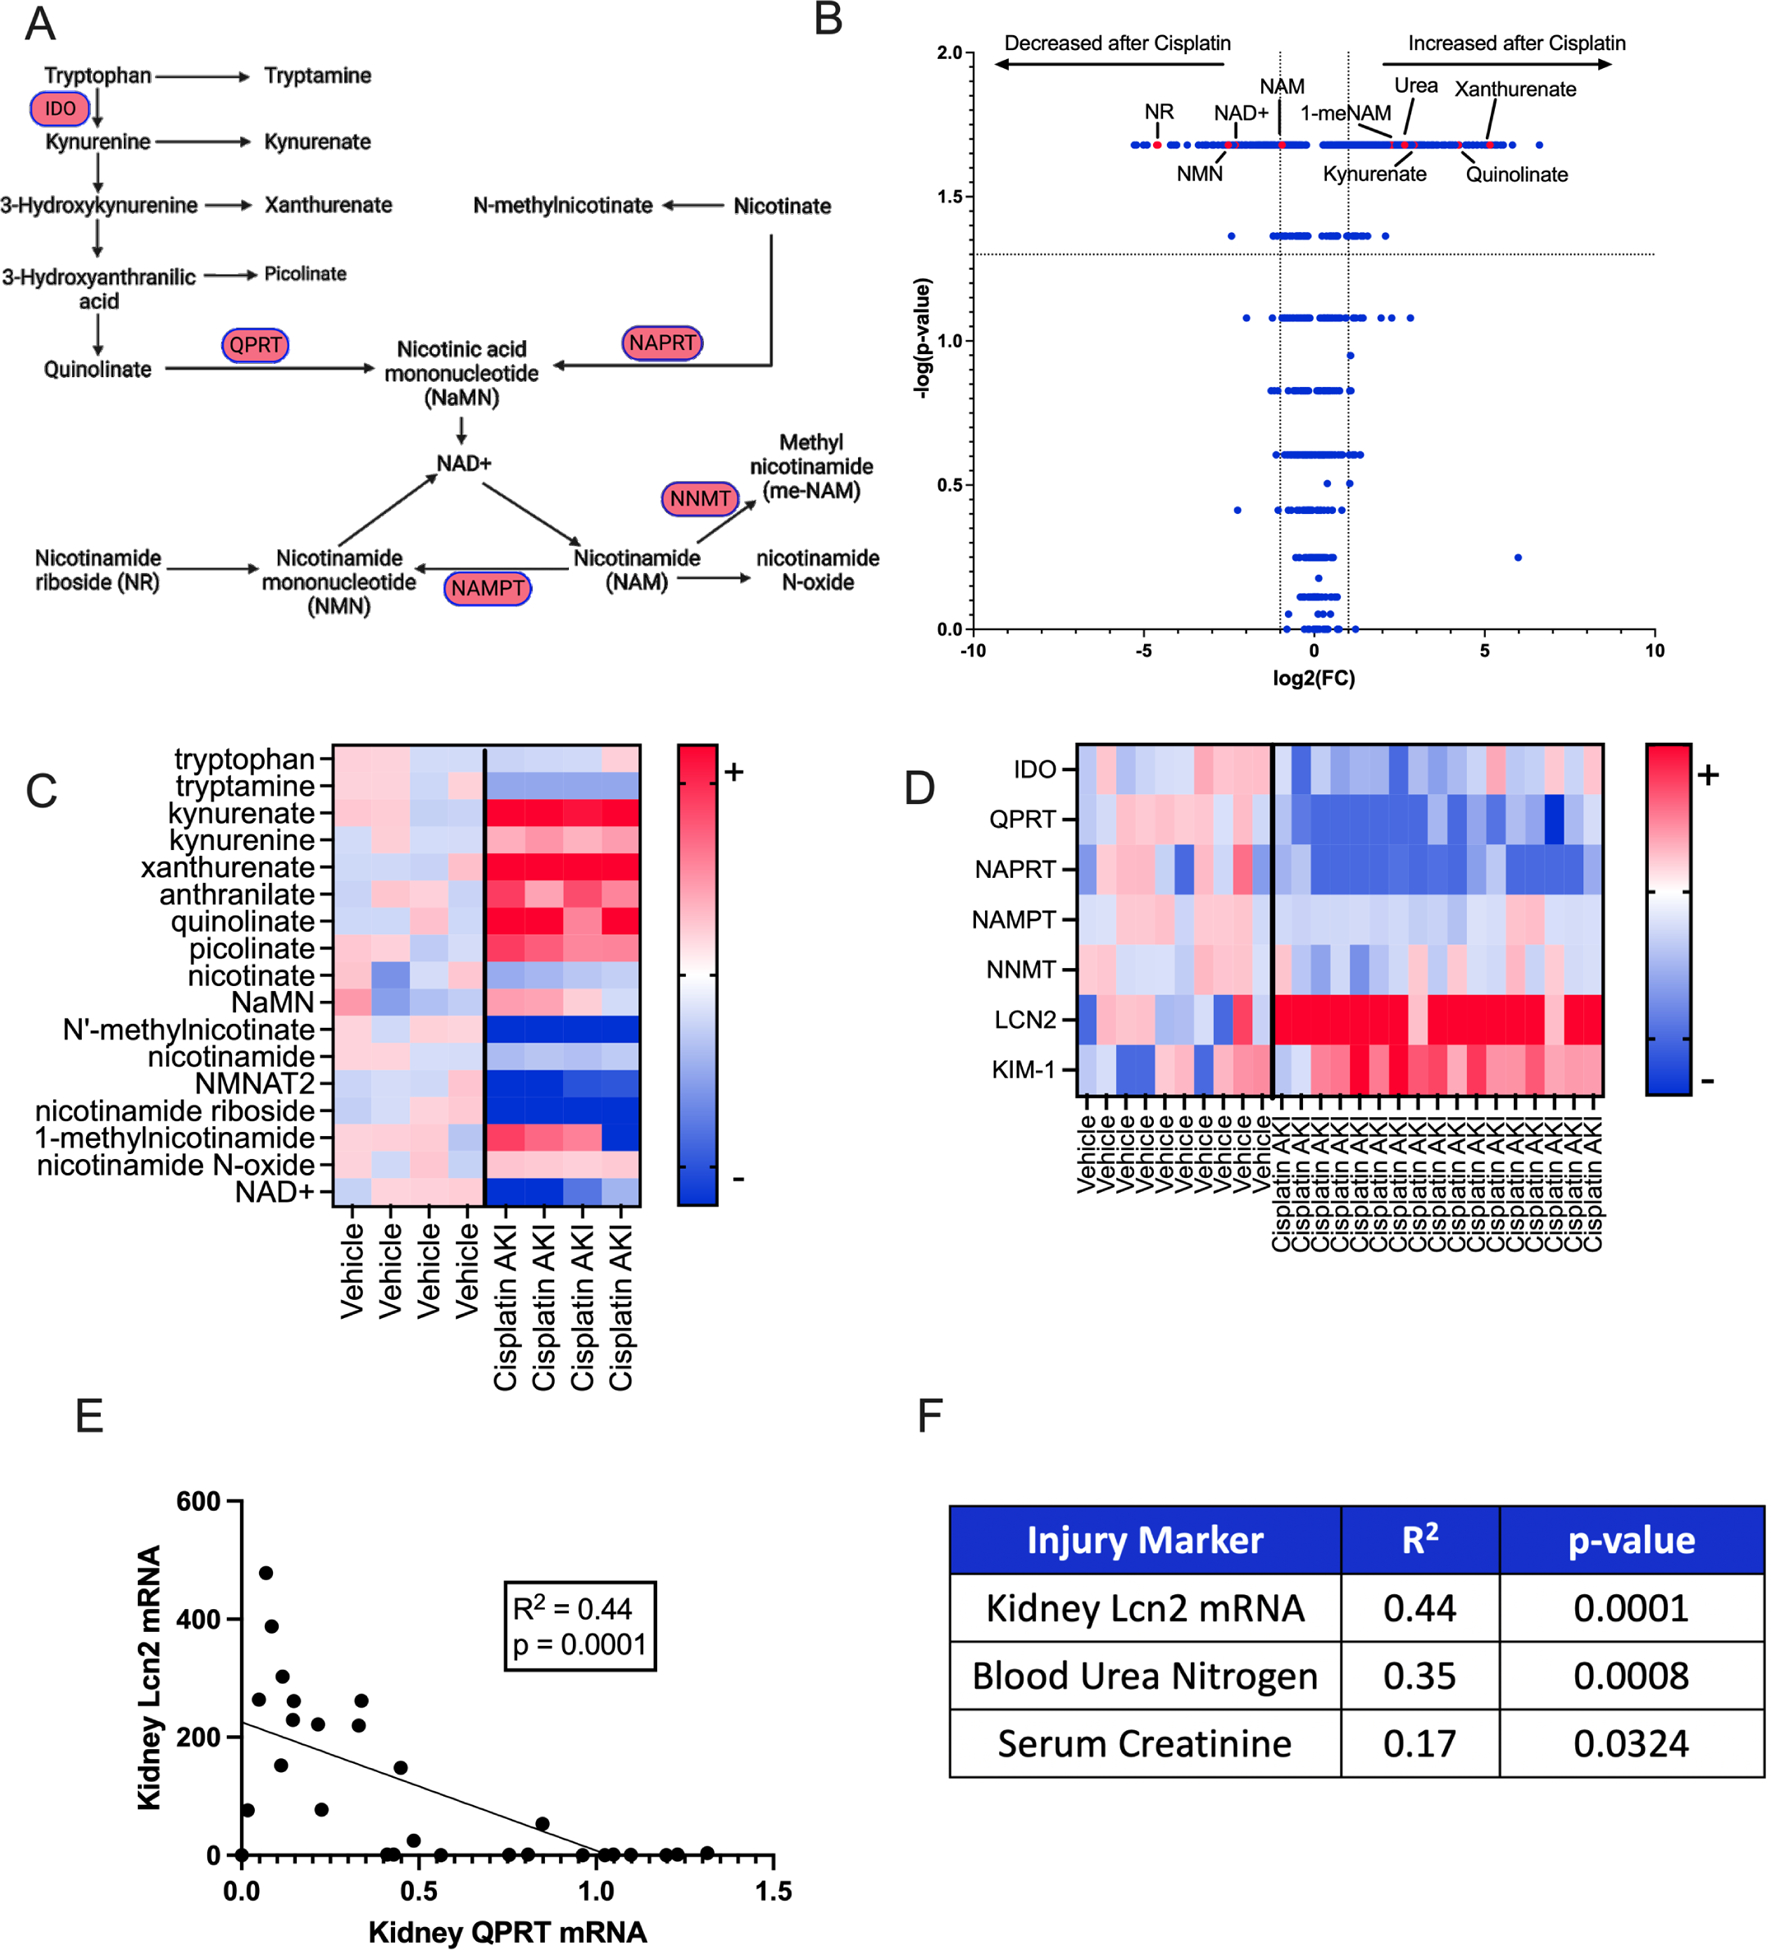
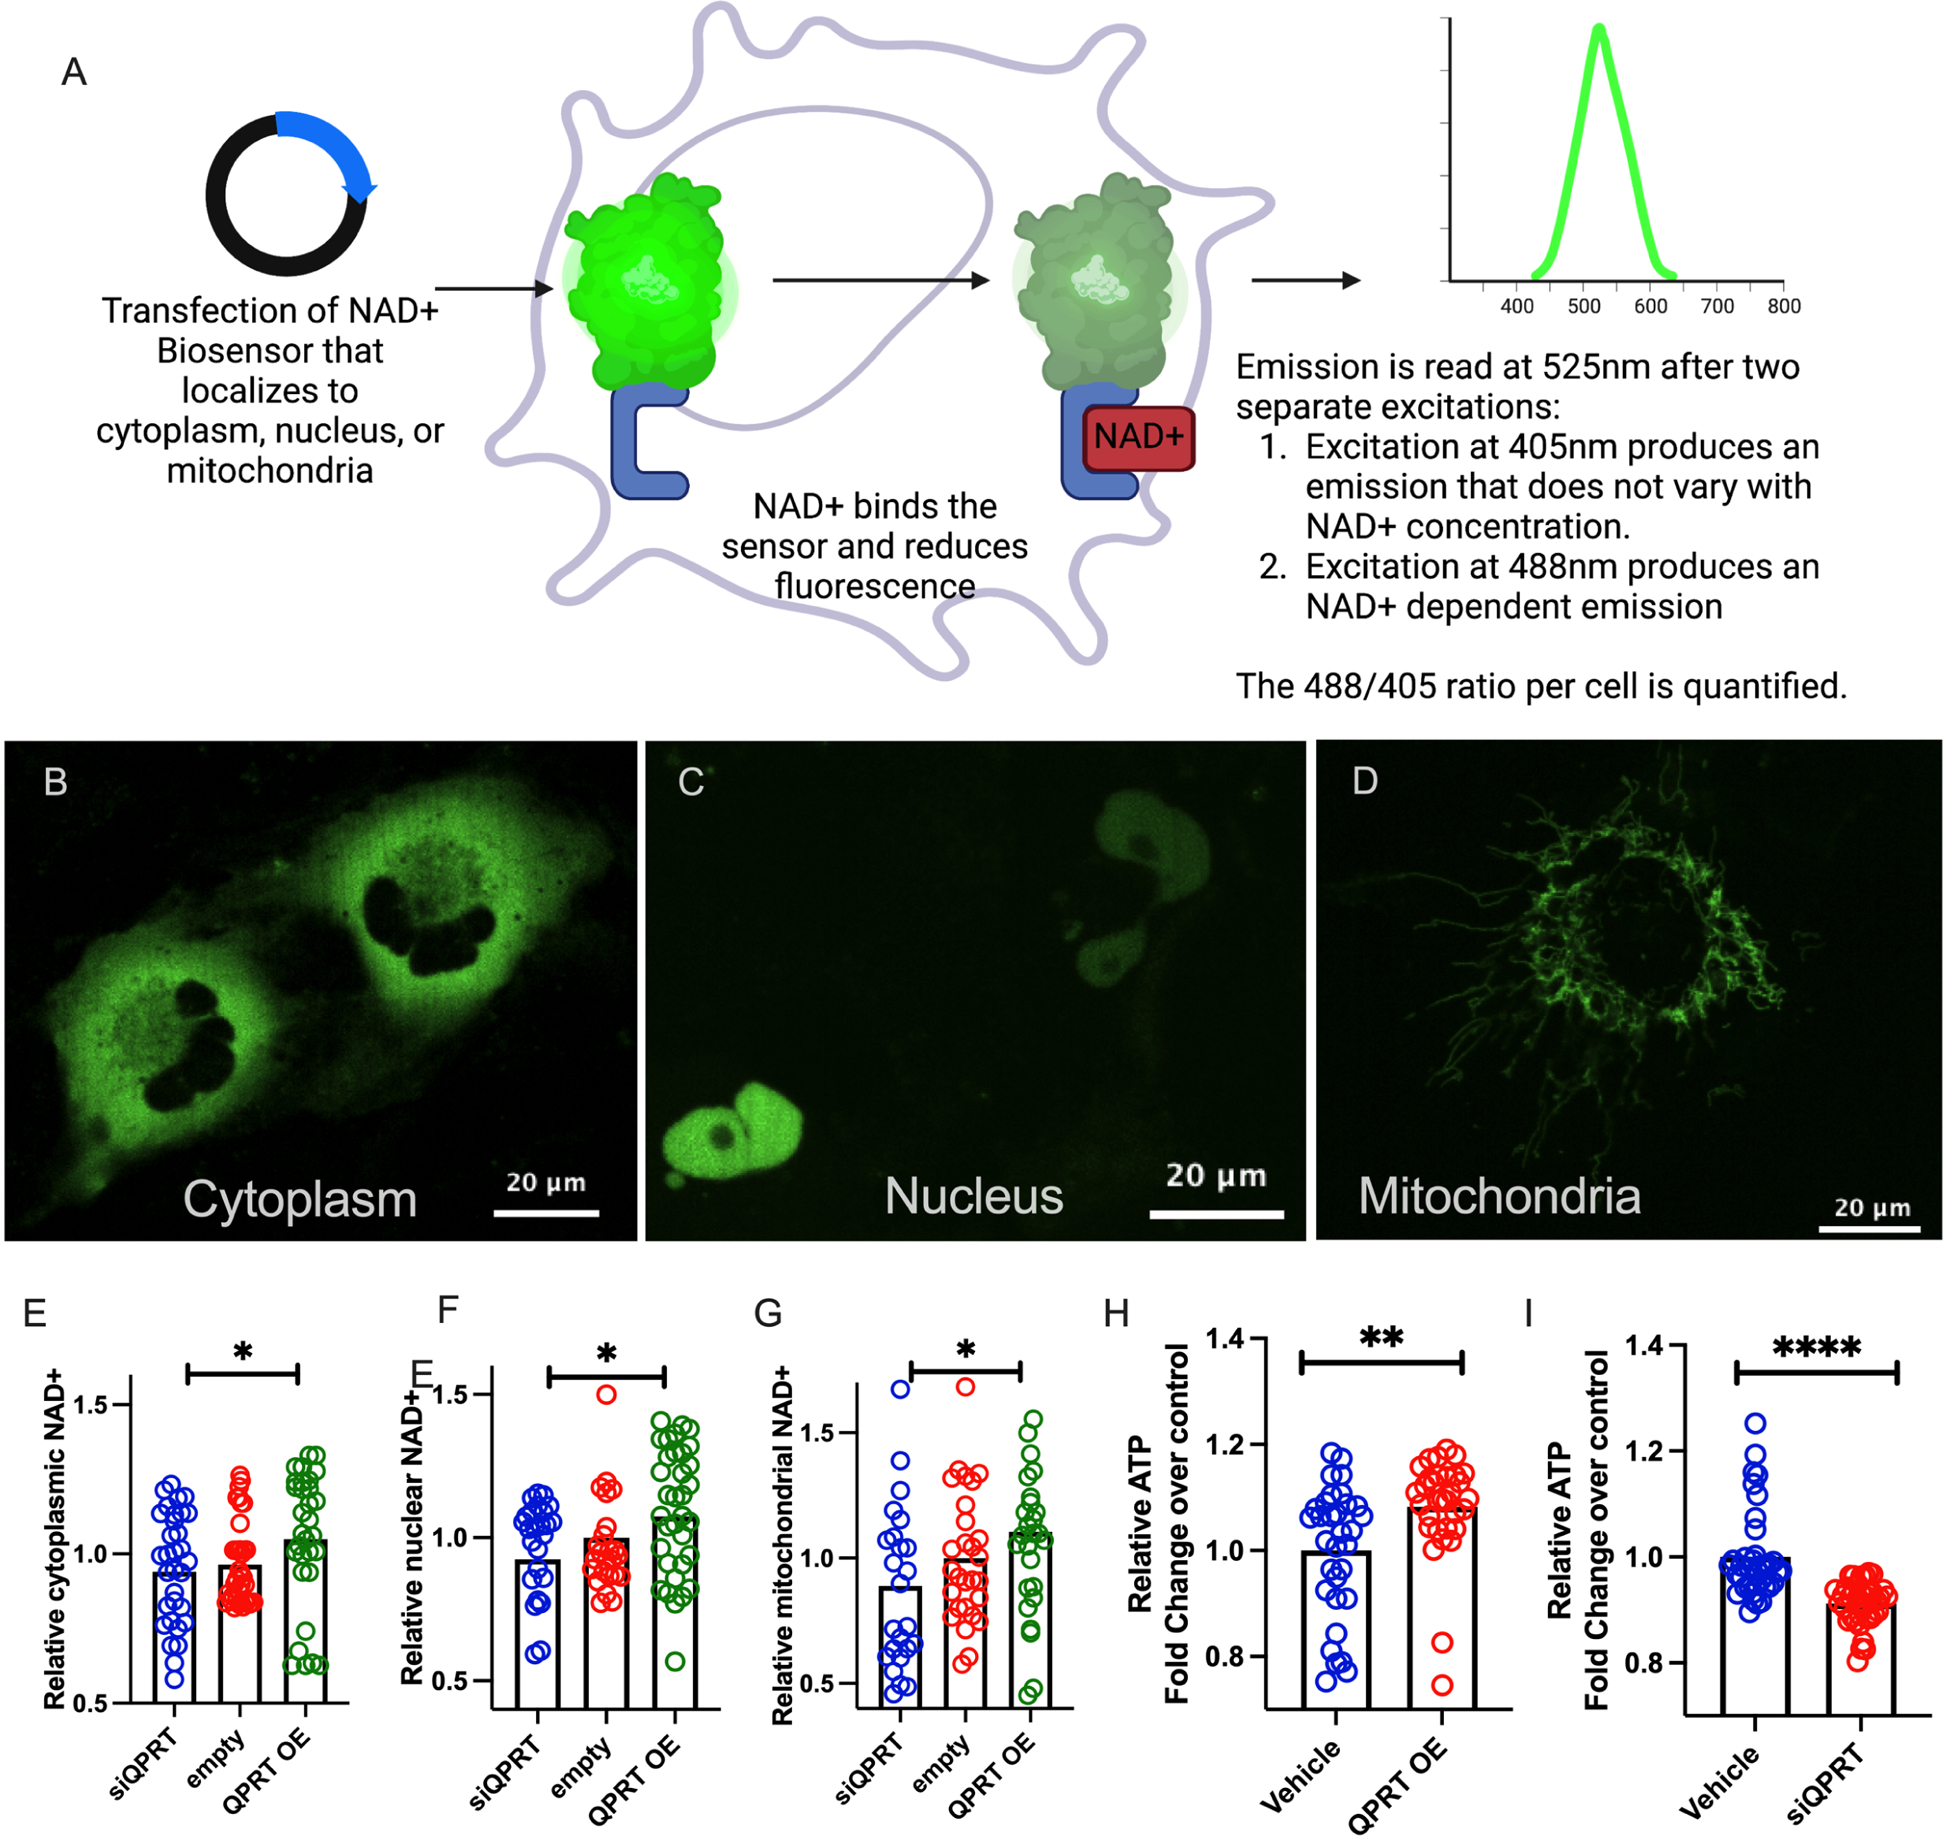
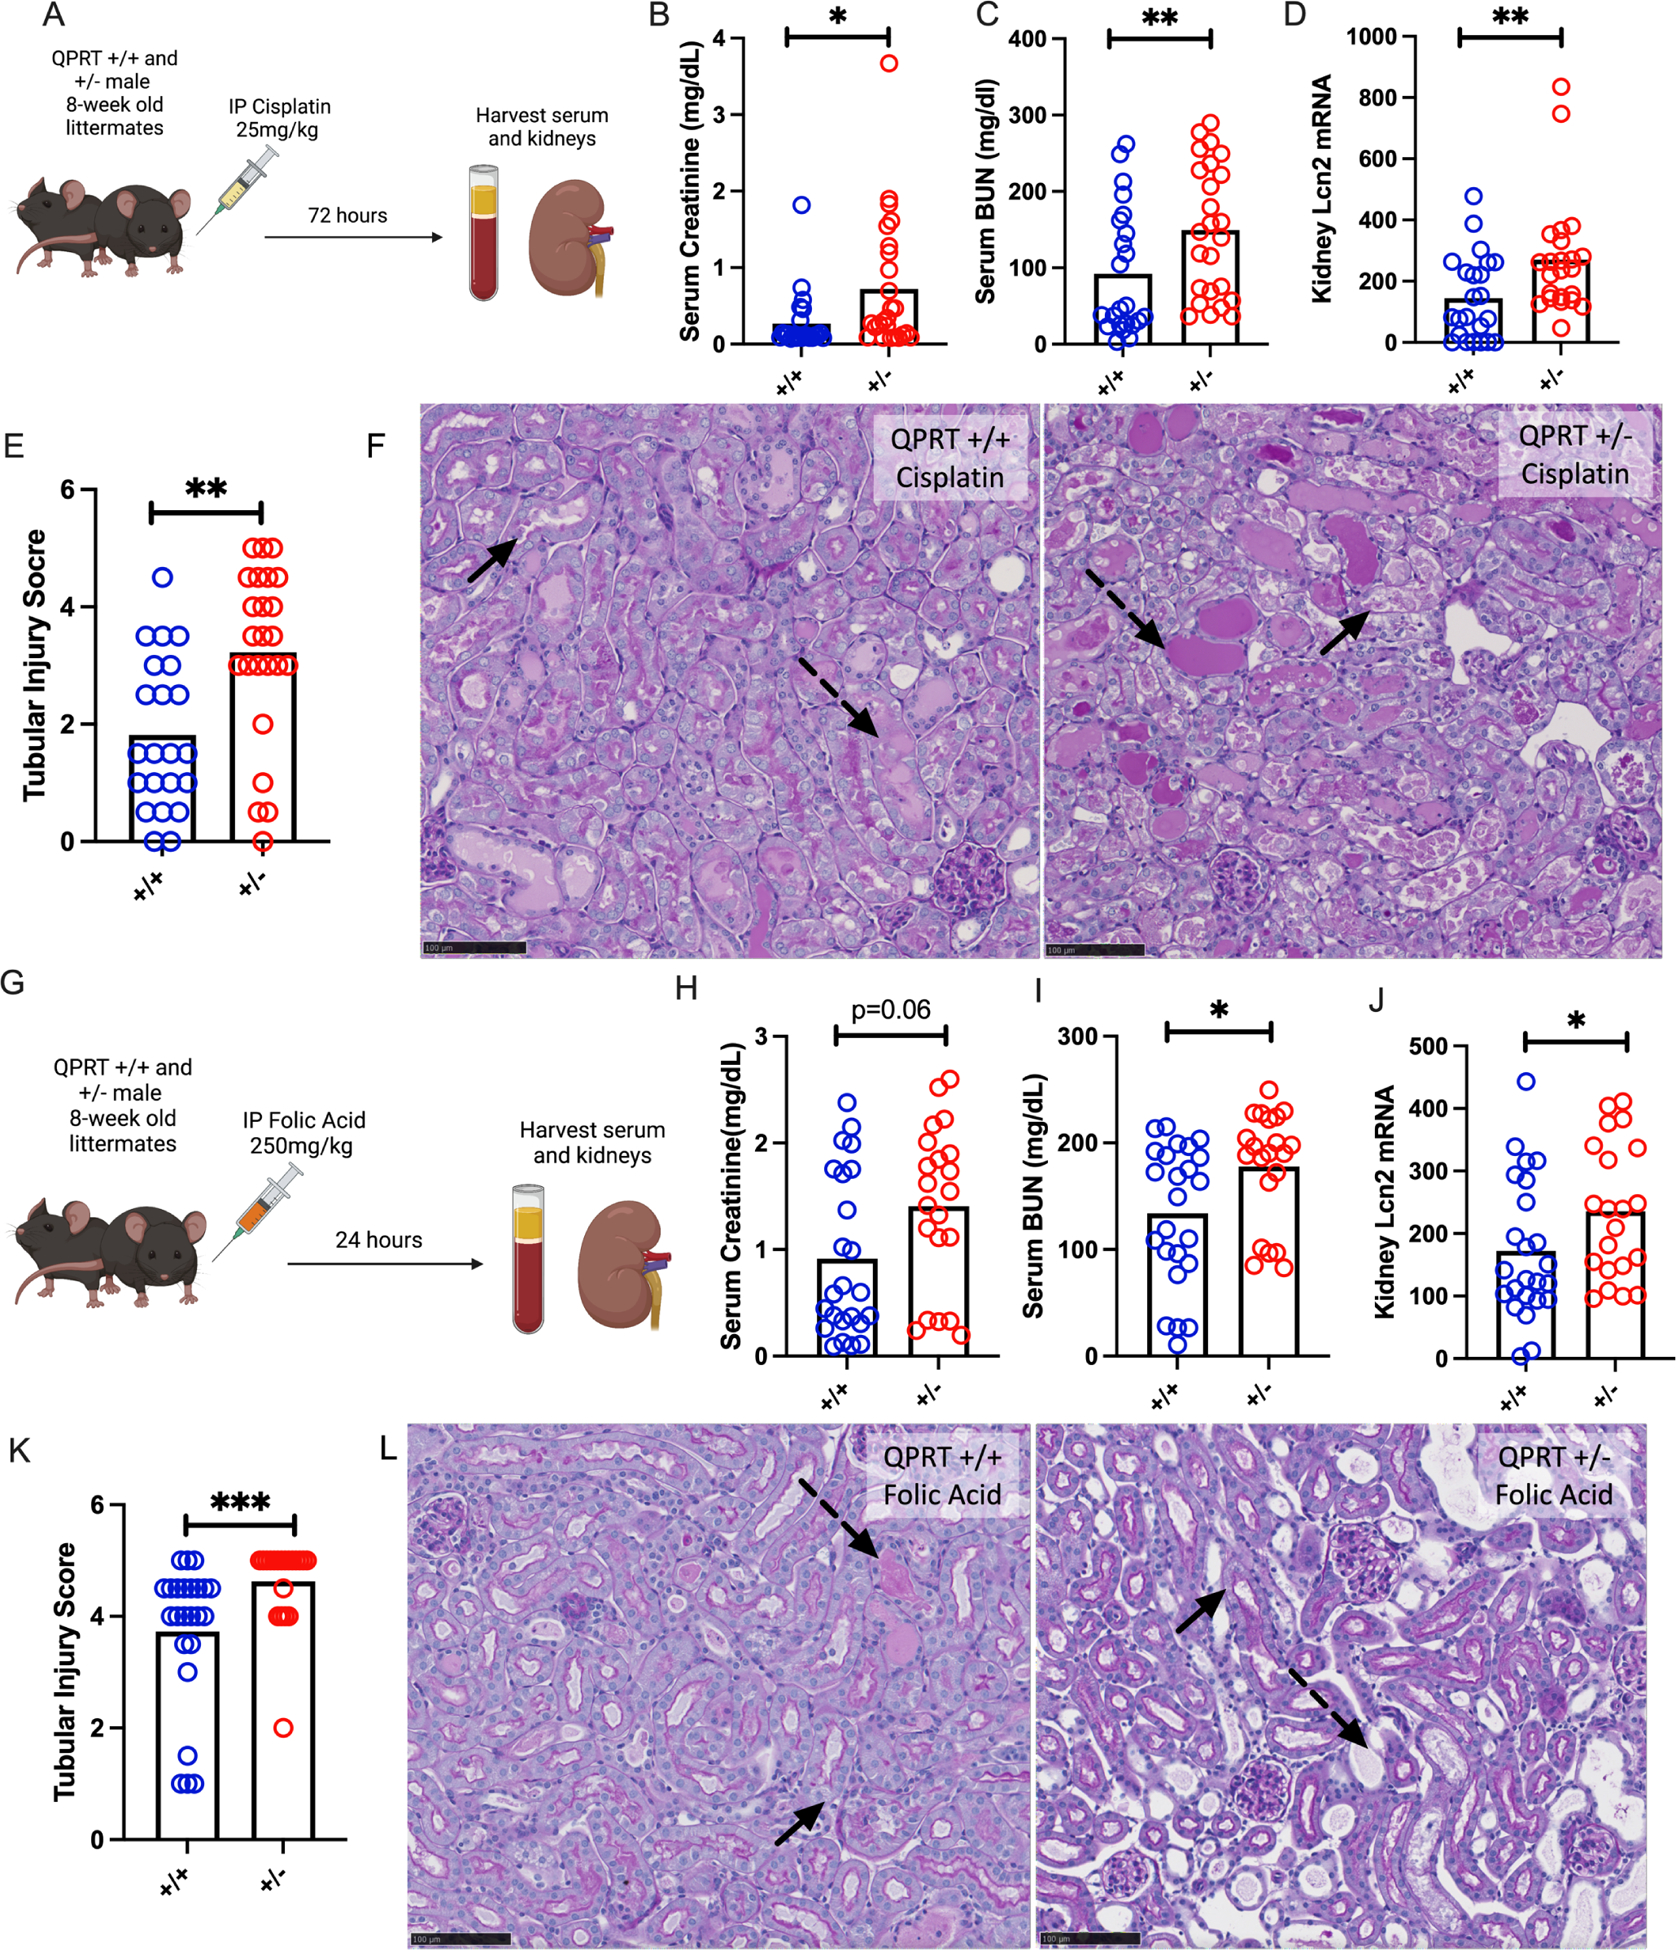
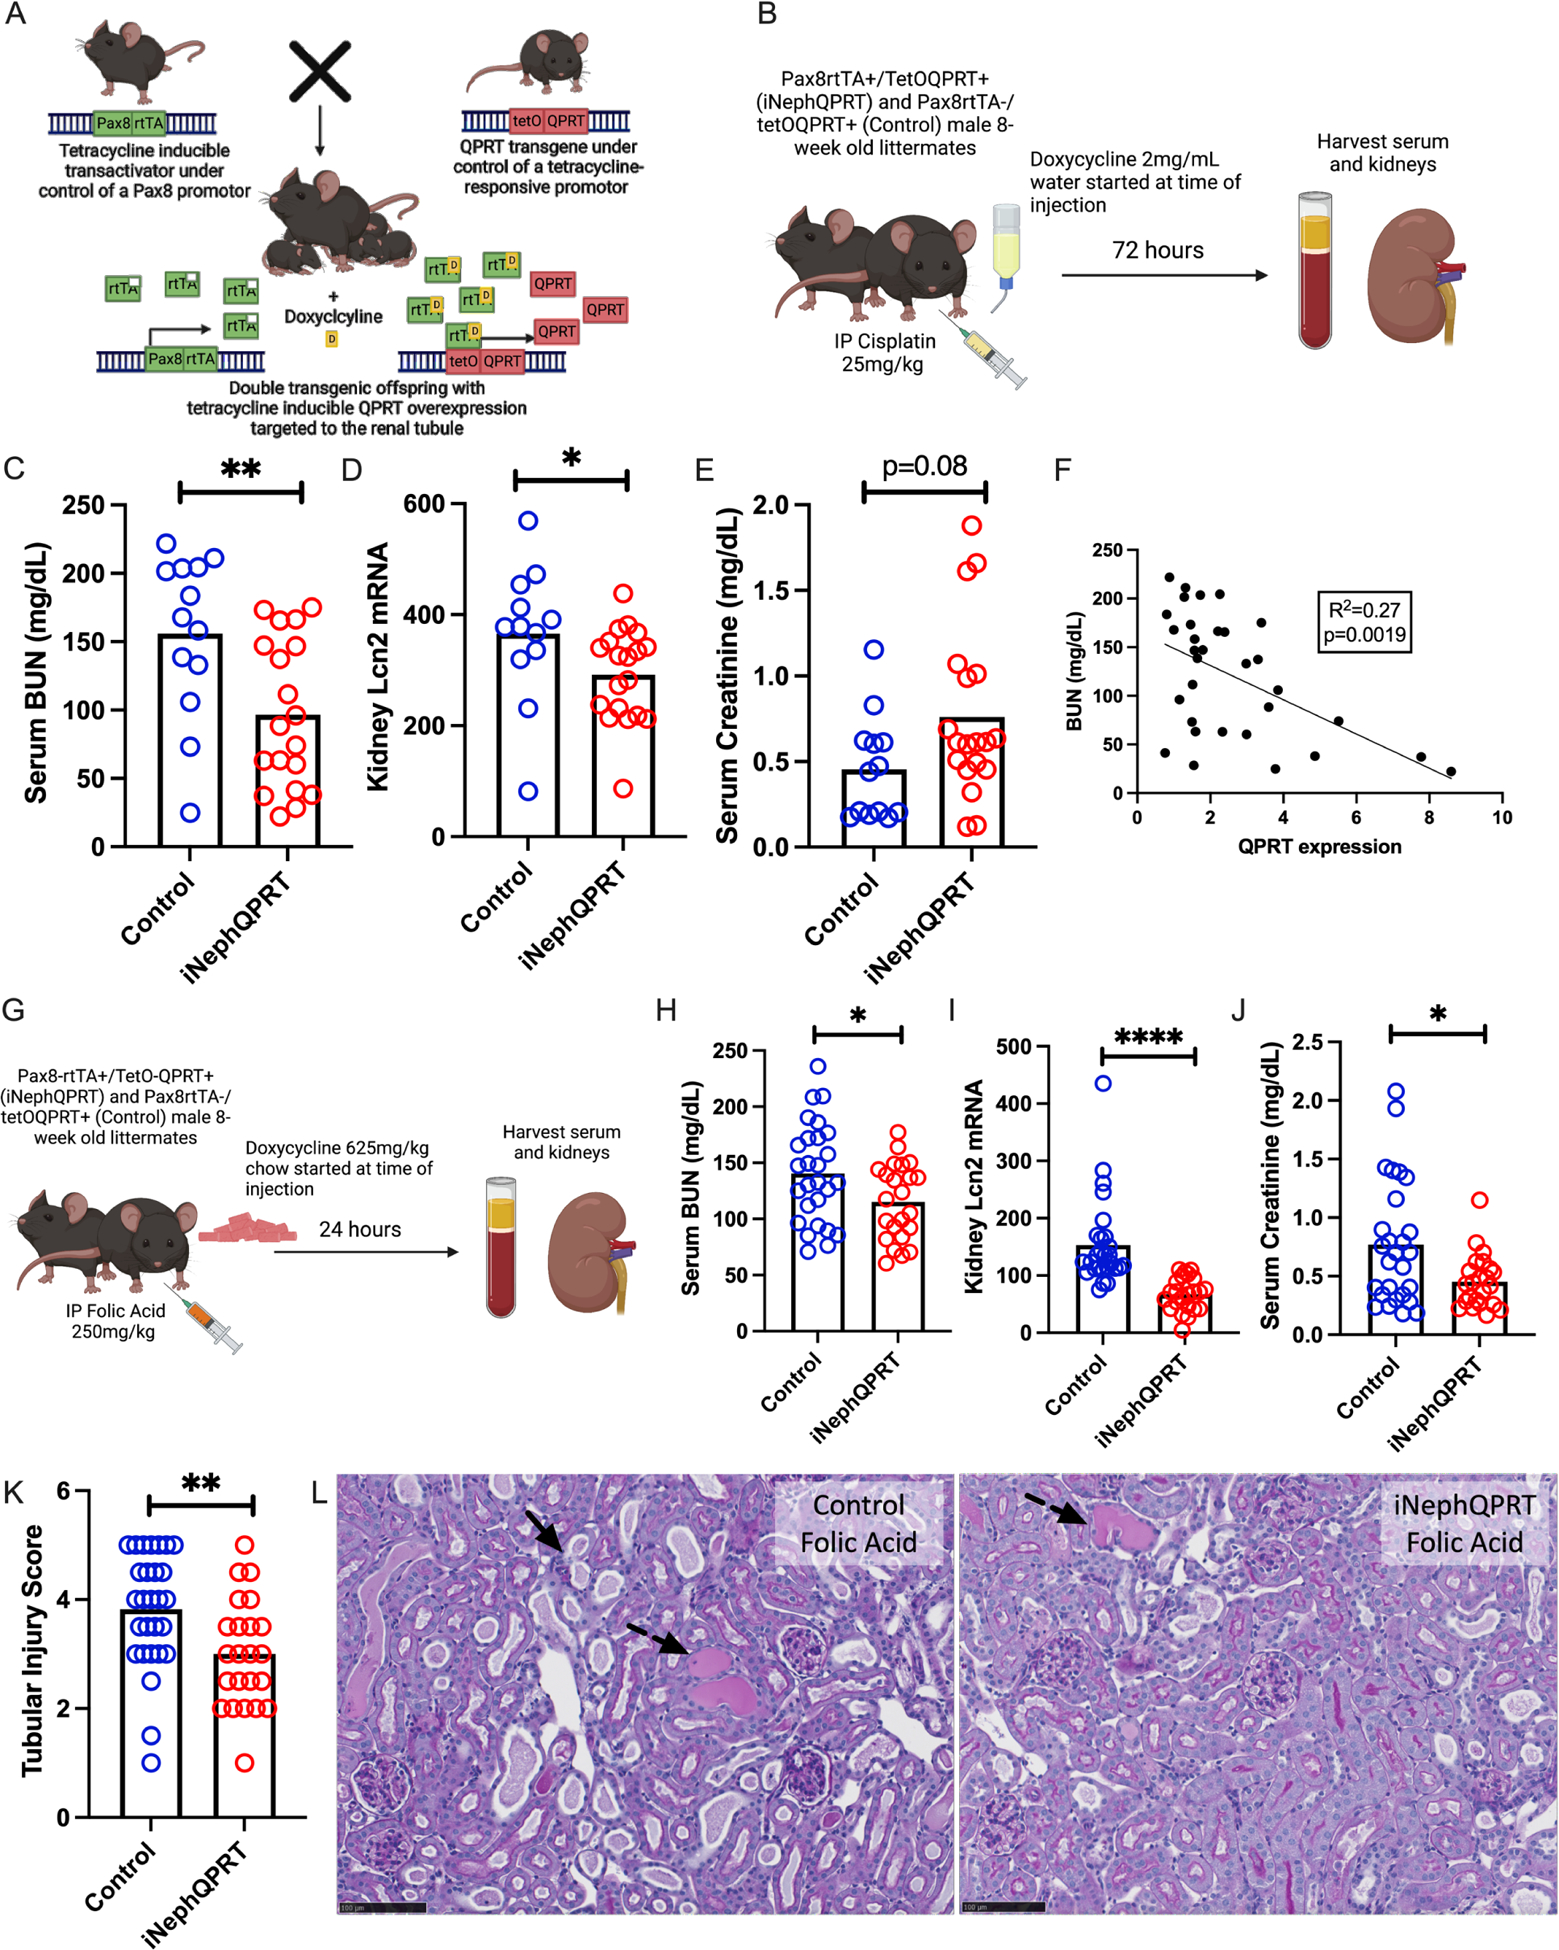
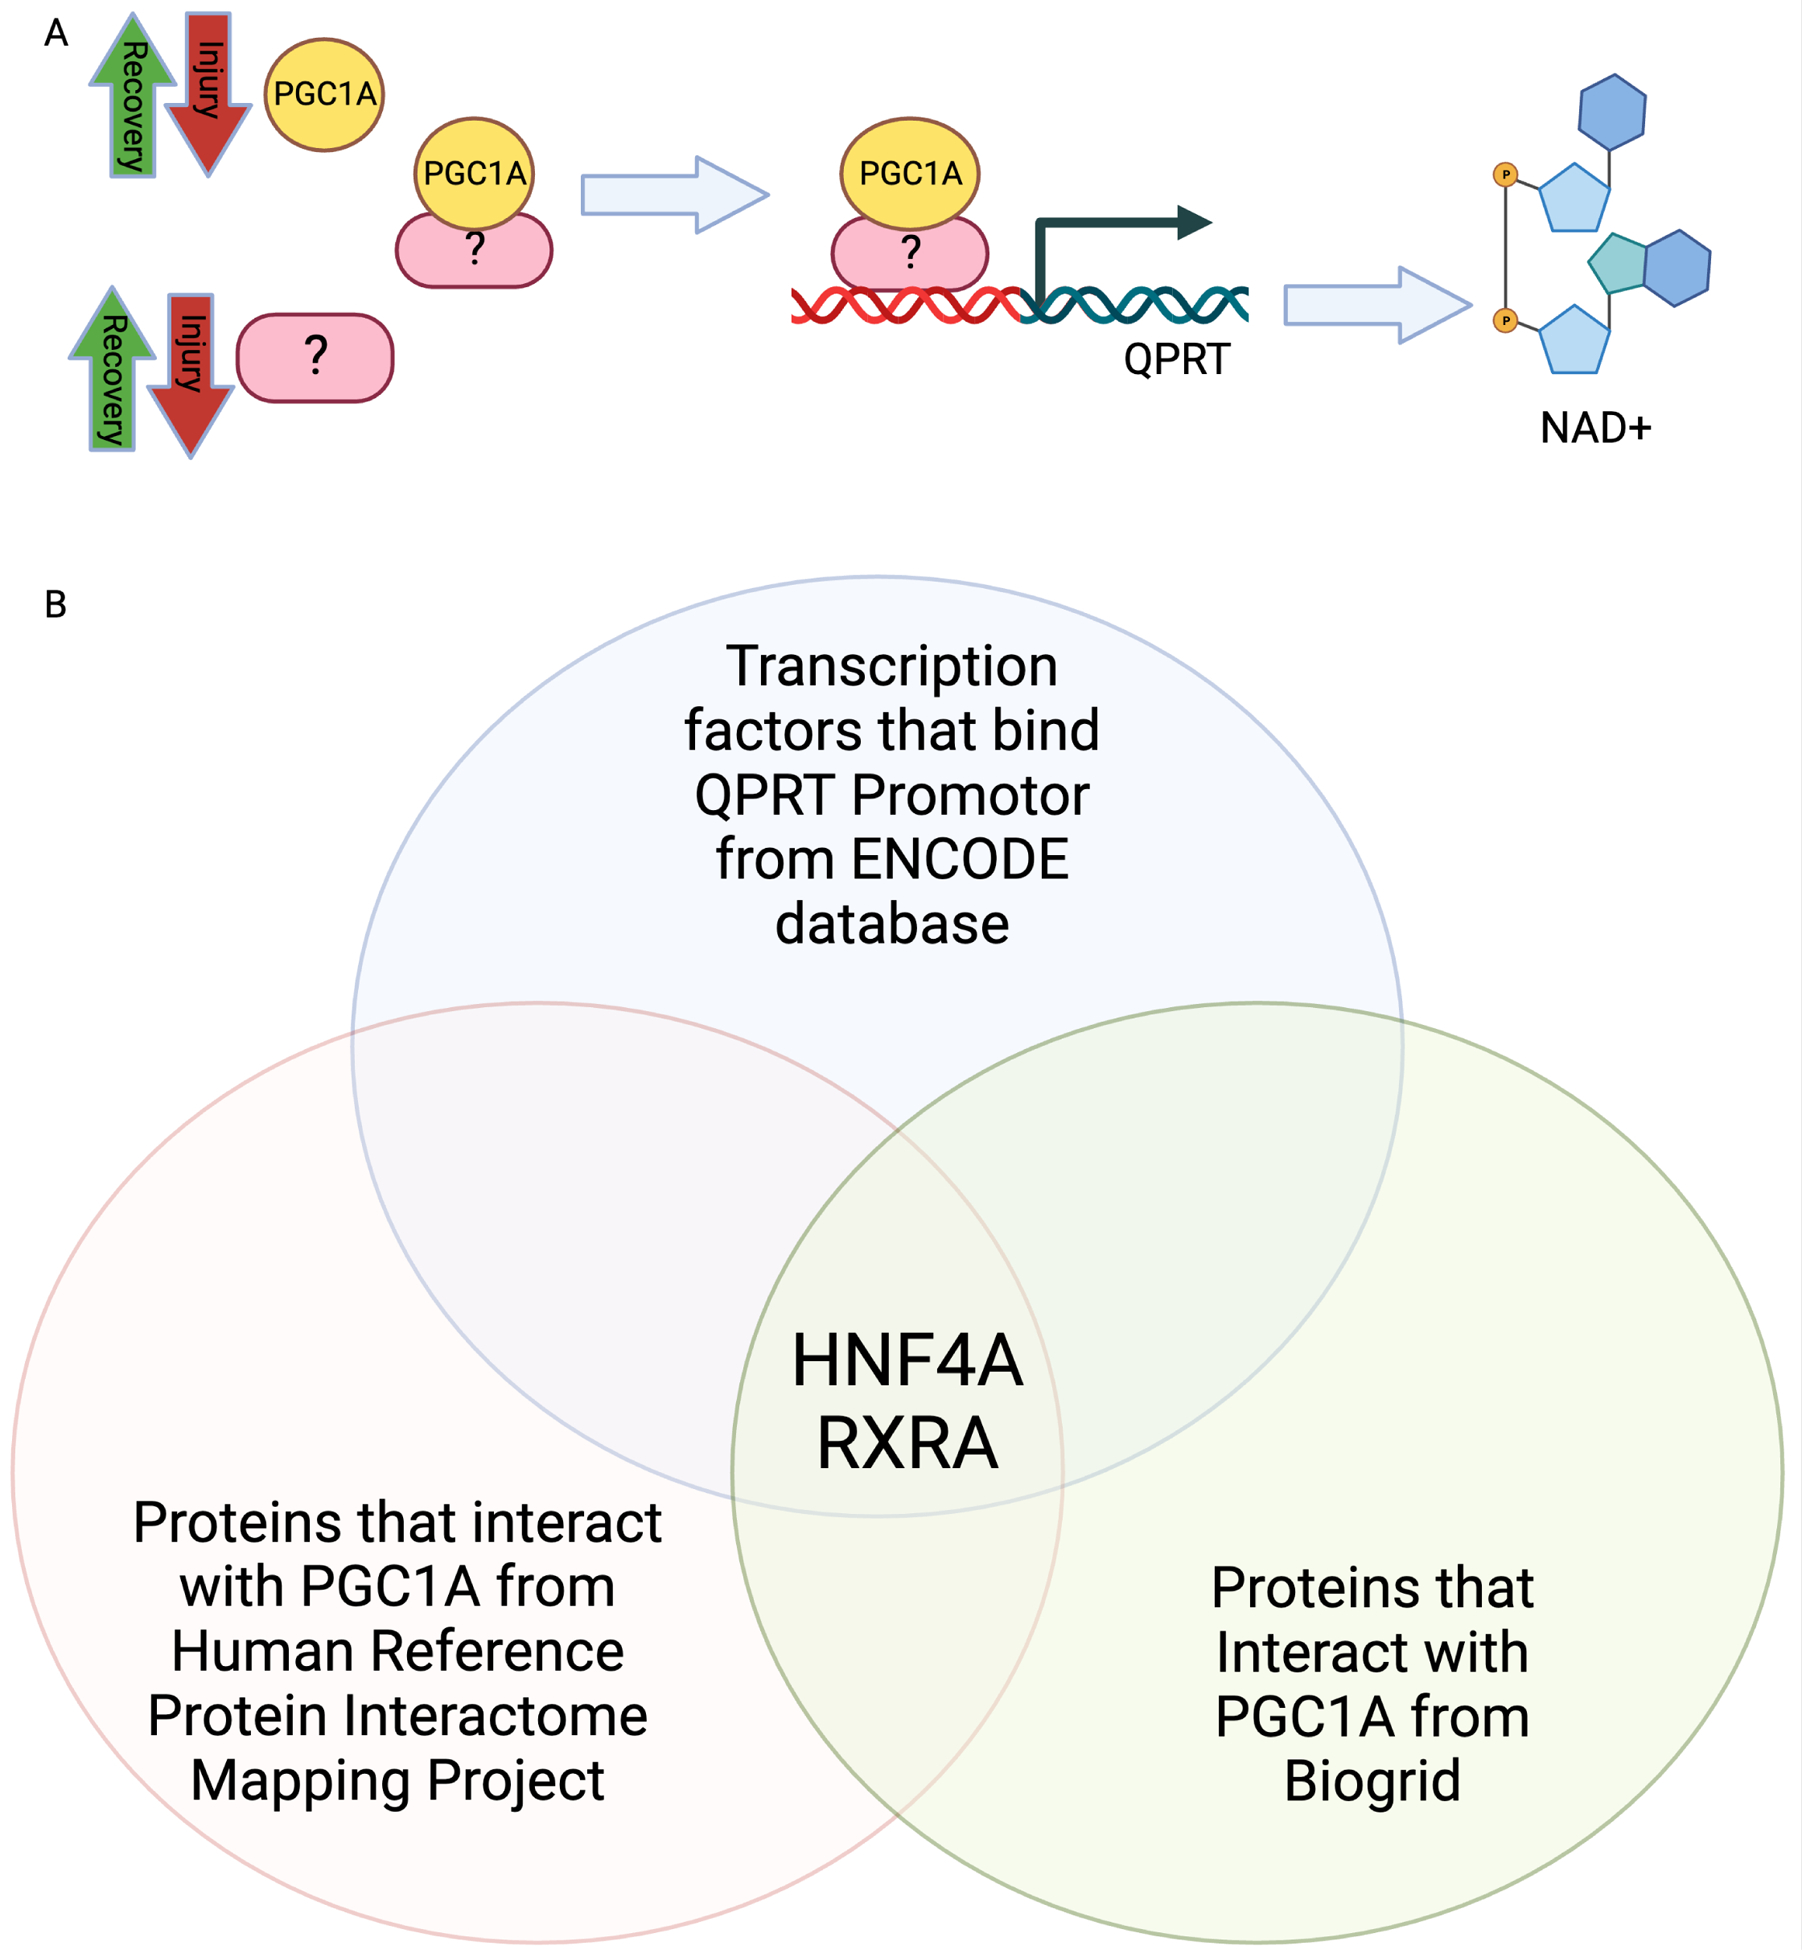
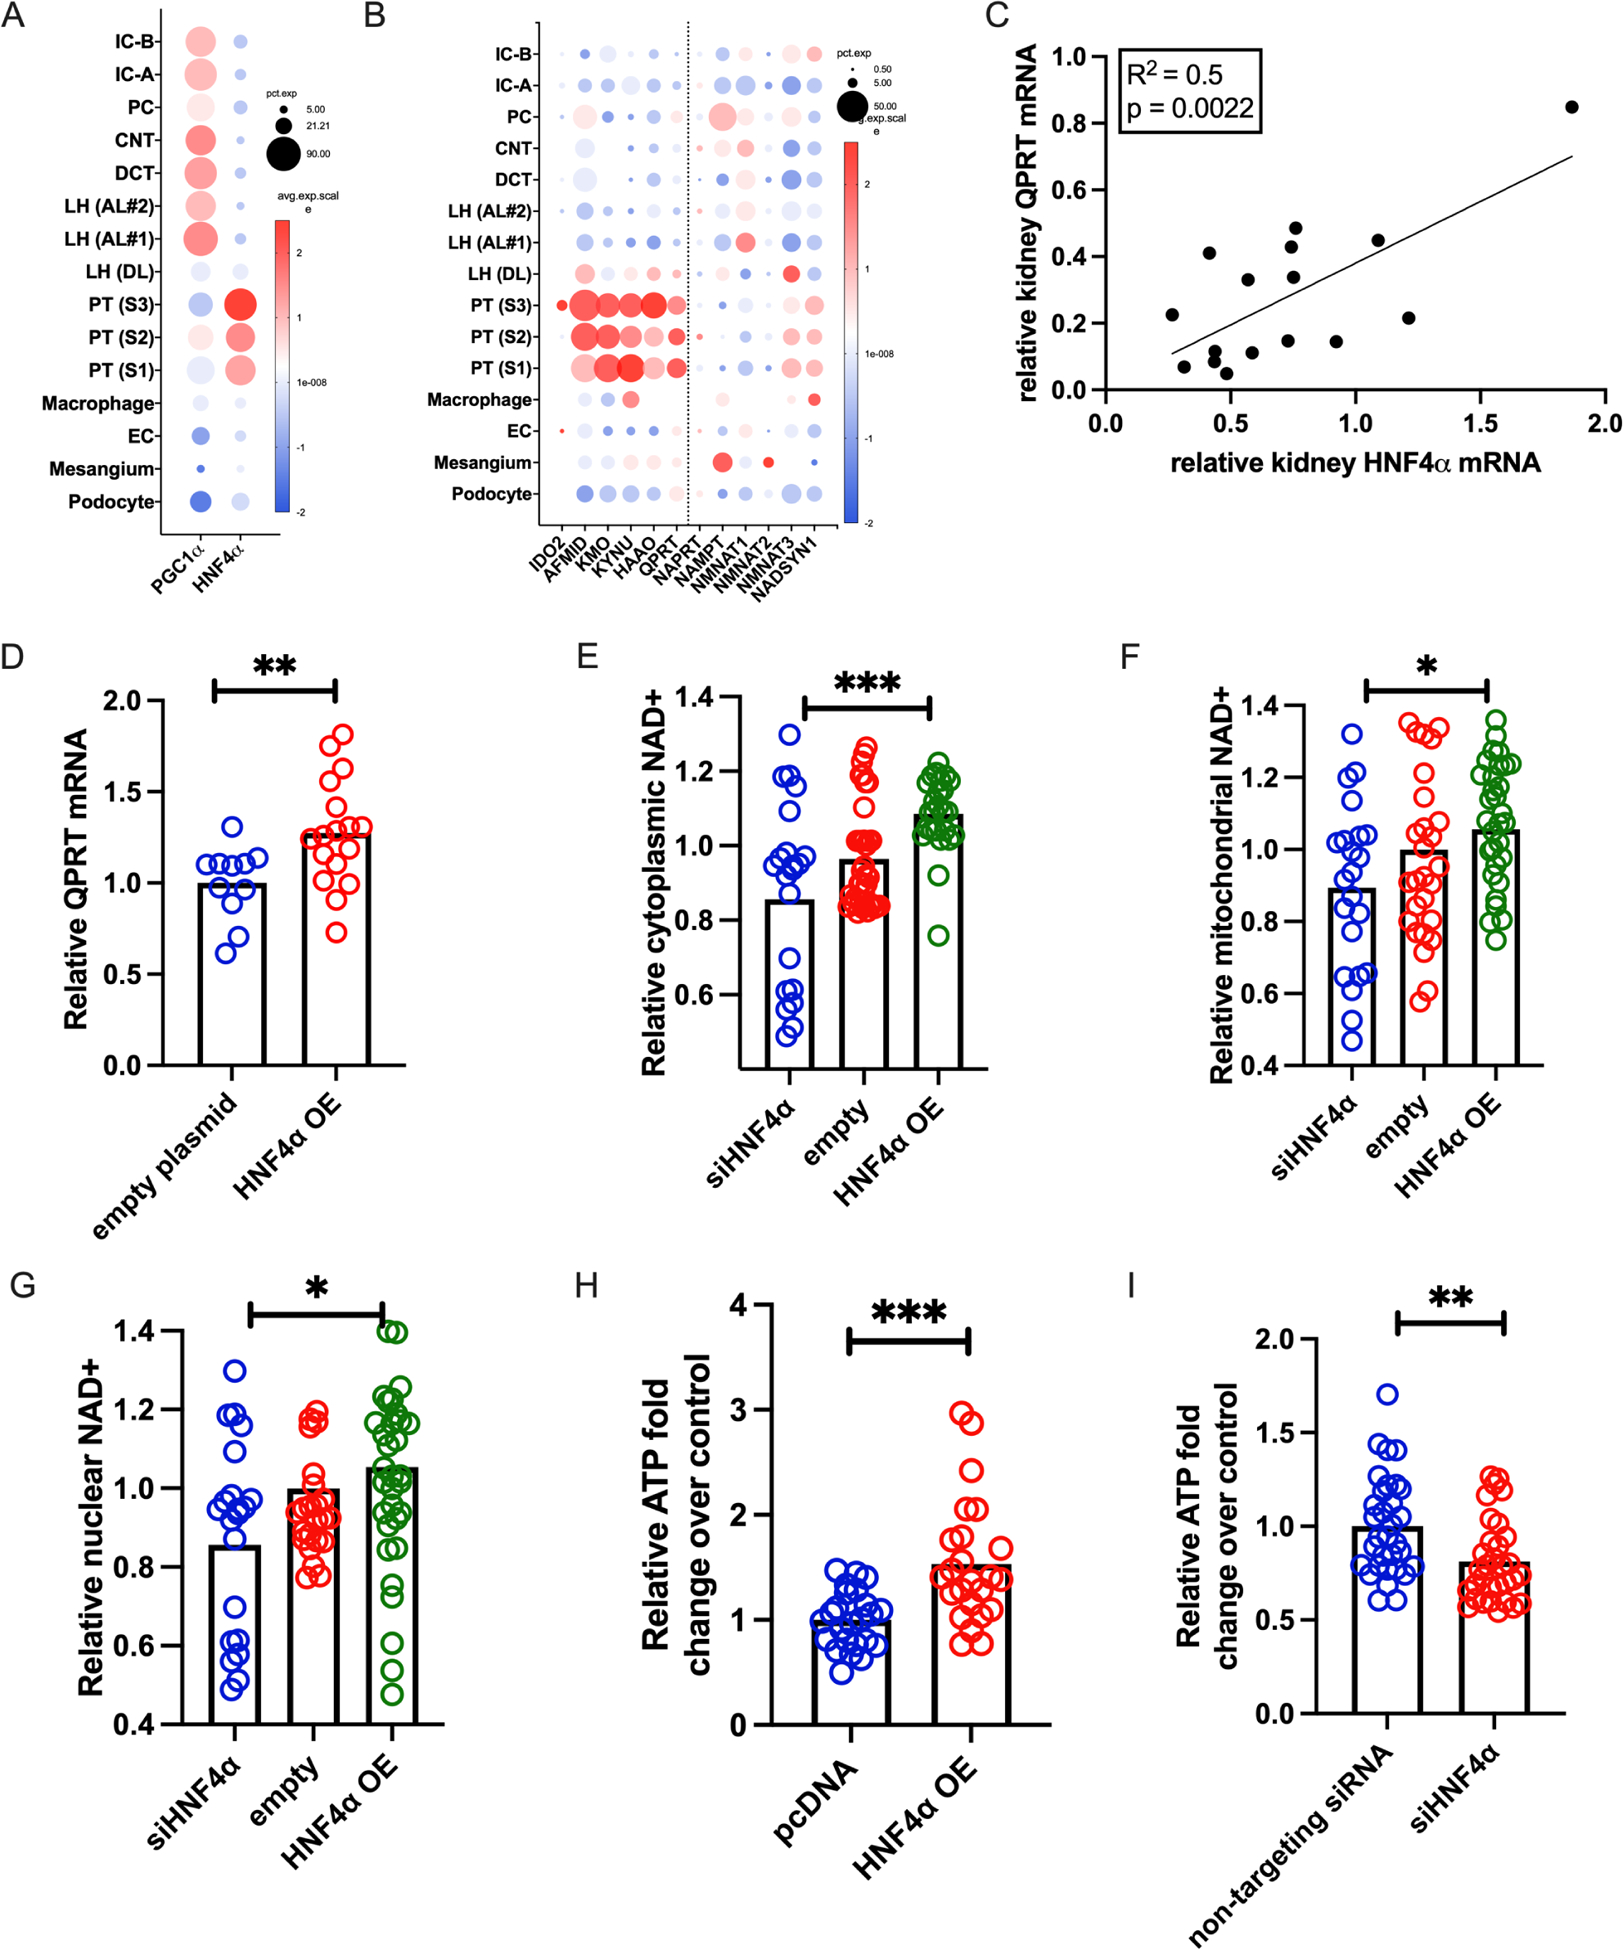
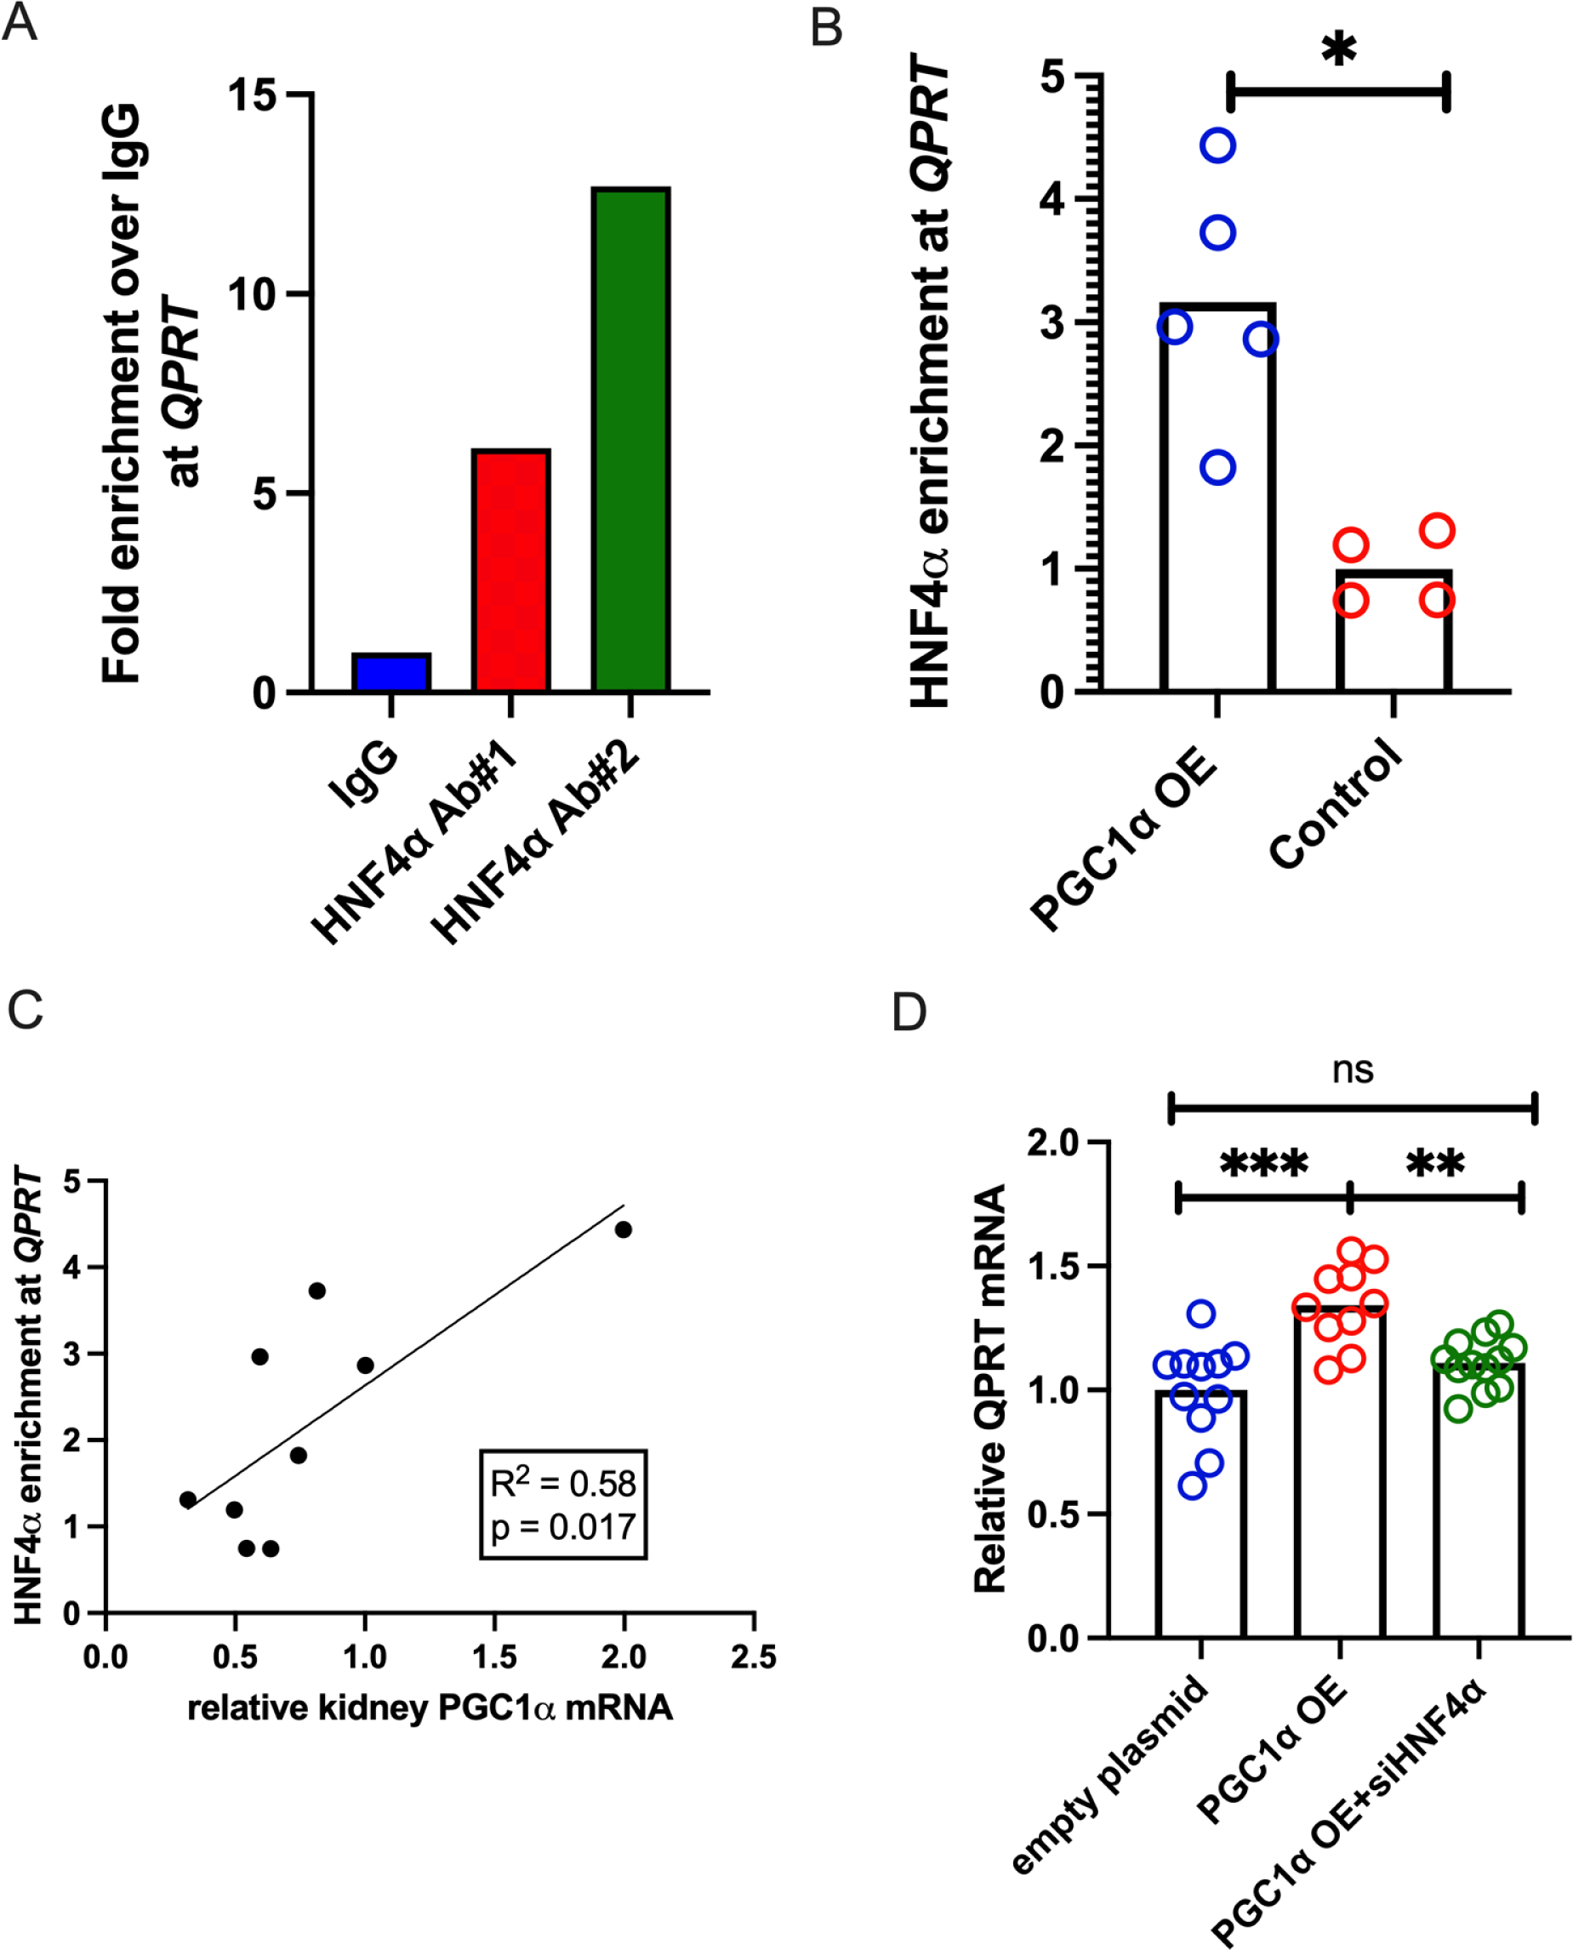
Nicotinamide adenine dinucleotide (NAD+) levels decline in experimental models of acute kidney injury (AKI). Attenuated enzymatic conversion of tryptophan to NAD+ in tubular epithelium may contribute to adverse cellular and physiological outcomes. Mechanisms underlying defense of tryptophan-dependent NAD+ production are incompletely understood. Here we show that regulation of a bottleneck enzyme in this pathway, quinolinate phosphoribosyltransferase (QPRT) may contribute to kidney resilience. Expression of QPRT declined in two unrelated models of AKI. Haploinsufficient mice developed worse outcomes compared to littermate controls whereas novel, conditional gain-of-function mice were protected from injury. Applying these findings, we then identified hepatocyte nuclear factor 4 alpha (HNF4α) as a candidate transcription factor regulating QPRT expression downstream of the mitochondrial biogenesis regulator and NAD+ biosynthesis inducer PPARgamma coactivator-1-alpha (PGC1α). This was verified by chromatin immunoprecipitation. A PGC1α - HNF4α -QPRT axis controlled NAD+ levels across cellular compartments and modulated cellular ATP. These results propose that tryptophan-dependent NAD+ biosynthesis via QPRT and induced by HNF4α may be a critical determinant of kidney resilience to noxious stressors.
Keywords: HNF4α; NAD; acute kidney injury; metabolism.
Copyright © 2023 International Society of Nephrology. Published by Elsevier Inc. All rights reserved.
Conflict of interest statement
DISCLOSURE STATEMENT
SMP receives consulting fees from Janssen, Pfizer, Astellas, Merck, Boehringer Ingelheim, Astra Zeneca, Maze Therapeutics, and Entrada Therapeutics and is on the scientific advisory boards of Cytokinetics, Mission Therapeutics, NovMetaPharma, and DaVita. KZN previously received consulting fees and served on the advisory board for Calliditas Therapeutics US Inc.
Figures
Similar articles
-
De novo NAD+ biosynthetic impairment in acute kidney injury in humans.Nat Med. 2018 Sep;24(9):1351-1359. doi: 10.1038/s41591-018-0138-z. Epub 2018 Aug 20. Nat Med. 2018. PMID: 30127395 Free PMC article. Clinical Trial.
-
Cell stress response impairs de novo NAD+ biosynthesis in the kidney.JCI Insight. 2022 Jan 11;7(1):e153019. doi: 10.1172/jci.insight.153019. JCI Insight. 2022. PMID: 34793337 Free PMC article.
-
PPARγ-Coactivator-1α, Nicotinamide Adenine Dinucleotide and Renal Stress Resistance.Nephron. 2017;137(4):253-255. doi: 10.1159/000471895. Epub 2017 Jun 8. Nephron. 2017. PMID: 28591759 Free PMC article. Review.
-
PGC1α drives NAD biosynthesis linking oxidative metabolism to renal protection.Nature. 2016 Mar 24;531(7595):528-32. doi: 10.1038/nature17184. Epub 2016 Mar 16. Nature. 2016. PMID: 26982719 Free PMC article.
-
Metabolic Stress Resistance in Acute Kidney Injury: Evidence for a PPAR-Gamma-Coactivator-1 Alpha-Nicotinamide Adenine Dinucleotide Pathway.Nephron. 2019;143(3):184-187. doi: 10.1159/000500168. Epub 2019 May 3. Nephron. 2019. PMID: 31055583 Free PMC article. Review.
Cited by
-
Pediatric acute kidney injury is associated with impairment in nicotinamide adenine dinucleotide (NAD+) metabolism.Pediatr Nephrol. 2025 Sep;40(9):2967-2972. doi: 10.1007/s00467-025-06791-5. Epub 2025 May 12. Pediatr Nephrol. 2025. PMID: 40353859
-
Quinolinic acid potentially links kidney injury to brain toxicity.JCI Insight. 2025 Feb 13;10(6):e180229. doi: 10.1172/jci.insight.180229. JCI Insight. 2025. PMID: 39946208 Free PMC article.
-
A Metabolomics Approach to Identify Metabolites Associated With Mortality in Patients Receiving Maintenance Hemodialysis.Kidney Int Rep. 2024 Jun 29;9(9):2718-2726. doi: 10.1016/j.ekir.2024.06.039. eCollection 2024 Sep. Kidney Int Rep. 2024. PMID: 39291216 Free PMC article.
-
NAD+ metabolism in acute kidney injury and chronic kidney disease transition.Trends Mol Med. 2025 Jul;31(7):669-681. doi: 10.1016/j.molmed.2024.12.004. Epub 2025 Jan 4. Trends Mol Med. 2025. PMID: 39757045 Review.
-
Ultrasound-guided renal subcapsular transplantation of mesenchymal stem cells for treatment of acute kidney injury in a minipig model: safety and efficacy evaluation.Stem Cell Res Ther. 2025 Feb 28;16(1):102. doi: 10.1186/s13287-025-04137-4. Stem Cell Res Ther. 2025. PMID: 40022148 Free PMC article.
References
Publication types
MeSH terms
Substances
Grants and funding
LinkOut - more resources
Full Text Sources
Molecular Biology Databases
