. 2023 Oct 2;14(1):6140.
doi: 10.1038/s41467-023-41801-w.

Interferon restores replication fork stability and cell viability in BRCA-defective cells via ISG15

Affiliations

Interferon restores replication fork stability and cell viability in BRCA-defective cells via ISG15

Ramona N Moro et al. Nat Commun. .

Abstract

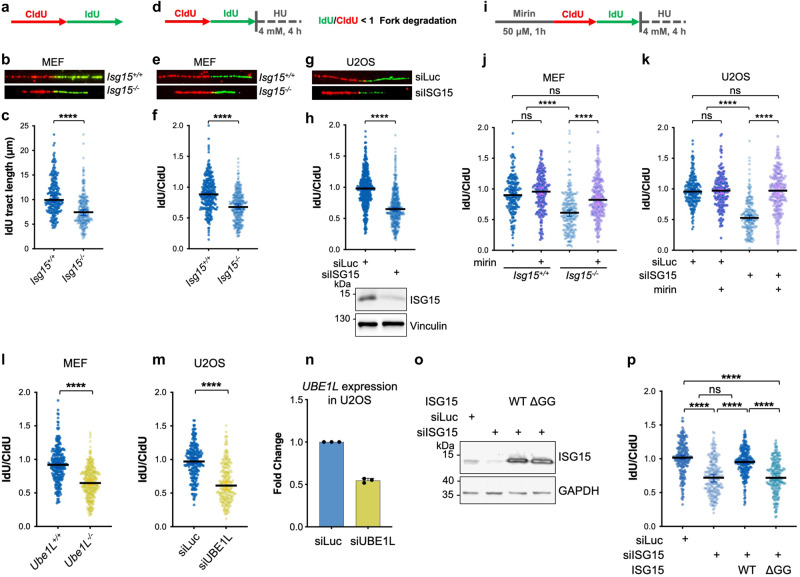
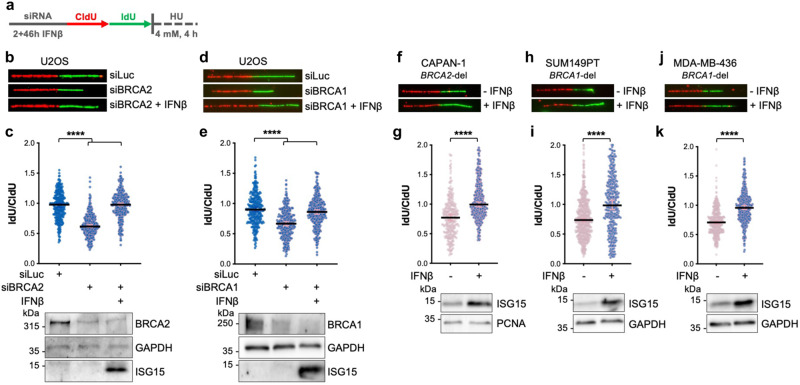
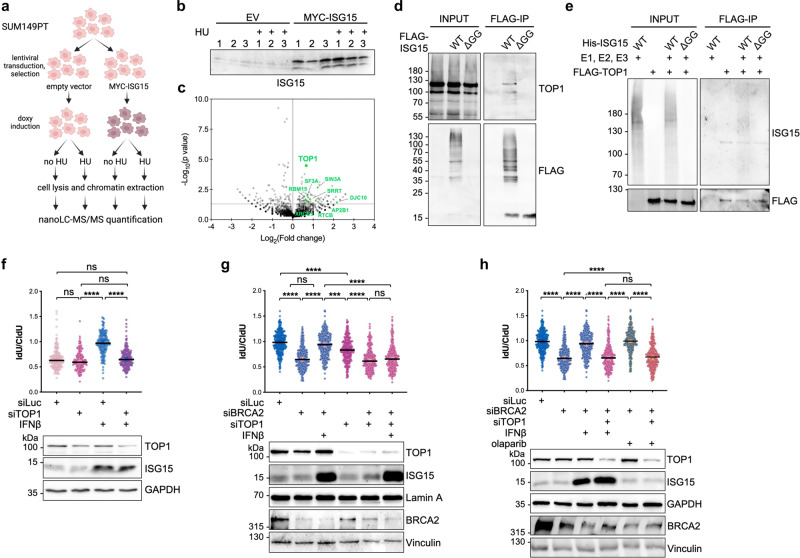
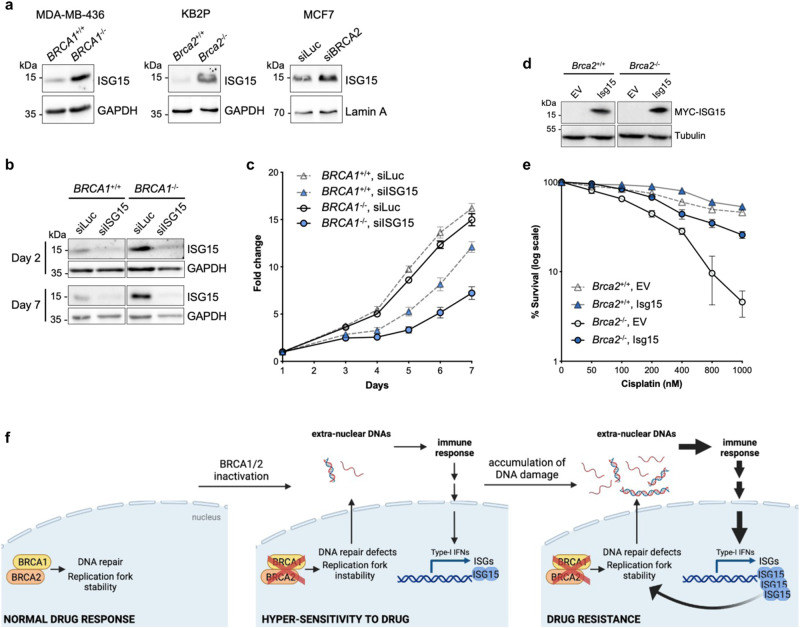
DNA replication and repair defects or genotoxic treatments trigger interferon (IFN)-mediated inflammatory responses. However, whether and how IFN signaling in turn impacts the DNA replication process has remained elusive. Here we show that basal levels of the IFN-stimulated gene 15, ISG15, and its conjugation (ISGylation) are essential to protect nascent DNA from degradation. Moreover, IFNβ treatment restores replication fork stability in BRCA1/2-deficient cells, which strictly depends on topoisomerase-1, and rescues lethality of BRCA2-deficient mouse embryonic stem cells. Although IFNβ activates hundreds of genes, these effects are specifically mediated by ISG15 and ISGylation, as their inactivation suppresses the impact of IFNβ on DNA replication. ISG15 depletion significantly reduces cell proliferation rates in human BRCA1-mutated triple-negative, whereas its upregulation results in increased resistance to the chemotherapeutic drug cisplatin in mouse BRCA2-deficient breast cancer cells, respectively. Accordingly, cells carrying BRCA1/2 defects consistently show increased ISG15 levels, which we propose as an in-built mechanism of drug resistance linked to BRCAness.


Conflict of interest statement

The authors declare no competing interests.

Figures

Fig. 1
Fig. 1. Loss of ISG15 and UBE1L results in DNA replication fork instability.
ac Experimental workflow, representative images and size distribution of IdU tract lengths in Isg15+/+ and Isg15-/- MEFs from three independent experiments (Isg15+/+ n = 241 and Isg15-/- n = 244). d Schematic diagram of DNA replication fork degradation assay. eh Representative images of fibers and IdU/CldU ratio analysis for the indicated conditions. In (f, h), fibers were analyzed in three and four independent experiments, respectively (Isg15+/+ n = 288, Isg15-/- n = 315, siLuc n = 435 and siISG15 n = 440). Western blotting reveals the ISG15 expression. Vinculin immunoblot is used as loading control. ik Experimental workflow and IdU/CldU ratio analysis from two independent experiments in MEFs (Isg15+/+ n = 205, Isg15+/+ +mirin n = 202, Isg15-/- n = 232, Isg15-/- +mirin n = 240), and U2OS cells (siLuc n = 203, siLuc +mirin n = 202, siISG15 n = 203 and siISG15 +mirin n = 203). l, m IdU/CldU ratio analysis from three independent experiments in MEFs (Ube1L+/+ n = 265, Ube1L-/- n = 304) and U2OS cells (siLuc n = 233, siUBE1L n = 228). n UBE1L mRNA expression in U2OS cells upon indicated siRNA treatment measured by qPCR (n = 3) corresponding to (m). Data are represented as mean + SD. o U2OS Flp-In T-REx cells expressing His-tagged ISG15, ISG15-ΔGG or the empty vector (EV), after doxycycline induction (1 μg/mL, 48 h) and optional treatment with siISG15. Immunoblot shows ISG15 protein levels and the loading control (GAPDH). p IdU/CldU ratio as in (o) from two independent experiments (EV siLuc n = 220, EV siISG15 n = 222, WT siISG15 n = 217 and ΔGG siISG15 n = 200). c, f, h, l, m Median value with 95% confidence interval (CI) is shown. Two-tailed Mann–Whitney test was performed; ****P < 0.0001. j, k, p Median value with 95% CI is shown. Two-tailed Kruskal–Wallis test was performed; ****P < 0.0001. Source data are provided as a Source data file.
Fig. 2
Fig. 2. IFNβ treatment promotes DNA replication fork protection in BRCA1/2 depleted cells.
a Schematic diagram of DNA replication fork degradation assay. b, c Representative images of fibers and IdU/CldU ratio analysis for the indicated conditions. Fibers were analyzed in three independent experiments (siLuc n = 308, siBRCA2 n = 307 and siBRCA2 +IFNβ n = 311). Vinculin shows equal loading and ISG15 induction reveals activation of IFNβ pathway. d, e Representative images of fibers, IdU/CldU ratio analysis and BRCA1 and ISG15 protein expression for the indicated conditions. Fibers were analyzed in three independent experiments (siLuc n = 303, siBRCA1 n = 315 and siBRCA1 +IFNβ n = 336). fk Representative images of fibers and IdU/CldU ratio analysis in CAPAN-1, SUM149PT and MDA-MB-436 cells for the indicated conditions along with ISG15 protein expression. Fibers were analyzed in three independent experiments (CAPAN-1: -IFNβ n = 335 and +IFNβ n = 366; SUM149PT: -IFNβ n = 629 and +IFNβ n = 319; MDA-MB-436: -IFNβ n = 447 and +IFNβ n = 409) The lower panels show ISG15 expression along with the loading controls. c, e Median value with 95% confidence interval (CI) is shown. Two-tailed Kruskal–Wallis test was performed; ****P < 0.0001. g, i, k Median value with 95% CI is shown. Two-tailed Mann–Whitney test was performed; ****P < 0.0001. Source data are provided as a Source data file.
Fig. 3
Fig. 3. IFNβ and ISG15 restore fork protection in BRCA-deficient cells via ISG15 conjugation.
a IdU/CldU ratio analysis for the indicated conditions along with ISG15 and BRCA2 expression and the loading controls. Fibers were analyzed in two independent experiments (siLuc n = 209, siBRCA2 n = 203, siBRCA2 +IFNβ n = 205 and siISG15 + siBRCA2 +IFNβ n = 218). b IdU/CldU ratio analysis for the indicated conditions. Fibers were analyzed in three independent experiments (Isg15+/+ siLuc n = 287, Isg15+/+ siLuc +IFNβ n = 201, Isg15+/+ siBrca2 n = 292, Isg15+/+ siBrca2 +IFNβ n = 330, Isg15-/- siLuc n = 204, Isg15-/- siLuc +IFNβ n = 204, Isg15-/- siBrca2 n = 313 and Isg15-/- siBrca2 +IFNβ n = 315). c IdU/CldU ratio analysis in in BRCA2 depleted ISG15-/- U2OS Flp-In T-REx cells expressing empty vector (EV) or FLAG-ISG15 along with BRCA2 and ISG15 protein expression and the loading controls. Fibers were analyzed in two independent experiments (EV siBRCA2 n = 200 and ISG15 siBRCA2 n = 221). d IdU/CldU ratio analysis in SUM149PT cells expressing empty vector (EV) or MYC-ISG15 (n = 3) along with MYC-ISG15 protein expression and the loading control. Fibers were analyzed in three independent experiments (EV n = 314 and ISG15 n = 372). e Schematic of the enzymes involved in ISG15 conjugation. f, g IdU/CldU ratio analysis for the indicated conditions. Fibers were analyzed in three independent experiments (Ube1L+/+ siLuc n = 271, Ube1L+/+ siBrca2 n = 277, Ube1L+/+ siBrca2 +IFNβ n = 302, Ube1L-/- siLuc n = 289, Ube1L-/- siLuc +IFNβ n = 277, Ube1L-/- siBrca2 n = 276 and Ube1L-/- siBrca2 +IFNβ n = 275; Trim25+/+ siLuc n = 303, Trim25+/+ siBrca2 n = 303, Trim25+/+ siBrca2 +IFNβ n = 338, Trim25-/- siLuc n = 203, Trim25-/- siLuc +IFNβ n = 201, Trim25-/- siBrca2 n = 290 and Trim25-/- siBrca2 +IFNβ n = 301). a, b, f, g Median value with 95% CI is shown. Two-tailed Kruskal–Wallis test was performed; *P = 0.0267 ****P < 0.0001. c, d Median value with 95% CI is shown. Two-tailed Mann–Whitney test was performed; ****P < 0.0001. Source data are provided as a Source data file.
Fig. 4
Fig. 4. Upregulation of IFNβ/ISG15 restores viability in BRCA2-deficient mESCs.
a Schematic for testing conditions for generation of Brca2-/- in PL2F7 (created with BioRender.com). b ISG15 protein expression in PL2F7 cells after optional treatment with IFNβ (30 U/mL) either for 48 h in continuous or for 2 h pulse and 46 h chase. c, d Percentage of Brca2-/- HAT resistant clones and representative Southern blot showing Brca2flox/- or Brca2-/- mESC upon ± IFNβ pre-treatment as in (b). e, f Ratio of number of rescued clones and total numbers of HAT resistant clones analyzed, and representative Southern blot showing Brca2flox/- or Brca2-/- mESC upon ± IFNβ (30 U/mL, 2 h) pre-treatment along with depletion of ISG15, UBE1L or TRIM25 by siRNA treatment. Source data are provided as a Source data file.
Fig. 5
Fig. 5. TOP1 is required for IFNβ-mediated restoration of replication fork stability in BRCA-defective cells.
a, b Schematic workflow of the mass spectrometry analysis (created with BioRender.com) and immunoblot showing ISG15 protein levels. Three biological replicates were analyzed for each condition. c Volcano plot revealing the distribution of mass spectrometry hits from EV and MYC-ISG15 expressing SUM149PT cells treated with HU. The horizontal axis shows Log2 fold change of protein abundance (EV vs ISG15). The vertical axis shows −Log10 of the Fisher’s exact test P value. Points with a Log2(Fold change) >0 indicate proteins that are enriched in cells expressing MYC-ISG15. The horizontal gray line represents the p-value threshold at 0.05. Points below this line (P > 0.05) indicate proteins that do not meet the statistical significance criteria. Putative targets of ISGylation that appear at least in two different studies are highlighted in green. d Western blot of total cell extracts (input) and FLAG immunoprecipitates from HEK293T cells transfected with FLAG-tagged ISG15 WT and ΔGG, together with the ISGylation machinery (E1, E2, E3), UBE1L, UBCH8 and TRIM25. e The reciprocal experiment is performed by transfecting HEK293T cells with FLAG-tagged TOP1, His-tagged ISG15 and ΔGG, together with the ISGylation machinery (E1, E2, E3), and proceeding with FLAG-immunoprecipitation as in (d). f, g IdU/CldU ratio analysis in SUM149PT (f) and U2OS (g) cells for the indicated conditions along with TOP1, ISG15 and BRCA2 protein expression. In (f, g), fibers were analyzed in two and three independent experiments, respectively (SUM149PT: siLuc n = 200, siTOP1 n = 200, siLuc +IFNβ n = 203 and siTOP1 +IFNβ n = 203; U2OS: siLuc n = 318, siBRCA2 n = 322, siBRCA2 +IFNβ n = 326, siTOP1 n = 304, siTOP1 + siBRCA2 n = 284 and siTOP1 + siBRCA2 +IFNβ n = 303). h IdU/CldU ratio analysis of three independent experiments for the indicated conditions (siLuc n = 318, siBRCA2 n = 322, siBRCA2 +IFNβ n = 326, siTOP1 + siBRCA2 +IFNβ n = 303, siBRCA2 +olaparib n = 300 and siTOP1 + siBRCA2 +olaparib n = 298) along with TOP1, ISG15 and BRCA2 protein expression. fh Median value with 95% CI is shown. Two-tailed Kruskal–Wallis test was performed; ***P = 0.0001; ****P < 0.0001. Source data are provided as a Source data file.
Fig. 6
Fig. 6. ISG15 is upregulated in BRCA1/2-deficient cells and is required for their fitness and reduced drug sensitivity.
a Immunoblot showing ISG15 protein levels in MDA-MB-436, KB2P and MCF7 cells upon BRCA1 or BRCA2 deletion or depletion. b Immunoblot showing ISG15 protein levels in BRCA1-proficient or -deficient MDA-MB-436 cells at day 2 and day 7 post siISG15 treatment. GAPDH was used as loading control. c Cell proliferation graph showing fold change of viable cells (mean with SEM) at indicated days normalized to cells at day 1 after seeding (n = 3). d Immunoblot showing ISG15 protein levels in KB2P cells corresponding to Fig. 6e. Tubulin, loading control. e Graph showing the percentage of surviving clones upon treatment with cisplatin with indicated doses in BRCA2-proficient (Brca2+/+ p53-/-) and -deficient (Brca2-/- p53-/-) KB2P mouse cells upon ISG15 overexpression (n = 3; error bars represent mean ± SEM). f Model depicting the contribution of IFNβ/ISG15 to drug response (created with BioRender.com). Normal cells, characterized by efficient DNA repair and replication fork stability, show no sensitivity to chemotherapeutic drugs. Following the inactivation of DNA repair/replication factors, such as BRCA1/2, DNA repair and replication processes are impaired, resulting in genomic instability and the release of nucleic acids species into the cytosol, which induces mild activation of the immune response. Over time, the accumulation of extra-nuclear DNAs leads to massive activation of the immune response, ultimately fostering a strong induction of the IFN-stimulated genes (ISGs), including ISG15 and its conjugation system, which restores stability of replication fork—via TOP1—and favors the acquisition of drug resistance. Source data are provided as a Source data file.

References

    1. Cavanagh H, Rogers KM. The role of BRCA1 and BRCA2 mutations in prostate, pancreatic and stomach cancers. Hered. Cancer Clin. Pract. 2015;13:16. - PMC - PubMed
    1. Scully, R., Panday, A., Elango, R. & Willis, N. A. DNA double-strand break repair-pathway choice in somatic mammalian cells. Nat. Rev. Mol. Cell Biol. 10.1038/s41580-019-0152-0. (2019) - PMC - PubMed
    1. Schlacher K, et al. Double-strand break repair-independent role for BRCA2 in blocking stalled replication fork degradation by MRE11. Cell. 2011;145:529–542. - PMC - PubMed
    1. Schlacher K, Wu H, Jasin M. A distinct replication fork protection pathway connects Fanconi anemia tumor suppressors to RAD51-BRCA1/2. Cancer Cell. 2012;22:106–116. - PMC - PubMed
    1. Härtlova A, et al. DNA damage primes the type I interferon system via the cytosolic DNA sensor STING to promote anti-microbial innate immunity. Immunity. 2015;42:332–343. - PubMed

Publication types