. 2023 Oct 2;14(1):6132.
doi: 10.1038/s41467-023-41892-5.

Development of cyclopeptide inhibitors of cGAS targeting protein-DNA interaction and phase separation

Affiliations

Development of cyclopeptide inhibitors of cGAS targeting protein-DNA interaction and phase separation

Xiaoquan Wang et al. Nat Commun. .

Abstract

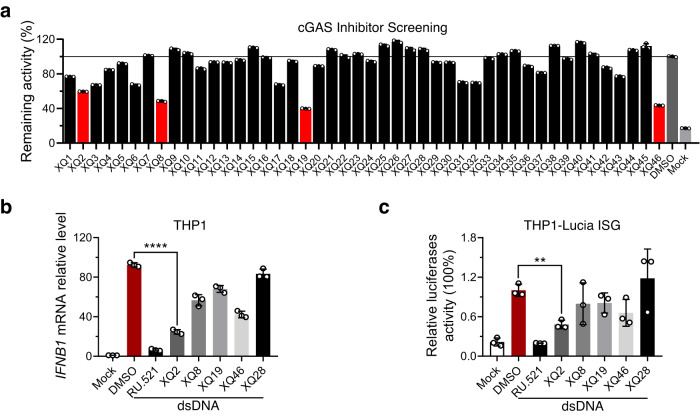
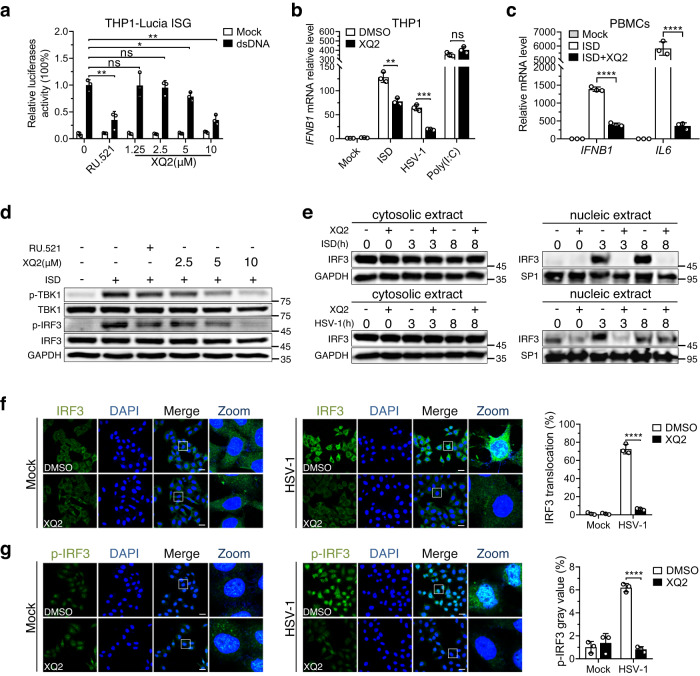
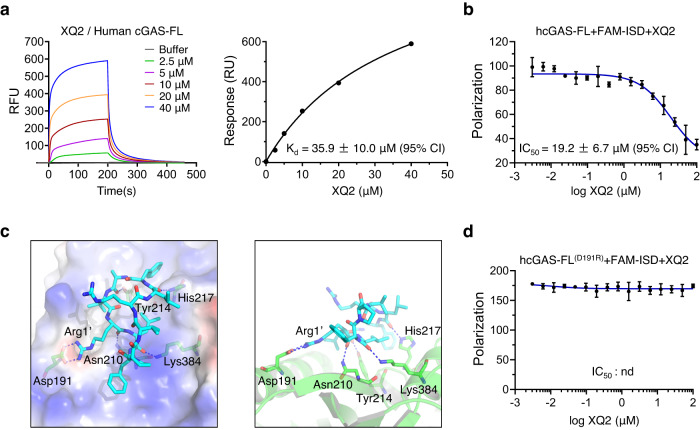
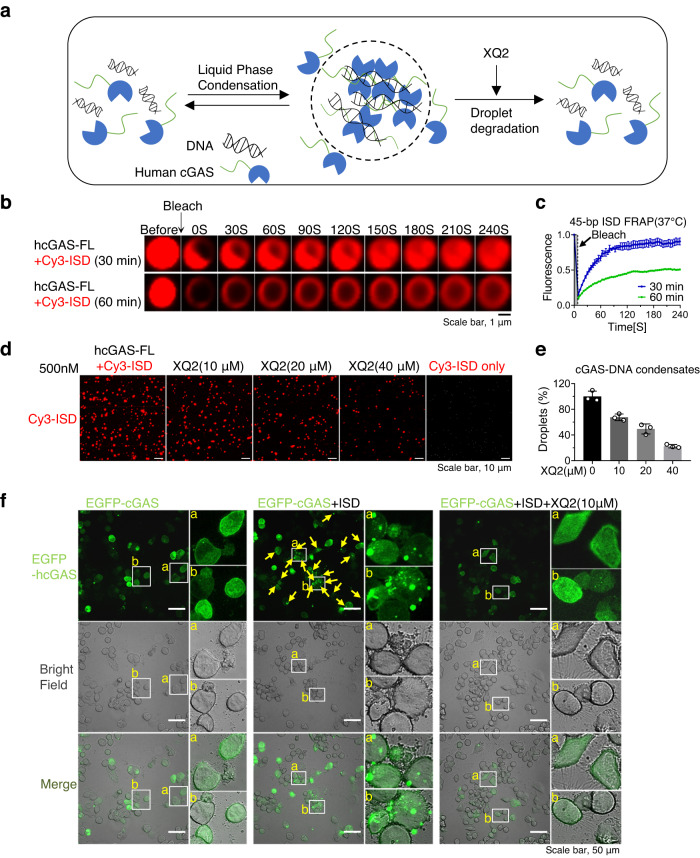
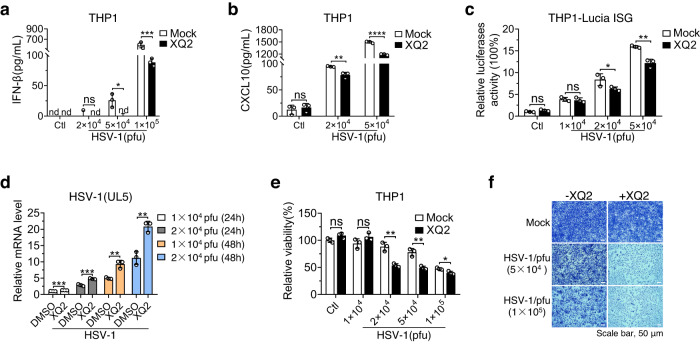
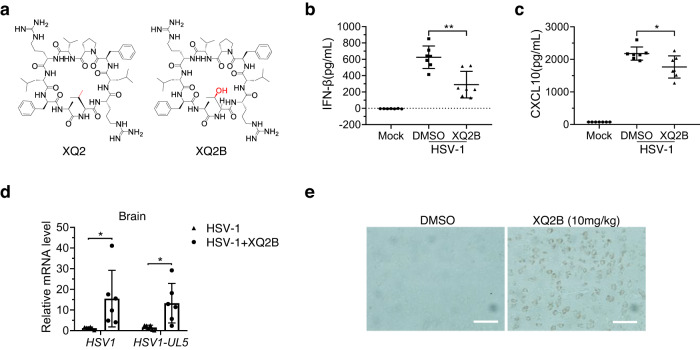
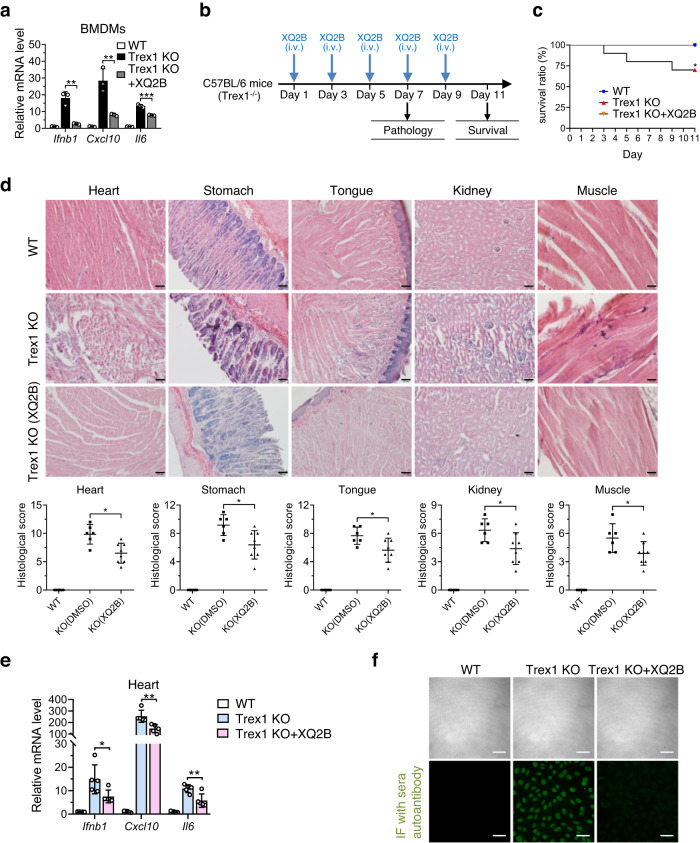
Cyclic GMP-AMP synthase (cGAS) is an essential sensor of aberrant cytosolic DNA for initiating innate immunity upon invading pathogens and cellular stress, which is considered as a potential drug target for autoimmune and autoinflammatory diseases. Here, we report the discovery of a class of cyclopeptide inhibitors of cGAS identified by an in vitro screening assay from a focused library of cyclic peptides. These cyclopeptides specifically bind to the DNA binding site of cGAS and block the binding of dsDNA with cGAS, subsequently inhibit dsDNA-induced liquid phase condensation and activation of cGAS. The specificity and potency of one optimal lead XQ2B were characterized in cellular assays. Concordantly, XQ2B inhibited herpes simplex virus-1 (HSV-1)-induced antiviral immune responses and enhanced HSV-1 infection in vitro and in vivo. Furthermore, XQ2B significantly suppressed the elevated levels of type I interferon and proinflammatory cytokines in primary macrophages from Trex1-/- mice and systemic inflammation in Trex1-/- mice. XQ2B represents the specific cGAS inhibitor targeting protein-DNA interaction and phase separation and serves as a scaffold for the development of therapies in the treatment of cGAS-dependent inflammatory diseases.


Conflict of interest statement

The authors declare no competing interests.

Figures

Fig. 1
Fig. 1. Screening of cGAS inhibitors from macrocyclic peptide library.
a In vitro screening of cGAS inhibitors from macrocyclic peptide library by an RNA-based fluorescent biosensor. Hits were selected at a cutoff of 40% inhibition. b Potency of four hits (10 μM) was tested in dsDNA-stimulated THP1 cells in the presence of indicated molecule concentrations. RU.521 and XQ28 were used as the positive and negative controls, respectively. IFNB1 mRNA in THP1 cells upon dsDNA stimulation for 6 h were measured by qPCR. p < 0.0001. c THP1 luciferase reporter cells were exposed to indicated compounds, and then stimulated with dsDNA for 24 h to promote type I interferon response. Type I interferon response was assessed by luciferase activity. p = 0.0014. Data are representative of three independent experiments in (b, c). (Data are presented as mean ± SD, n = 3 independent samples in (ac), **p < 0.01, ****p < 0.0001 using one-way ANOVA with Dunnett’s post hoc test). Source data are provided as a Source Data file.
Fig. 2
Fig. 2. XQ2 selectively inhibits dsDNA-induced signaling in human and murine cells.
a THP1 luciferase reporter cells were exposed to DMSO, RU.521 (10 μM), and the indicated doses of XQ2 for 3 h, and then stimulated with dsDNA for 24 h to promote type I interferon response. Type I interferon response was assessed by luciferase activity. p = 0.0039 (RU.521); p = 0.0426 (5 μM); p = 0.0011 (10 μM). b THP1 cells were pretreated for 3 h with DMSO or 10 μM XQ2, and then stimulated by transfection of ISD or HSV-1 infection or poly (I: C). Induction of IFNB1 mRNA was measured by qPCR. p = 0.0024 (ISD); p = 0.0003 (HSV-1). c Primary human PBMCs were pretreated for 3 h with DMSO or XQ2 (10 μM), and then stimulated with ISD. Induction of IFNB1 and IL6 mRNA was measured by qPCR. p < 0.0001 (IFNB1); p < 0.0001 (IL6). d THP1 cells pretreated for 3 h with DMSO, RU.521 or the indicated doses of XQ2, followed by stimulation with dsDNA for 6 h, and then cell lysates were analyzed for phosphorylated IRF3 and TBK1 by immunoblotting. e THP1 cells were pretreated for 3 h with DMSO or XQ2 (10 μM), and then stimulated with ISD or HSV-1 for indicated times. Cytoplasmic and nuclear fractions were extracted and immunoblotted with the indicated antibodies. SP1 and GAPDH were applied to indicate the accuracy of fractionation. f, g Hela cells were pretreated for 3 h with DMSO or XQ2 (10 μM), and then stimulated with HSV-1 for 6 h. Cells were immunostained with anti-IRF3 or anti-p-IRF3 antibody and imaged by confocal microscopy. Representative images (Left and Center); quantification of cells with nuclear IRF3 (Top and Right); quantification of cells with p-IRF3 (Bottom and Right). Scale bars represent 25 μm. p < 0.0001 (f); p < 0.0001 (g). Data are representative of three independent experiments with similar results in (d, e), or three independent experiments in (ac, f, g). (Data are presented as mean ± SD, n = 3 independent samples in (ac, f, g), ns, not significant, *p < 0.05, **p < 0.01, ***p < 0.001, ****p < 0.0001 using one-way ANOVA with Dunnett’s post hoc test). Source data are provided as a Source Data file.
Fig. 3
Fig. 3. XQ2 directly binds with cGAS.
a SPR analysis of the binding of XQ2 with full-length human cGAS (hcGAS-FL). The binding affinity (Kd) was determined by fitting the binding data to a simple one-to-one binding model. b Competition of FAM-ISD binding to hcGAS-FL with the indicated doses of XQ2, the polarization signal was detected by a microplate reader. c The docked structure of XQ2 with cGAS (PDB ID: 4O69), and the right panel indicated the detailed interactions between XQ2 and cGAS (right). XQ2 (cyan) and the contacted residues (green) of cGAS were shown as a stick model. Hydrogen bonds were indicated by dash blue lines. d Competition of FAM-ISD binding to hcGAS-FL (D191R) mutant with the indicated doses of XQ2, the polarization signal was detected by a microplate reader. Data are representative of three independent experiments in (b, d). (Data are presented as mean ± SD, n = 3 independent samples in (b, d). Source data are provided as a Source Data file.
Fig. 4
Fig. 4. XQ2 inhibits DNA-induced liquid phase condensation of cGAS.
a Schematic of the inhibition of XQ2 against the liquid phase condensation of cGAS-DNA. b, c FRAP of cGAS-DNA condensates. Bleaching was performed at the indicated time points (30 and 60 min) after mixing of hcGAS-FL (1 μM) and Cy3-ISD (1 μM), and the recovery occurred at 37 °C. Time 0 s indicates the start of recovery after photobleaching. FRAP of cGAS-DNA droplets was quantified by fluorescence intensity. d, e The liquid phase condensation of hcGAS-FL (500 nM) protein and Cy3-ISD (500 nM) in the presence of either DMSO or the indicated doses of XQ2 for 30 min at 37 °C. The images shown in (d) are representative of all fields in the well. Quantification of condensation was shown by the relative number of droplets. f cGAS-knockout Hela cells reconstituted with EGFP-hcGAS-FL were stimulated by transfection of ISD in the presence of either DMSO or XQ2 (10 μM) for 4 h. Representative imaging analysis by confocal microscope. Individual cells and cGAS–DNA puncta (Boxes) are enlarged. These images represent at least five fields examined. Data are representative of three independent experiments with similar results in (f), or three independent experiments in (be). (Data are presented as mean ± SD, n = 3 independent samples in (c, e). Source data are provided as a Source Data file.
Fig. 5
Fig. 5. XQ2 attenuates the host antiviral defenses.
a, b THP1 cells were pretreated for 3 h with DMSO or XQ2 (10 μM), and then stimulated by HSV-1 infection for 24 h. Induction of IFN-β (a) and CXCL10 (b) proteins was measured by ELISA. a p = 0.0264 (5 × 10⁴ pfu); p = 0.0001 (1 × 10⁵ pfu), b p = 0.0064 (2 × 10⁴ pfu); p < 0.0001 (5 × 10⁴ pfu). c THP1 luciferase reporter cells were exposed to DMSO or XQ2 (10 μM), and then stimulated by the indicated titer of HSV-1 infection for 24 h. Type I interferon response was indicated by luciferase activity. p = 0.043 (2 × 10⁴ pfu); p = 0.0018 (5 × 10⁴ pfu). d THP1 cells were pretreated for 3 h with DMSO or XQ2 (10 μM), and then stimulated by HSV-1 infection for indicated titer and times. Induction of HSV-1(UL5) mRNA was measured by qPCR. p = 0.0008 (1 × 10⁴ pfu, 24 h); p = 0.0007 (2 × 10⁴ pfu, 24 h); p = 0.0035 (1 × 10⁴ pfu, 48 h); p = 0.0029 (2 × 10⁴ pfu, 48 h). e THP1 cells were pretreated for 3 h with DMSO or XQ2 (10 μM), followed by the indicated titer of HSV-1 infection. The cell viability was measured by CCK-8 assay. p = 0.0024 (2 × 10⁴ pfu); p = 0.003 (5 × 10⁴ pfu); p = 0.0247 (1 × 10⁵ pfu). f L929 cells pretreated for 4 h with DMSO or XQ2 (10 μM), followed by HSV-1 infection. The proliferation of cells was examined by crystal violet staining. Data are representative of three independent experiments with similar results in (f), or three independent experiments in (ae). (Data are presented as mean ± SD, n = 3 independent samples in (ae), ns, not significant, *p < 0.05, **p < 0.01, ***p < 0.001, ****p < 0.0001 using one-way ANOVA with Dunnett’s post hoc test). Source data are provided as a Source Data file.
Fig. 6
Fig. 6. XQ2B attenuates the host innate antiviral response in vivo.
a Chemical structure of XQ2 and XQ2B. b, c WT mice (n = 7) were injected intravenously with DMSO or XQ2B (10 mg/kg) for 3 h, and then administrated intravenously with HSV-1 at 1 × 10⁷ pfu per mouse for 6 h. Serum from mice was collected for ELISA analysis of the levels of IFN-β (b) and CXCL10 (c). p = 0.0013 (b); p = 0.0175 (c). d Brains from mice (n = 6) in (b, c) were collected for qPCR analysis of the induction of HSV-1 and HSV-1(UL5) mRNA. p = 0.0287 (HSV-1); p = 0.0136 (HSV1-UL5). e Brains from mice in (b, c) were collected for immunohistochemistry (IHC) analysis with an anti-HSV-1 antibody. Tissue sections were visualized using microscopy. Scale bar, 25 μm. Data are representative of two independent experiments in (be). (Data are presented as mean ± SD, n = 7 mice per condition in (b, c); n = 6 mice per condition in (d), *p < 0.05, **p < 0.01 using one-way ANOVA with Dunnett’s post hoc test). Source data are provided as a Source Data file.
Fig. 7
Fig. 7. XQ2B suppresses systemic inflammation in Trex1−/− mice.
a Trex1-/- BMDMs were treated with DMSO or XQ2B (10 μM) for 24 h, and induction of Ifnb1, Cxcl10 and Il6 mRNA was measured by qPCR. Fold changes are relative to WT BMDM group. p = 0.002 (Ifnb1); p = 0.008 (Cxcl10); p = 0.0005 (Il6). b Schematic representation illustrating the experimental design in the Trex1-/- mice model of autoimmune diseases. c Survival curves of WT and Trex1−/− mice treated with DMSO or XQ2B (10 mg/kg) every other day for 11 consecutive days (n = 10 mice per group). p = 0.0352. d WT mice (n = 6) or Trex1-/- mice (n = 6) were injected intravenously with DMSO or 10 mg/kg XQ2B every other day for 7 consecutive days. Representative H&E-stained tissue sections from WT or Trex1-/- mice treated with DMSO or XQ2B. The panels are at ×20 magnification. Scale bar, 100 μm. p = 0.0139 (Heart); p = 0.0139 (Stomach); p = 0.0274 (Tongue); p = 0.0315 (Kidney); p = 0.0139 (Muscle). e heart tissues from WT, Trex1–/– and Trex1–/– (XQ2B) mice (n = 5) were collected and induction of Ifnb1, Cxcl10 and Il6 mRNA was measured by qPCR. p = 0.0415 (Ifnb1); p = 0.0054 (Cxcl10); p = 0.0087 (Il6). f Antinuclear antibodies in WT, Trex1–/– and Trex1–/– (XQ2B) serum were detected using antinuclear antibody antigen substrate slide kit. Scale bar, 50 μm. Data are representative of two independent experiments with similar results in (f), or three independent experiments in (a) or two independent experiments in (d, e). (Data are presented as mean ± SD, n = 3 independent samples in (a); n = 6 mice per condition in (d); n = 5 mice per condition in (e), *p < 0.05, **p < 0.01, ***p < 0.001 using one-way ANOVA with Dunnett’s post hoc test). Source data are provided as a Source Data file.

References

    1. Wu J, Chen ZJ. Innate immune sensing and signaling of cytosolic nucleic acids. Annu. Rev. Immunol. 2014;32:461–488. doi: 10.1146/annurev-immunol-032713-120156. - DOI - PubMed
    1. Barrat FJ, Elkon KB, Fitzgerald KA. Importance of nucleic acid recognition in inflammation and autoimmunity. Annu. Rev. Med. 2016;67:323–336. doi: 10.1146/annurev-med-052814-023338. - DOI - PubMed
    1. Chen Q, Sun L, Chen ZJ. Regulation and function of the cGAS-STING pathway of cytosolic DNA sensing. Nat. Immunol. 2016;17:1142–1149. doi: 10.1038/ni.3558. - DOI - PubMed
    1. Ablasser A, Chen ZJ. cGAS in action: expanding roles in immunity and inflammation. Science. 2019;363:eaat8657. doi: 10.1126/science.aat8657. - DOI - PubMed
    1. Sun LJ, Wu JX, Du FH, Chen X, Chen ZJJ. Cyclic GMP-AMP synthase is a cytosolic DNA sensor that activates the type I interferon pathway. Science. 2013;339:786–791. doi: 10.1126/science.1232458. - DOI - PMC - PubMed

Publication types

LinkOut - more resources