. 2023 Oct;7(10):1229-1241.
doi: 10.1038/s41551-023-01098-y. Epub 2023 Oct 2.

Synchronized wearables for the detection of haemodynamic states via electrocardiography and multispectral photoplethysmography

Affiliations

Synchronized wearables for the detection of haemodynamic states via electrocardiography and multispectral photoplethysmography

Daniel Franklin et al. Nat Biomed Eng. 2023 Oct.

Abstract

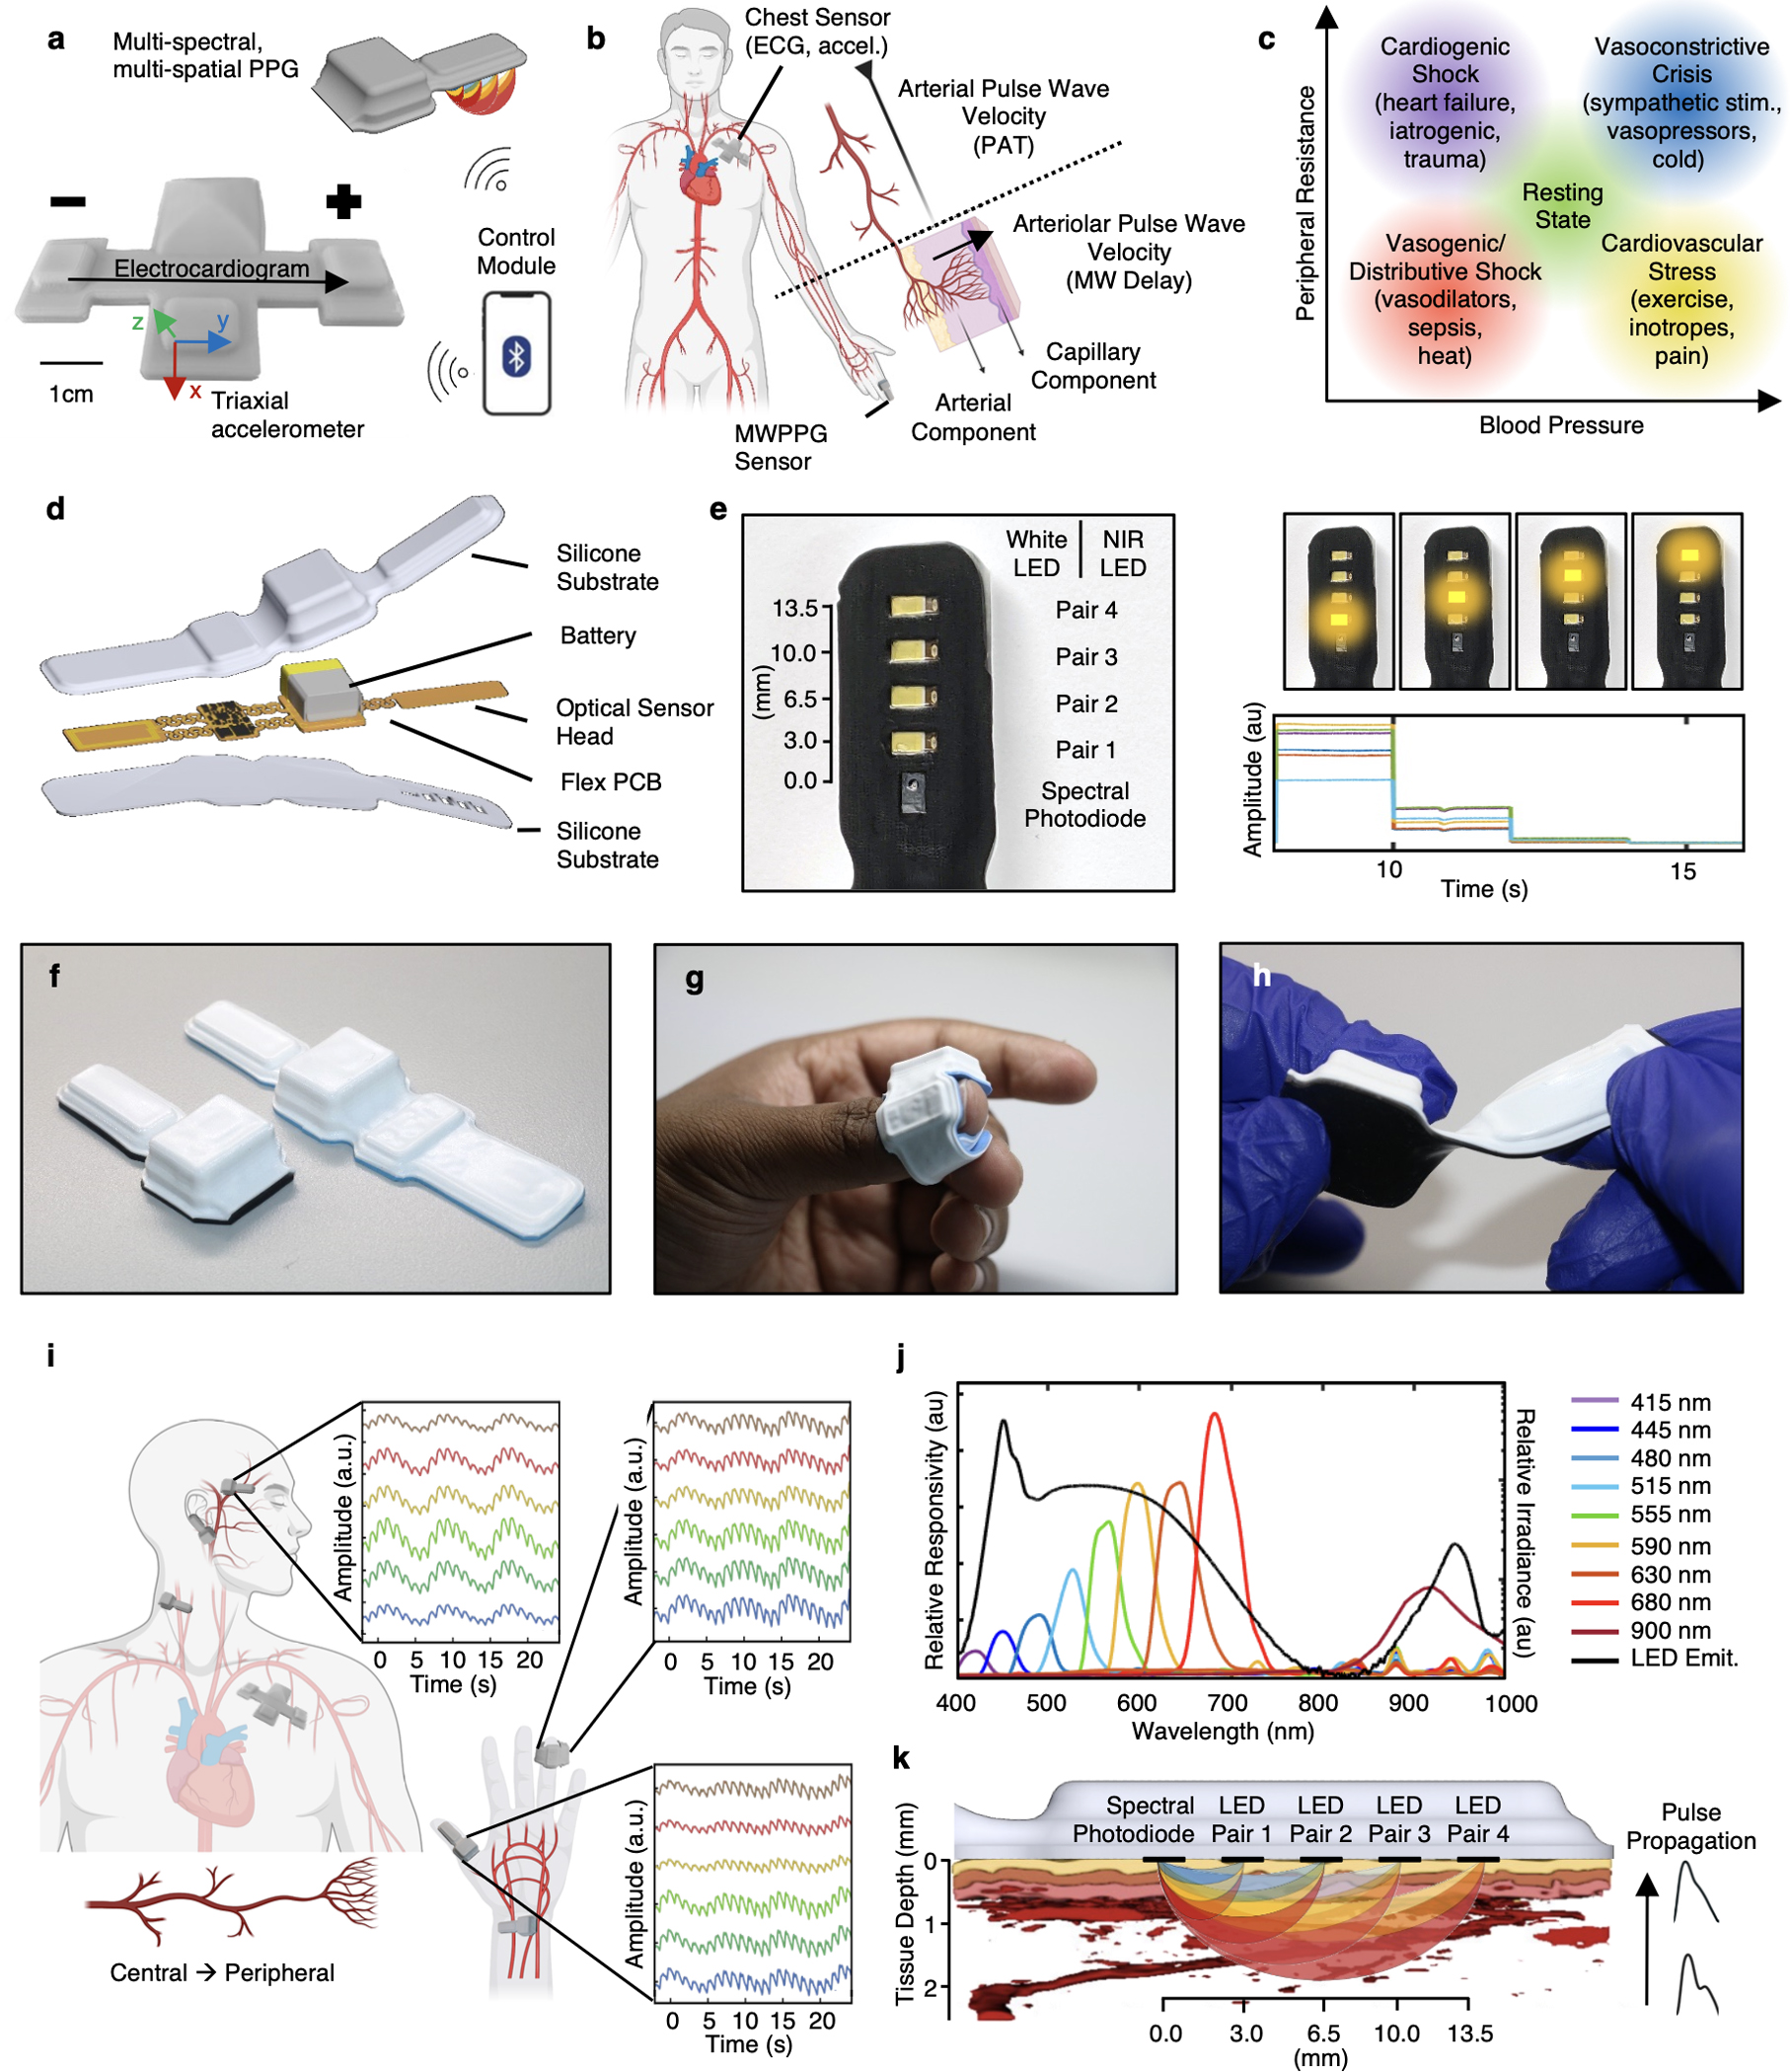
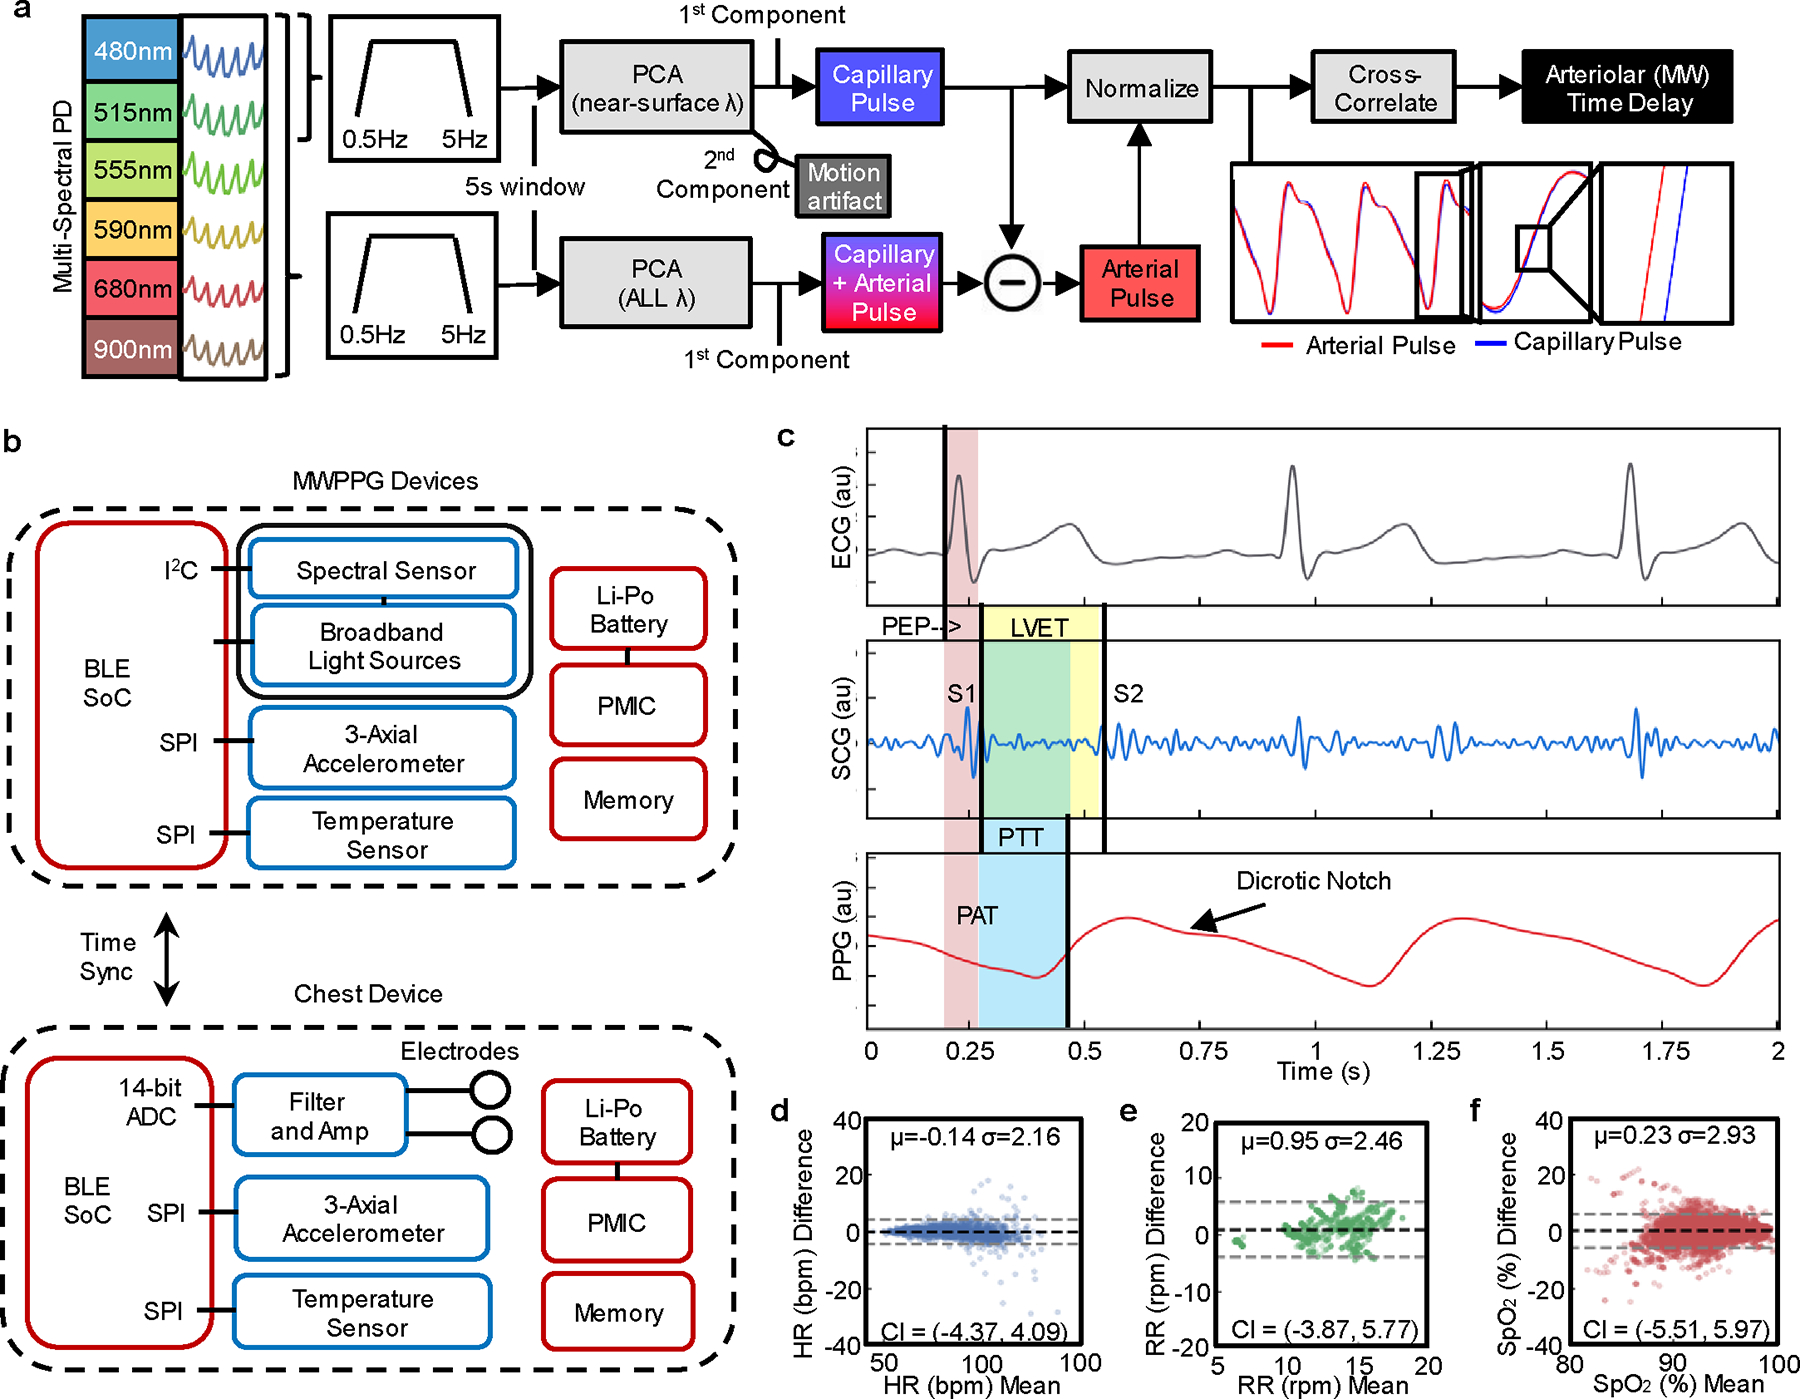
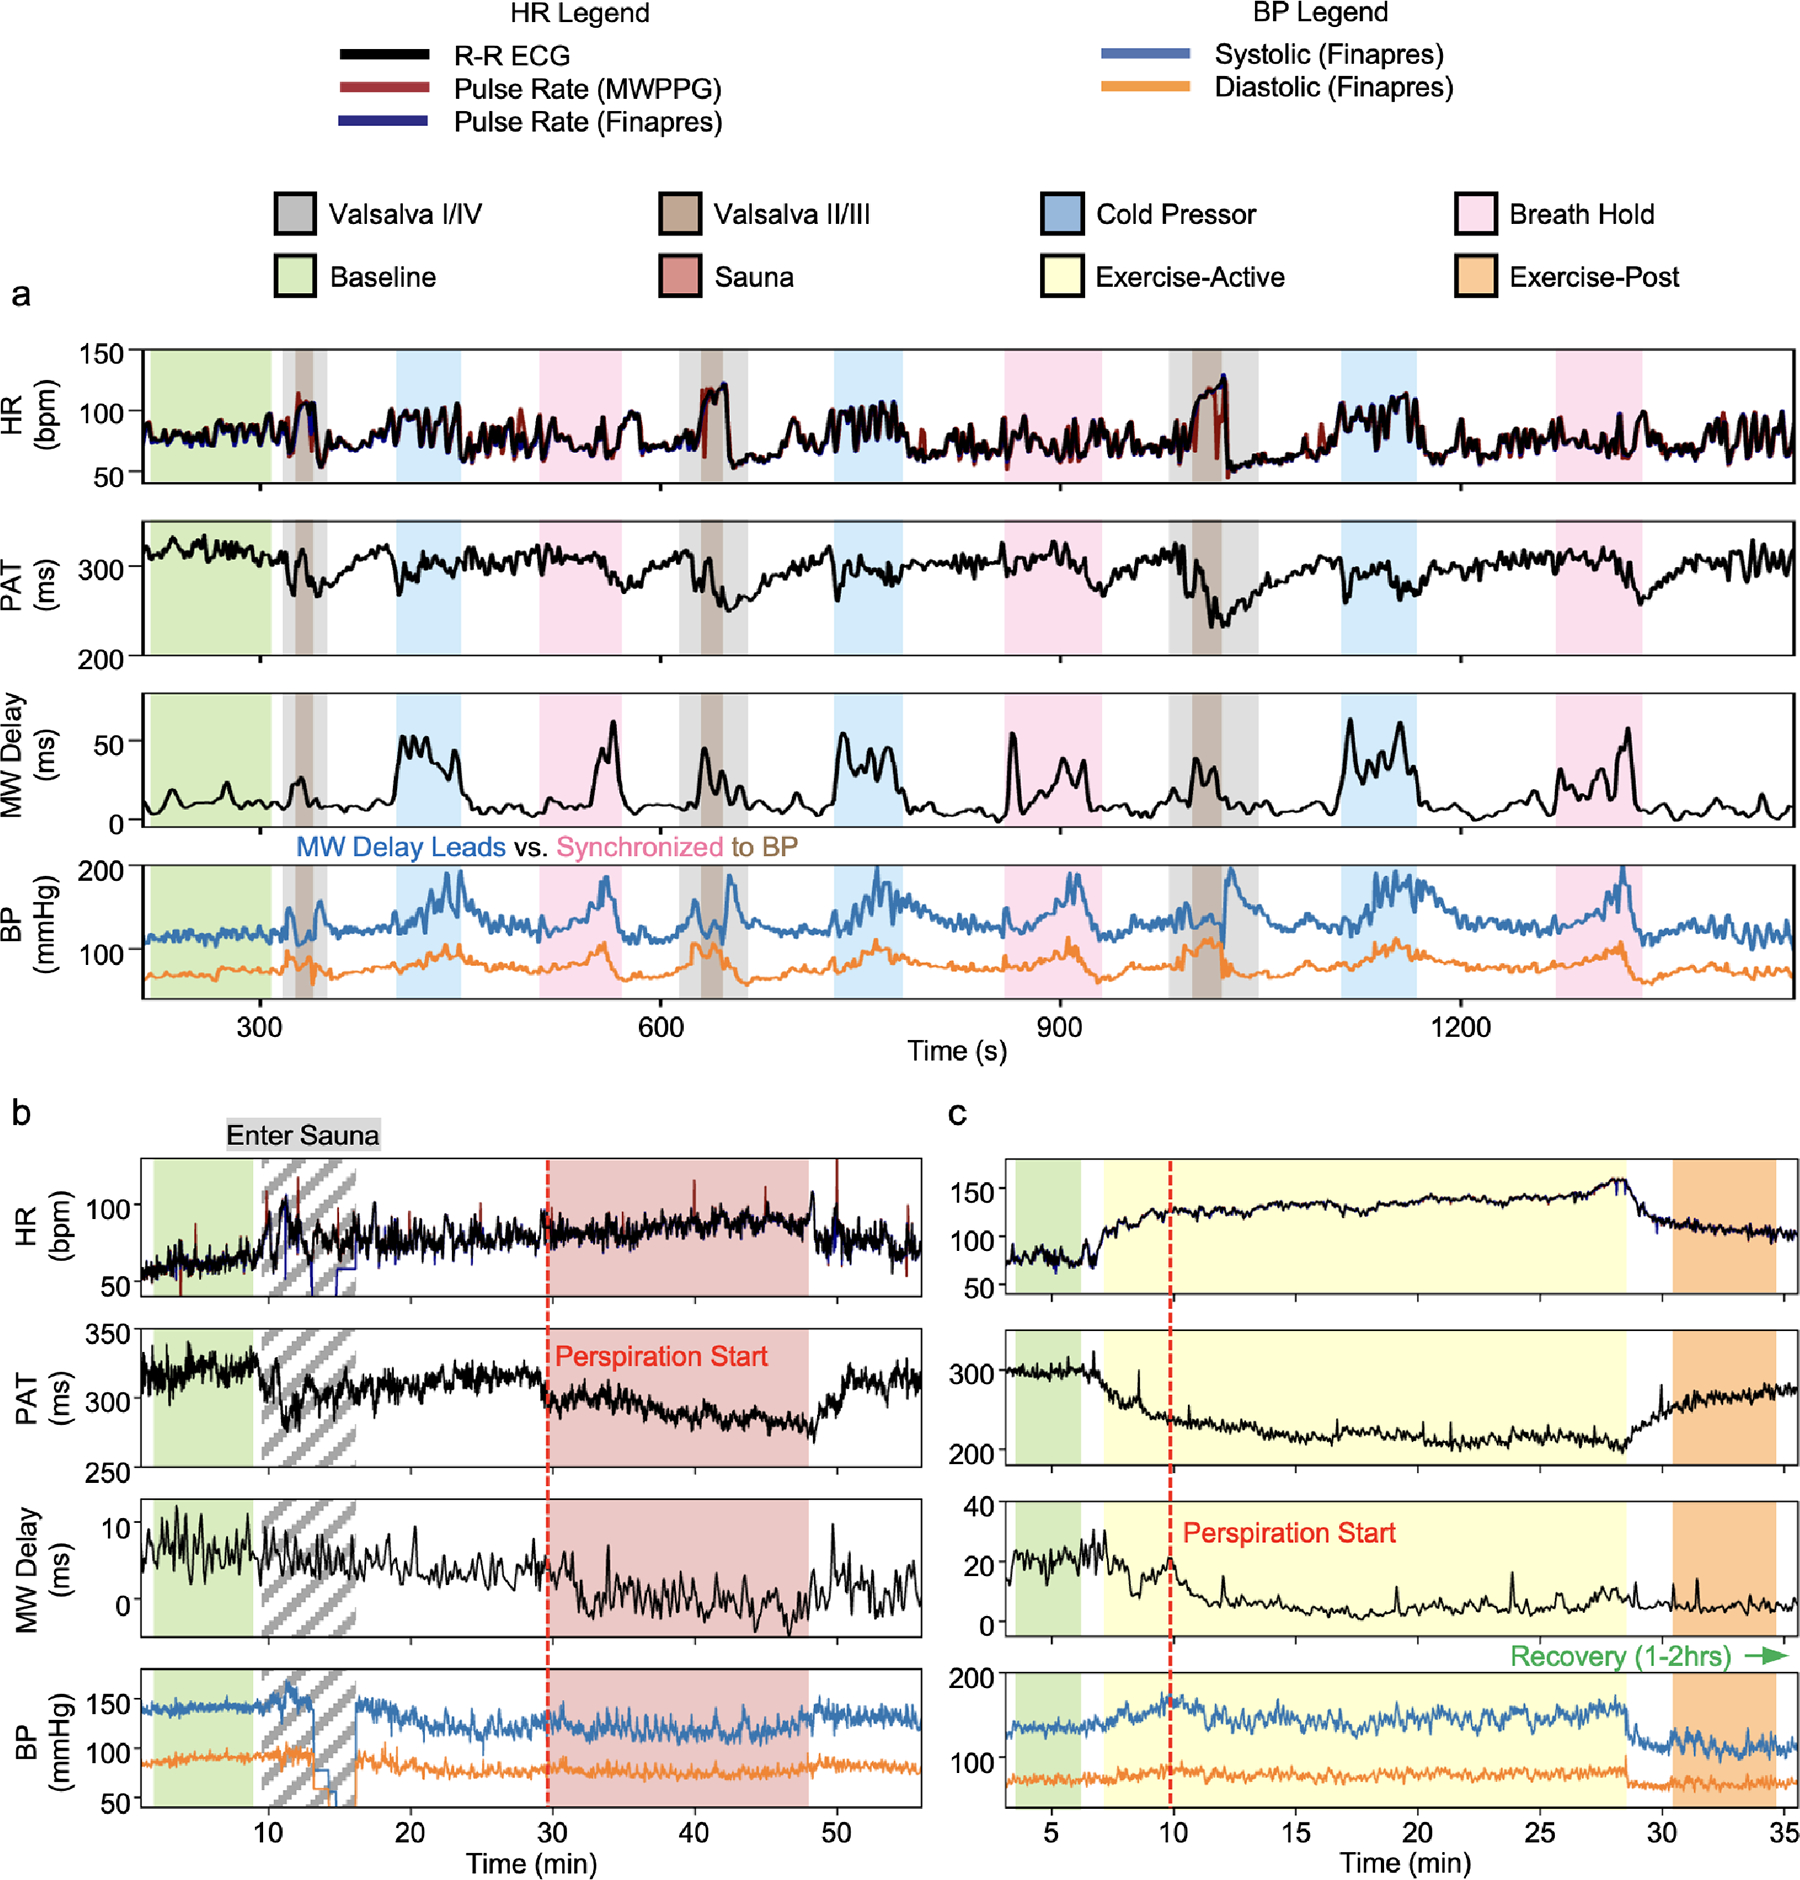
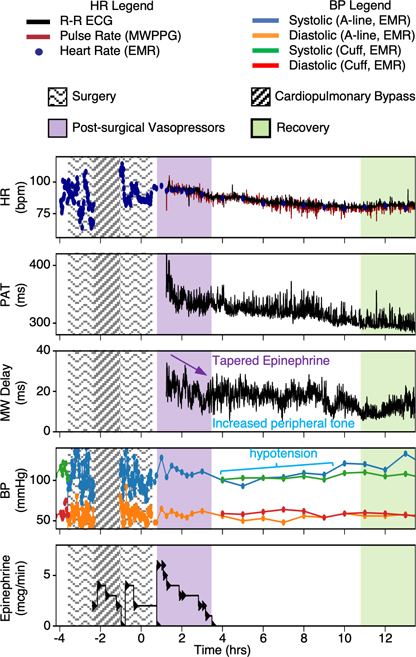
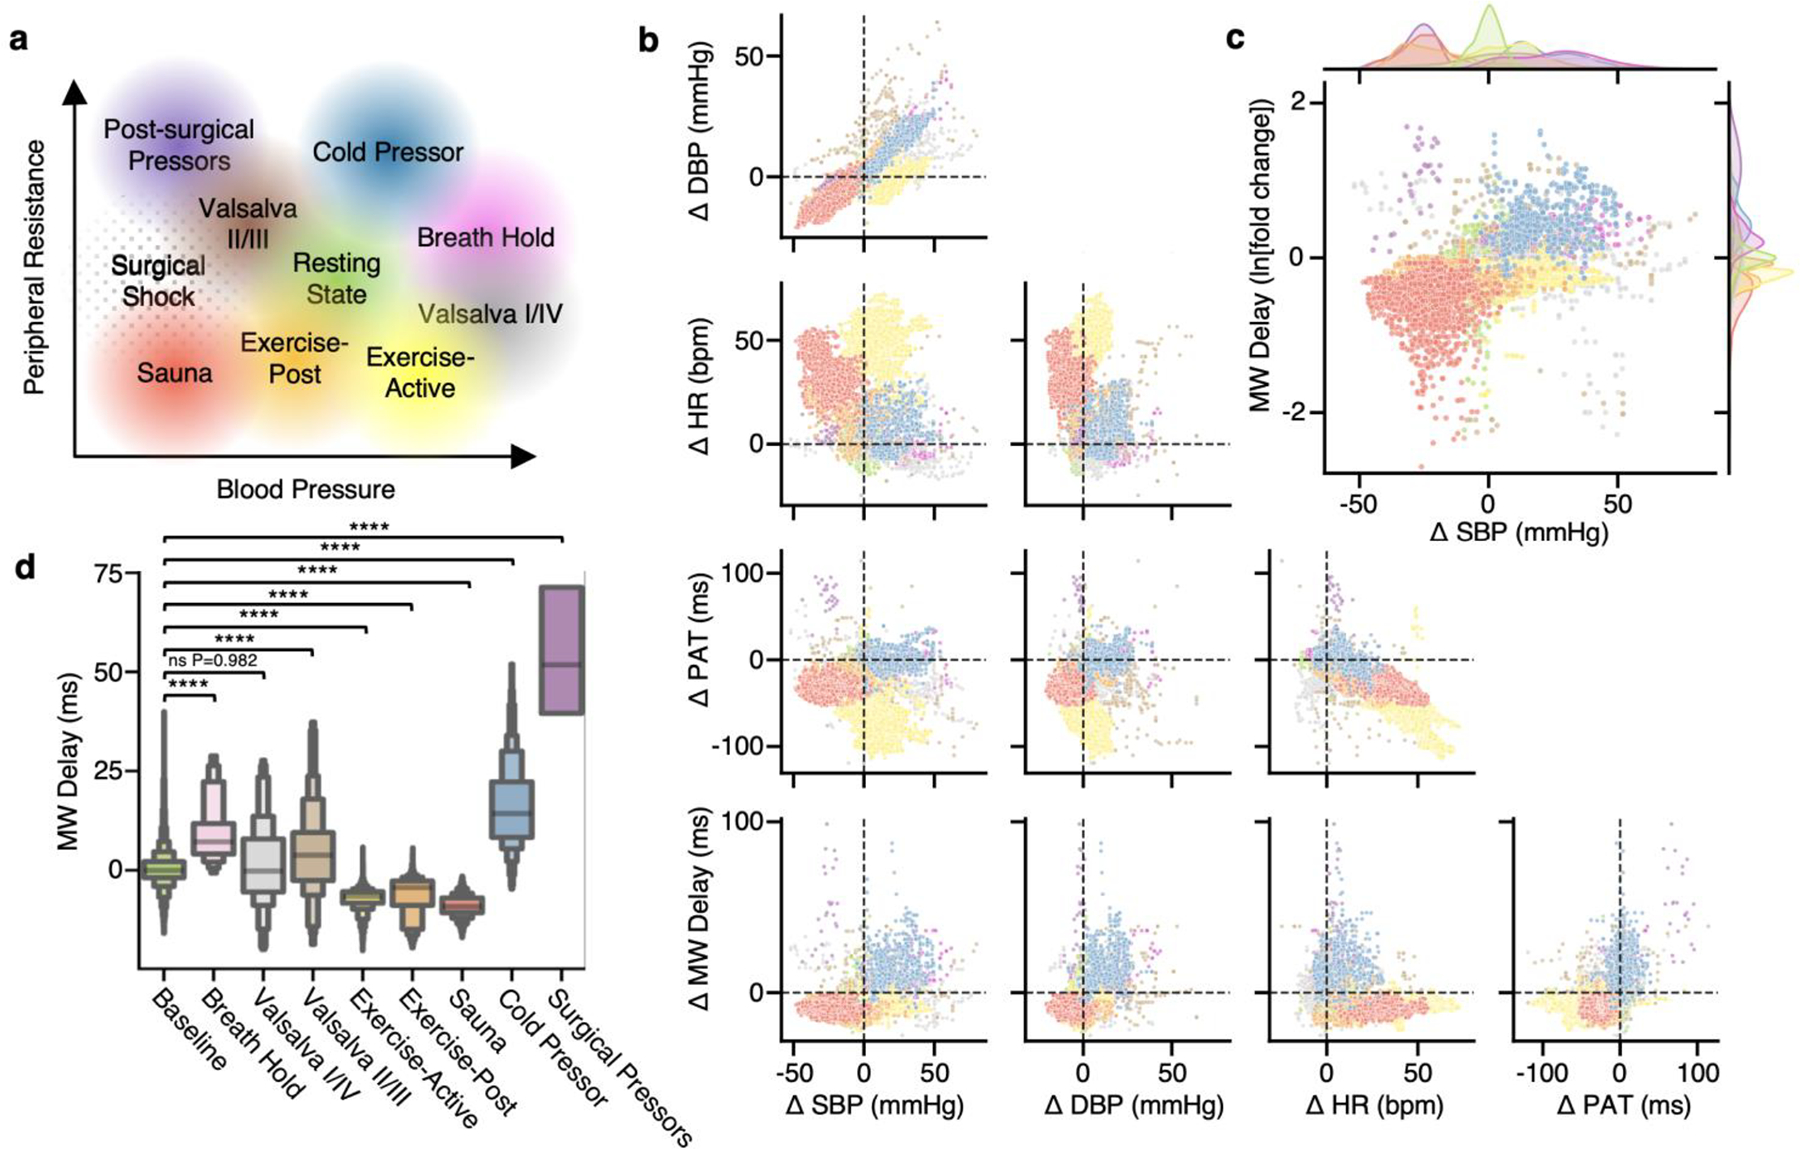
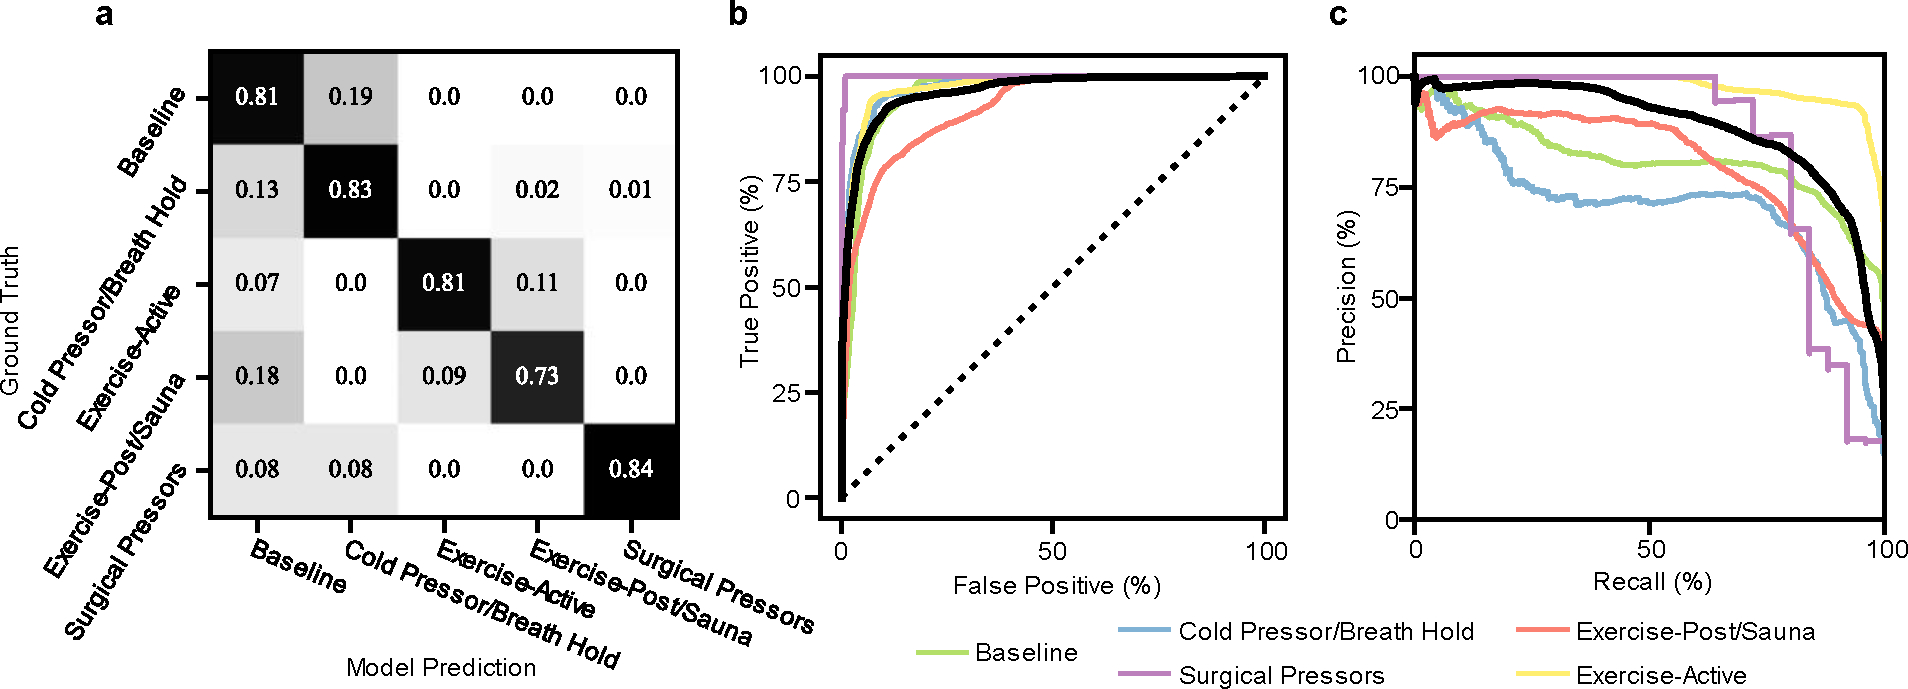
Cardiovascular health is typically monitored by measuring blood pressure. Here we describe a wireless on-skin system consisting of synchronized sensors for chest electrocardiography and peripheral multispectral photoplethysmography for the continuous monitoring of metrics related to vascular resistance, cardiac output and blood-pressure regulation. We used data from the sensors to train a support-vector-machine model for the classification of haemodynamic states (resulting from exposure to heat or cold, physical exercise, breath holding, performing the Valsalva manoeuvre or from vasopressor administration during post-operative hypotension) that independently affect blood pressure, cardiac output and vascular resistance. The model classified the haemodynamic states on the basis of an unseen subset of sensor data for 10 healthy individuals, 20 patients with hypertension undergoing haemodynamic stimuli and 15 patients recovering from cardiac surgery, with an average precision of 0.878 and an overall area under the receiver operating characteristic curve of 0.958. The multinodal sensor system may provide clinically actionable insights into haemodynamic states for use in the management of cardiovascular disease.


Conflict of interest statement

Competing interests

J.Y.L., H.U.C. and J.A.R. own equity in Sibel Health and hold patents (US20210361165A1, USA 2021 pending; US20210386300A1, USA 2021 pending; WO2023043866A1, WIPO 2023) associated with this company. The other authors declare no competing interests.

Figures

Fig. 1 |
Fig. 1 |. Combined hemodynamic sensor concepts and devices overview.
a, The sensor system consists of a peripherally mounted sensor capable of MWPPG measurements, and a chest-mounted sensor capable of ECG and triaxial accelerometry. Both sensors are coordinated wirelessly via a Bluetooth-enabled control module. b, Time-synchronized measurement of ECG and PPG enables estimation of systemic blood pressure via arterial pulse wave velocity, while MWPPG enables quantification of local/peripheral arteriolar states. c, Combining these hemodynamic sensors enables differentiation of hemodynamic states in dimensions of clinically pertinent hemodynamic parameters of blood pressure and vascular resistance. d, Exploded rendering of the multispectral device with silicone encapsulation layers, fPCB consisting of four islands separated via flexible serpentine interconnects and support circuitry. e, Left: bottom view of the multiwavelength sensor with multiple pairs of individually controllable broadband and NIR LEDs. Source-detector distances are 3 mm, 6.5 mm, 10 mm and 13.5 mm. Right: time-sequential LED sequencing allows for spatially resolved spectroscopy useful in tissue oximetry. f, Side-by-side views of two different form factors achievable by folding the fPCB. g, Device placement as a finger wrap. h, Mechanical twisting of the peripheral multiwavelength device in its short form. i, Diagram indicating various possible placements of the devices and associated normalized waveforms, offset for clarity, from central and peripheral locations, and with both arterial-dominated or capillary-dominated vascular beds (more detail in Supplementary Fig. 2). Obtained during deep breathing exercises, the signal contains both low-frequency oscillations due to respiration and high-frequency oscillations due to the cardiac cycle. j, Monochromator scan of an encapsulated device showing relative responsivity (left axis) at 9 different wavelengths throughout the visible and NIR ranges as well as LED pair emittance spectrum (black, right axis). k, Diagram of the measurement principles showing simultaneous wavelength- and distance-based light paths through a photoacoustic tomography rendering of real human skin. Portions of this figure were created with BioRender.com.
Fig. 2 |
Fig. 2 |. Combined hemodynamic sensor system and measurements.
a, Data analysis pipeline for extraction of arteriolar pulse transit time, extracting capillary and arterial pulsations from six discrete wavelength channels and employing normalized subsampled cross-correlation to extract arteriolar (MW) time delay. b, Block diagram of the sensors and key components enabling cross-body, central-vs-peripheral measurements of different modalities with BLE wireless communication. PMIC, power management integrated circuitry; I2C or SPI, serial peripheral interface; ADC, analogue–digital converter. c, Example of time-synchronized sensor waveforms from the ECG, z-axis accelerometer SCG and PPG, with signal features and key physiological time intervals of hemodynamic relevance indicated: first mitral/tricuspid heart sound (S1), second aortic/pulmonic heart sound (S2), PEP, LVET, PAT, PTT. df, Bland–Altman plots with bias (black dashed line) and ±1.96 s.d.s (dashed grey lines, confidence intervals (CI)) for conventional vitals measurements of HR (d), RR (e) and SpO2 (f) against references: Finapres pulse rate was used for healthy participants; HR, RR and SpO2 references were extracted from the electronic medical record of all patients.
Fig. 3 |
Fig. 3 |. Representative hemodynamic studies on healthy individuals.
a, Short-term interleaved pressor tests, cycling through Valsalva maneuver, cold pressor test and breath holding. A consistent rise in MW delay signal during ice bath exposure precedes a complementary rise in BP, indicating that MW delay is measuring a driving force inducing BP change. Conversely, alignment of MW delay increase with BP in Valsalva phases II/III and breath holds indicates measurement of the reverse scenario—a compensatory, sympathetic vasoactive response to stimulus. b, A 20-min heat exposure challenge via personal sauna. BP drops from baseline associated with a rise in HR, suggesting vasodilative hypotension. Note the loss of Finapres data during sauna entry, necessary due to disconnection of the wired system to pass the hand through a hole, while the wireless sensors experience no such limitation. Contrary to theory, PAT drops during this period, especially after profuse perspiration begins. MW delay exhibits a small drop during heat exposure, which is partially reversed upon exiting the chamber. c, A 20-min exercise bike session, showing drastic change in PAT mirroring the HR which returns to baseline. MW delay begins to drop only after the patient begins vasodilating, which occurs at the peak BP a few minutes after exercise starts. The delay remains low after exercise is complete and BP is still low despite the PAT return to baseline levels.
Fig. 4 |
Fig. 4 |. Post-surgical monitoring.
A patient monitored for a 12-h period post mitral valve repair was given intravenous epinephrine in response to post- operative hypotension noted in the electronic medical record (EMR). Hour 0 corresponds to the start of surgical wound closure. Intravenous epinephrine was started after initial rooming and assessment, and devices were placed shortly afterwards. While the medication was tapered after 3 h, MW delay remained high in the setting of hypotension, suggesting elevated peripheral vascular tone. This lasted until the patient’s BP recovered and the patient was able to feed, 10 h after surgery completion.
Fig. 5 |
Fig. 5 |. Hemodynamic measurement scatterplots.
a, Theoretical plot between peripheral resistance and BP, indicating hypothesized relationships of different hemodynamic stimuli. b, Baseline-subtracted scatterplots between HR (bpm), PAT (ms), MW delay (ms) and systolic/diastolic BP (mmHg), with each sample color coded by stimulus as in a. To control for inter-participant variability, the median of the baseline state, indicated by crosshairs, is subtracted from each datapoint. c, Scatterplot of the MW delay fold change on a logarithmic axis against BP, showcasing separation of stimuli into groupings in similar positions as in a, with kernel density estimates of distributions of these quantities outside each axis. Note the overlap of sauna and surgical pressor distributions on the BP axis, indicating that two very different states are not adequately separable using BP alone, but begin to be distinguished with the addition of MW delay. d, Letter-value plots of MW delay measurements during each hemodynamic state. In letter-value plots, each progressively smaller pair of boxes around the center value (median) represents a power of 2 smaller fraction of the data points, such as fourths, eighths, sixteenths and so on. Brunner–Munzel tests between each stimulus and the baseline distribution; NS, not significant, ****P < 0.0001.
Fig. 6 |
Fig. 6 |. Hemodynamic classification.
a, Confusion matrix of model predictions, grouped by hemodynamic condition (quadrant on BP vs SVR axis). b, c, Receiver operating characteristic curves (b) and precision-recall curves (c) for all hemodynamic state predictions (one vs all) colored by the quadrants outlined in Fig. 1c, and highlighted micro-average curve in black. Area under the curve values for receiver operating characteristic curves are: baseline = 0.96, exercise = 0.98, sauna = 0.93, cold pressor/breath hold = 0.98, surgical pressors = 1.0. Area under the curve values for precision-recall curves are (baseline = 0.82, exercise = 0.98, sauna = 0.80, cold pressor/breath hold = 0.73, surgical pressors = 0.93).

References

    1. Heidenreich PA et al. 2022 AHA/ACC/HFSA guideline for the management of heart failure: a report of the American College of Cardiology/American Heart Association Joint Committee on Clinical Practice Guidelines. J. Am. Coll. Cardiol. 79, e263–e421 (2022). - PubMed
    1. January CT et al. 2019 AHA/ACC/HRS focused update of the 2014 AHA/ACC/HRS guideline for the management of patients with atrial fibrillation: a report of the American College of Cardiology/American Heart Association Task Force on Clinical Practice Guidelines and the Heart Rhythm Society in Collaboration With the Society of Thoracic Surgeons. Circulation 140, e125–e151 (2019). - PubMed
    1. Truby LK & Rogers JG Advanced heart failure: epidemiology, diagnosis, and therapeutic approaches. Heart Fail. 8, 523–536 (2020). - PubMed
    1. Pinsky MR & Payen D Functional hemodynamic monitoring. Crit. Care 9, 566–572 (2005). - PMC - PubMed
    1. Teboul JL et al. Less invasive hemodynamic monitoring in critically ill patients. Intensive Care Med. 42, 1350–1359 (2016). - PubMed

Publication types