Randomized Controlled Trial
. 2023 Oct 2;13(1):16557.
doi: 10.1038/s41598-023-43572-2.

Moisture mitigation using a vented liner and a vented socket system for individuals with transfemoral amputation

Affiliations
Randomized Controlled Trial

Moisture mitigation using a vented liner and a vented socket system for individuals with transfemoral amputation

Surya C Gnyawali et al. Sci Rep. .

Abstract

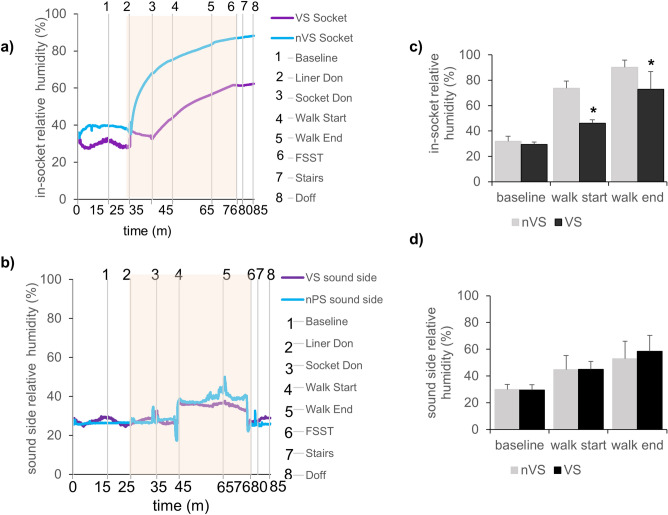
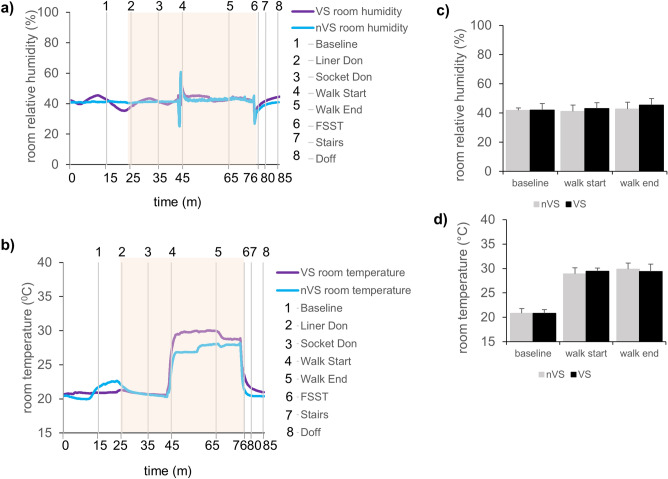
Sweating and heat buildup at the skin-liner interface is a major challenge for persons with limb loss. Liners made of heat-non-conducting materials may cause sweating of the residual limb and may result in liners slipping off the skin surface especially on a warm day or during high activity, causing skin breakdown and affecting limb health. To address this, we evaluated the efficacy of the vented liner-socket system (VS, Össur) compared to Seal-In silicone liner and non-vented socket (nVS, Össur) in reducing relative humidity (RH) during increased sweat. Nine individuals with limb loss using nVS were randomized to VS or nVS and asked for activity in a 20-min treadmill walk. RH was significantly attenuated (p = 0.0002) and perceived sweating, as reported by prosthesis users, improved (p = 0.028) with VS, patient-reported comprehensive lower limb amputee socket survey (CLASS) outcomes to determine the suspension, stability, and comfort were not significantly different between VS and nVS. There are limited rigorous scientific studies that clearly provide evidence-based guidelines to the prosthetist in the selection of liners from numerous available options. The present study is innovative in clearly establishing objective measures for assessing humidity and temperatures at the skin-liner interface while performing activity. As shown by the measured data and perceived sweat scores provided by the subjects based on their daily experience, this study provided clear evidence establishing relative humidity at the skin-liner interface is reduced with the use of a vented liner-socket system when compared to a similar non-vented system.


Conflict of interest statement

There is no financial and institutional conflict of interest to the SCG, JD, BH, LDT, SG, CKS and SR. JVK, MSR, KL are employees of Össur ehf.

Figures

Figure 1
Figure 1
Components of vented liner-socket system used in the study. (1-1a-i) The full outer and cross-sectional view of the vented silicon liner, (1-1a-ii) the vented TF socket components, (1-1b) MSR data logger, a device that records relative humidity and temperature from limbs (left). Twin sensors were placed on the sound limb (center panel) and on the residual limb (right panel). The sensors were placed on limbs and secured with breathable sticky medical tape ensuring the sensor window facing away from the skin to prevent saturation of the sensor. Study design and activities. (1-2c) Visit 1- patient consenting, conventional and investigational socket fitting and randomization was performed. Visit 2A–2B-included crossover design from randomized vented liner/vented socket solution (VS) or non-vented liner socket solution (nVS) groups followed by fitting back to conventional system in visit 3. (1-2d) Schematic timeline of measurements of temperature and relative humidity during activities: resting, liner and socket donning, treadmill walk, four square step tests (FSST), and stair walk. The study room was maintained at temperature (T): 21 °C ± 1 °C, humidity (H): 41% ± 6%. The activities (red shaded) were performed in an environmentally controlled room maintained at T: 28 °C ± 2 °C, H: 54% ± 6%.
Figure 2
Figure 2
Reduction in relative humidity measurements on the skin liner interface following activity. (a, b) Representative relative humidity plot (a) from residual or (b) sound limb of the same individual. Blue line present data from nVS while the purple line presents the VS system. Gray vertical lines show the time events during study. 1-baseline, 2-liner don, 3-socket don, 4-walk start, 5-walk end and resting, 6-four square step test (FSST), 7-walking on stairs, and 8-doff the socket-liner obtained for data set for 1 h and 25 min. Data presented mean ± SD, n = 9, *p < 0.05. nVS = non-vented liner socket solution, VS = vented liner/vented socket solution. (c, d) Bar graphs showing (c) residual limb or (d) sound side humidity in all patient visits. Bar graphs data showing mean environmental humidity measured on all patients during treadmill walk activity compared to baseline. Data presented mean ± SD, n = 9, *p < 0.05. nVS = non-vented liner socket solution, VS = vented liner socket solution.
Figure 3
Figure 3
Relative humidity and temperature of environment in the study room. (a, b) Representative relative humidity/temperature data plots (a) environmental humidity or (b) environmental temperature. Blue lines represent data from nVS while purple lines represent the VS system. Gray vertical lines show the time events during study. 1-baseline, 2-liner don, 3-socket don, 4-walk start, 5-walk end and resting, 6- four square step test (FSST), 7- walking on stairs, and 8-doff the socket-liner obtained for data set for 1 h and 25 min. Light orange background on the representative plots indicates the activity time zone. (c, d) Bar graph showing (c) environmental humidity or (d) environmental temperature in all patient visits. Bar graph data showing mean environmental humidity measured on all patients during treadmill walk activity compared to baseline. Data presented mean ± SD, n = 9, *p < 0.05. nVS = non-vented liner socket solution, VS = vented liner socket solution.
Figure 4
Figure 4
The reduction in mean relative humidity by VS in the residual limb normalized to sound limb. (a) The representative area-under-the curve (AUC) used to measure changes in overall levels of relative humidity (RH) for the duration of all activities. The AUC was calculated using locally written MATLAB® code. Relative humidity data from VS or nVS sockets were normalized with the respective sound side limb data. The shaded area represents AUC during the activity time (50 min) of the study. (b) The normalized RH from all subjects (mean, red or green) in nVS or VS group data are color-coded. Data from (b) using Eq. (3) were used to derive the plot (c) which is a percent RH reduction by VS. Data presented as mean ± SD, n = 9, ** p = 0.0002. nVS = non-vented liner socket solution, VS = vented liner socket solution. The perceived sweat score from patient survey demonstrates significantly lower sweating in VS group as compared to nVS (c). Subjects rated their perceived sweat during activity on a scale from 1 to 10 where 1 is an extreme amount of sweat, and 10 is no sweat at all. Data presented as box blot of n = 9, *p = 0.038). nVS = non-vented liner socket solution, VS = vented liner socket solution, Per-Sw score = perceived sweat score.
Figure 5
Figure 5
Temperature changes during activity compared to baseline. Representative temperature plots (a) in-socket temperature of the residual limb or sound side temperature (b). Blue line represents data from nVS while pink line represents the VS system. Gray vertical lines show the time events during study. 1-baseline, 2-liner don, 3-socket don, 4-walk start, 5-walk end and resting, 6- four square step test (FSST), 7- walking on stairs, and 8-doff the socket-liner obtained for data set for 1 h and 25 min. Light orange background on the representative plots indicates the activity time zone. Bar graphs showing in-socket temperature (c) or sound side temperature (d) of all patients. Data showing mean temperature measured on all patients during treadmill walk activity compared to baseline. Data presented mean ± SD, n = 9, *p < 0.05. nVS = non-vented socket solution, VS = vented socket solution.

References

    1. Ziegler-Graham K, MacKenzie EJ, Ephraim PL, Travison TG, Brookmeyer R. Estimating the prevalence of limb loss in the United States: 2005 to 2050. Arch. Phys. Med. Rehabil. 2008;89:422–429. doi: 10.1016/j.apmr.2007.11.005. - DOI - PubMed
    1. Walker J, et al. Clinical outcome of transfemoral direct socket interface (part 2) Can. Prosthet. Orthot. J. 2021;4:36065. doi: 10.33137/cpoj.v4i1.36065. - DOI - PMC - PubMed
    1. Balk, E. M. et al. in Lower Limb Prostheses: Measurement Instruments, Comparison of Component Effects by Subgroups, and Long-Term Outcomes AHRQ Comparative Effectiveness Reviews (2018). - PubMed
    1. Karmarkar AM, et al. Prosthesis and wheelchair use in veterans with lower-limb amputation. J. Rehabil. Res. Dev. 2009;46:567–576. doi: 10.1682/jrrd.2008.08.0102. - DOI - PubMed
    1. Baars EC, Schrier E, Dijkstra PU, Geertzen JHB. Prosthesis satisfaction in lower limb amputees: A systematic review of associated factors and questionnaires. Medicine (Baltimore) 2018;97:e12296. doi: 10.1097/MD.0000000000012296. - DOI - PMC - PubMed

Publication types