. 2023 Oct;25(10):1506-1519.
doi: 10.1038/s41556-023-01241-6. Epub 2023 Oct 2.

Crosstalk between small-cell lung cancer cells and astrocytes mimics brain development to promote brain metastasis

Affiliations

Crosstalk between small-cell lung cancer cells and astrocytes mimics brain development to promote brain metastasis

Fangfei Qu et al. Nat Cell Biol. 2023 Oct.

Abstract

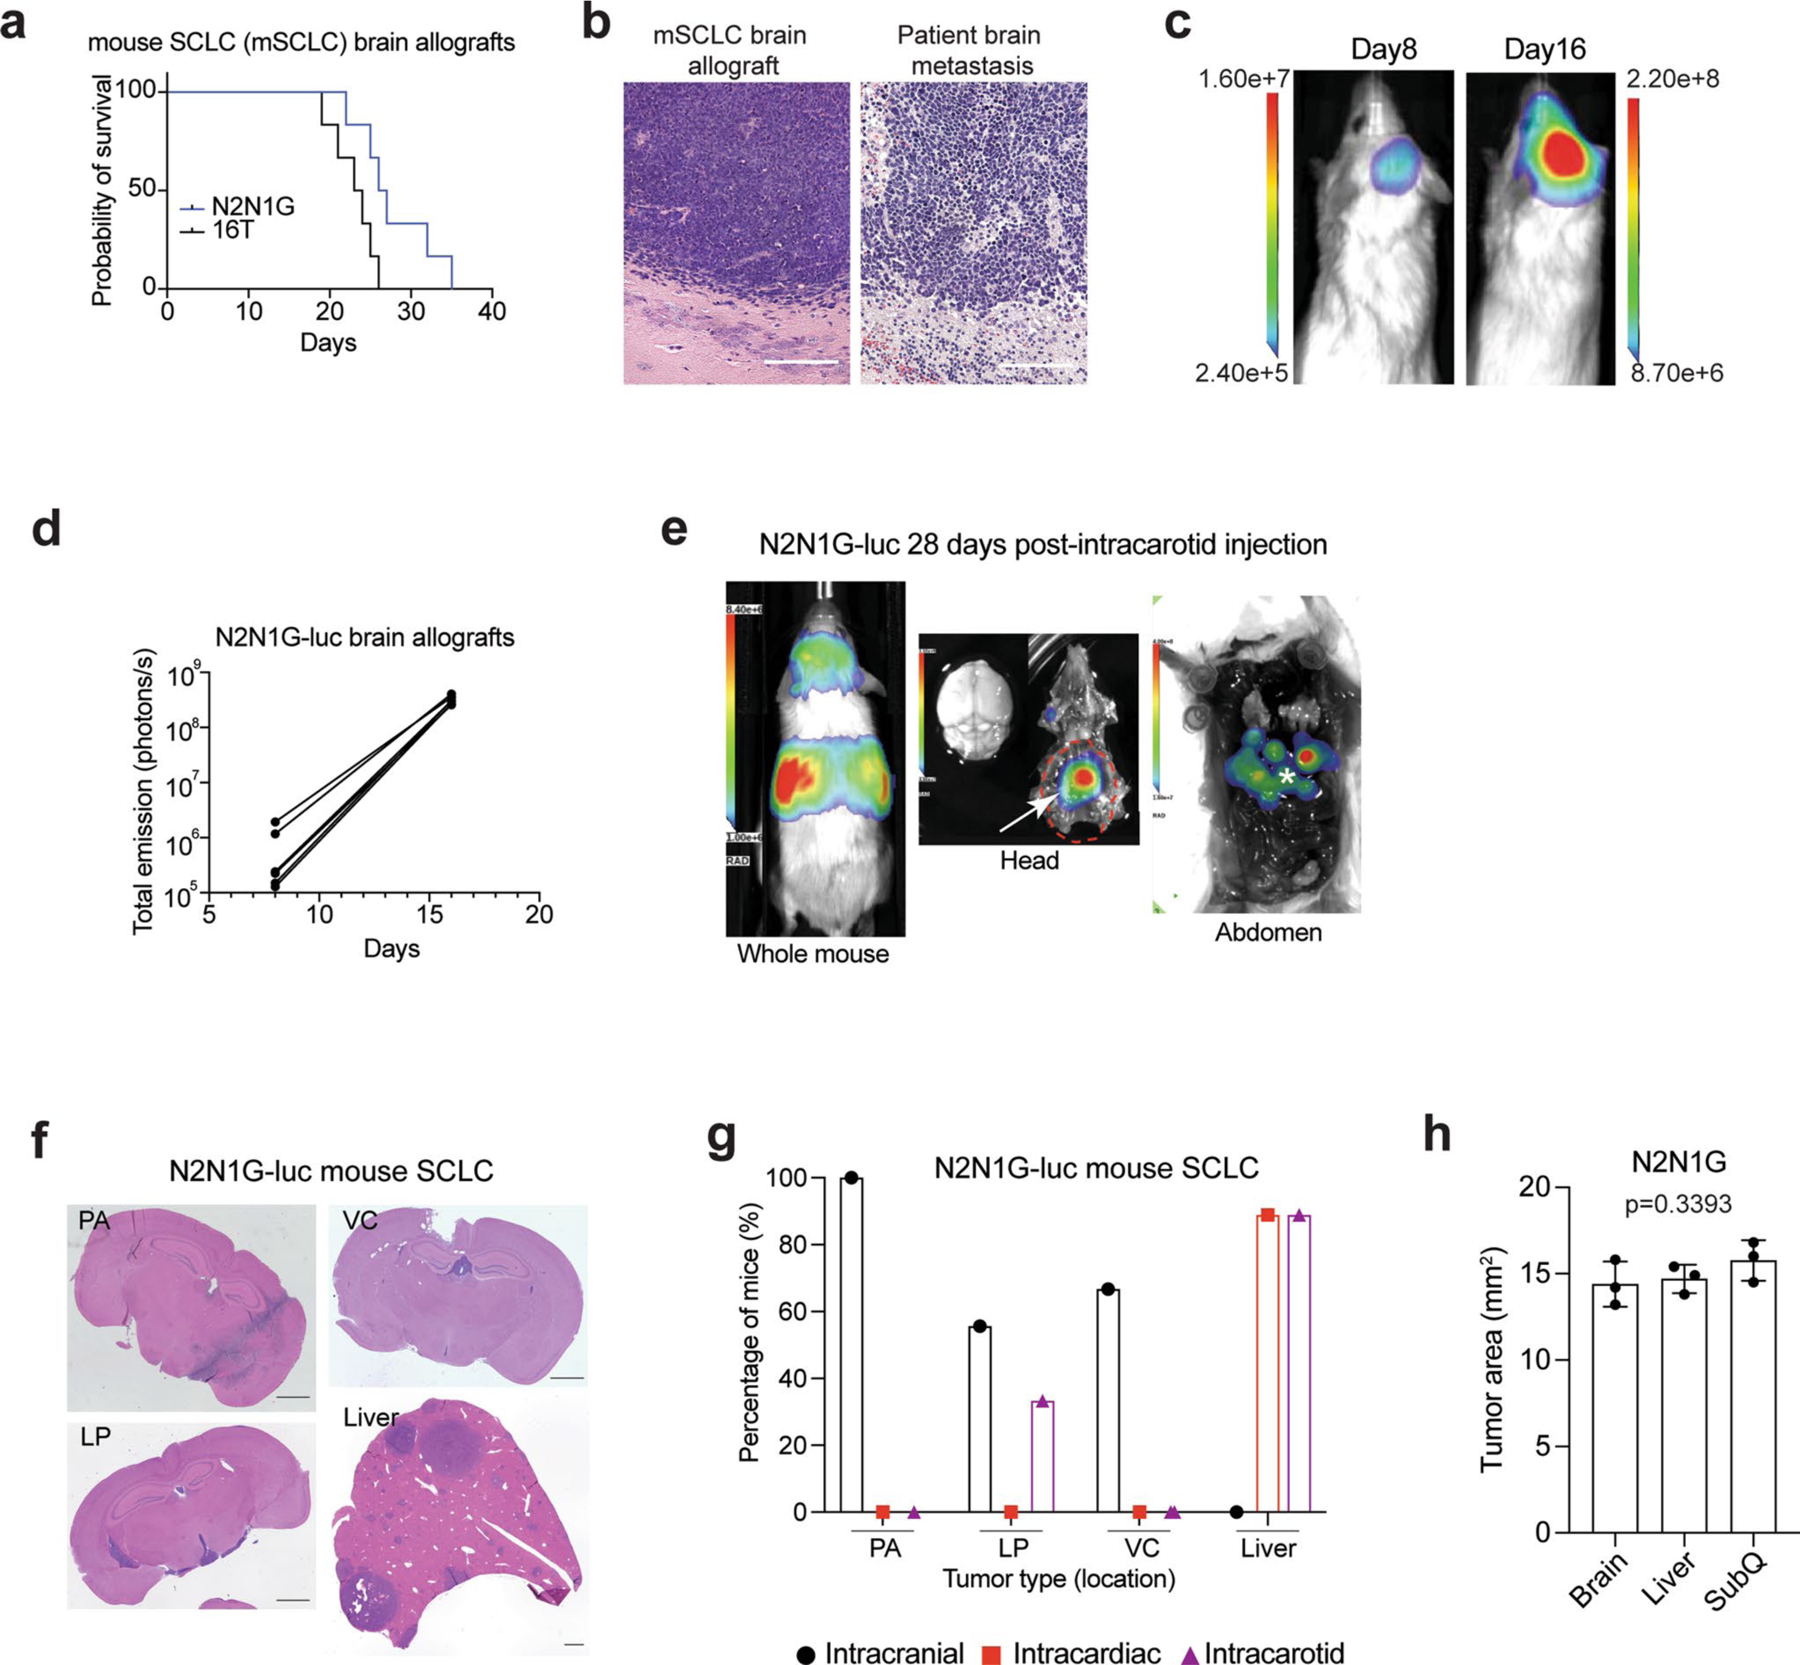
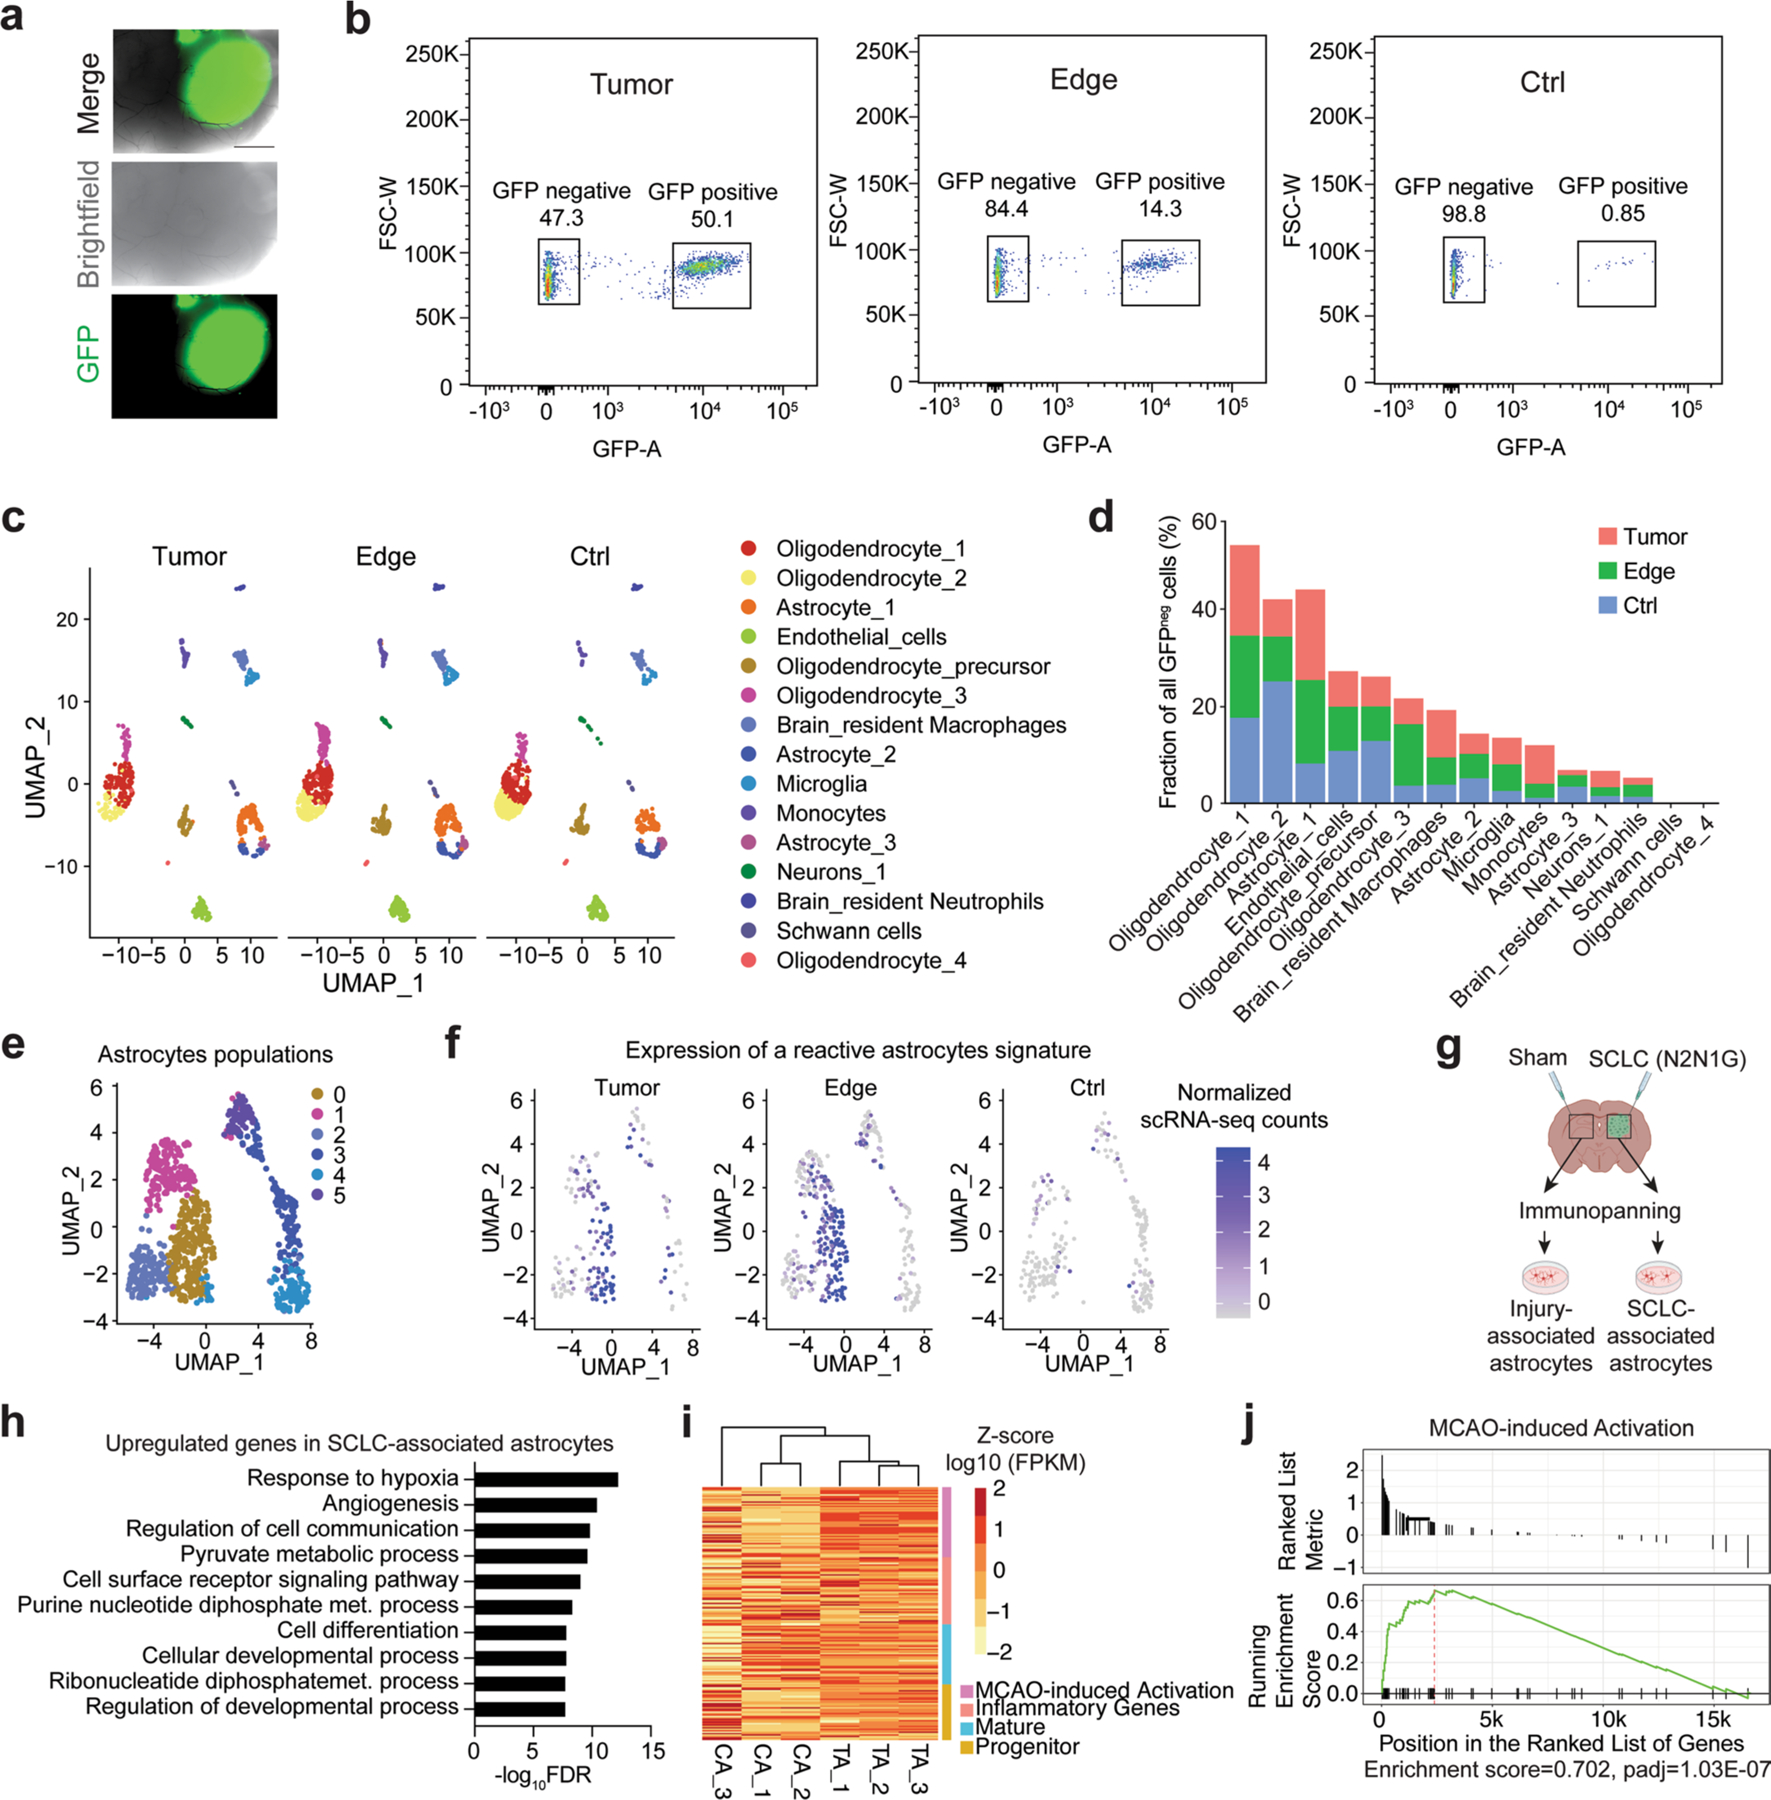
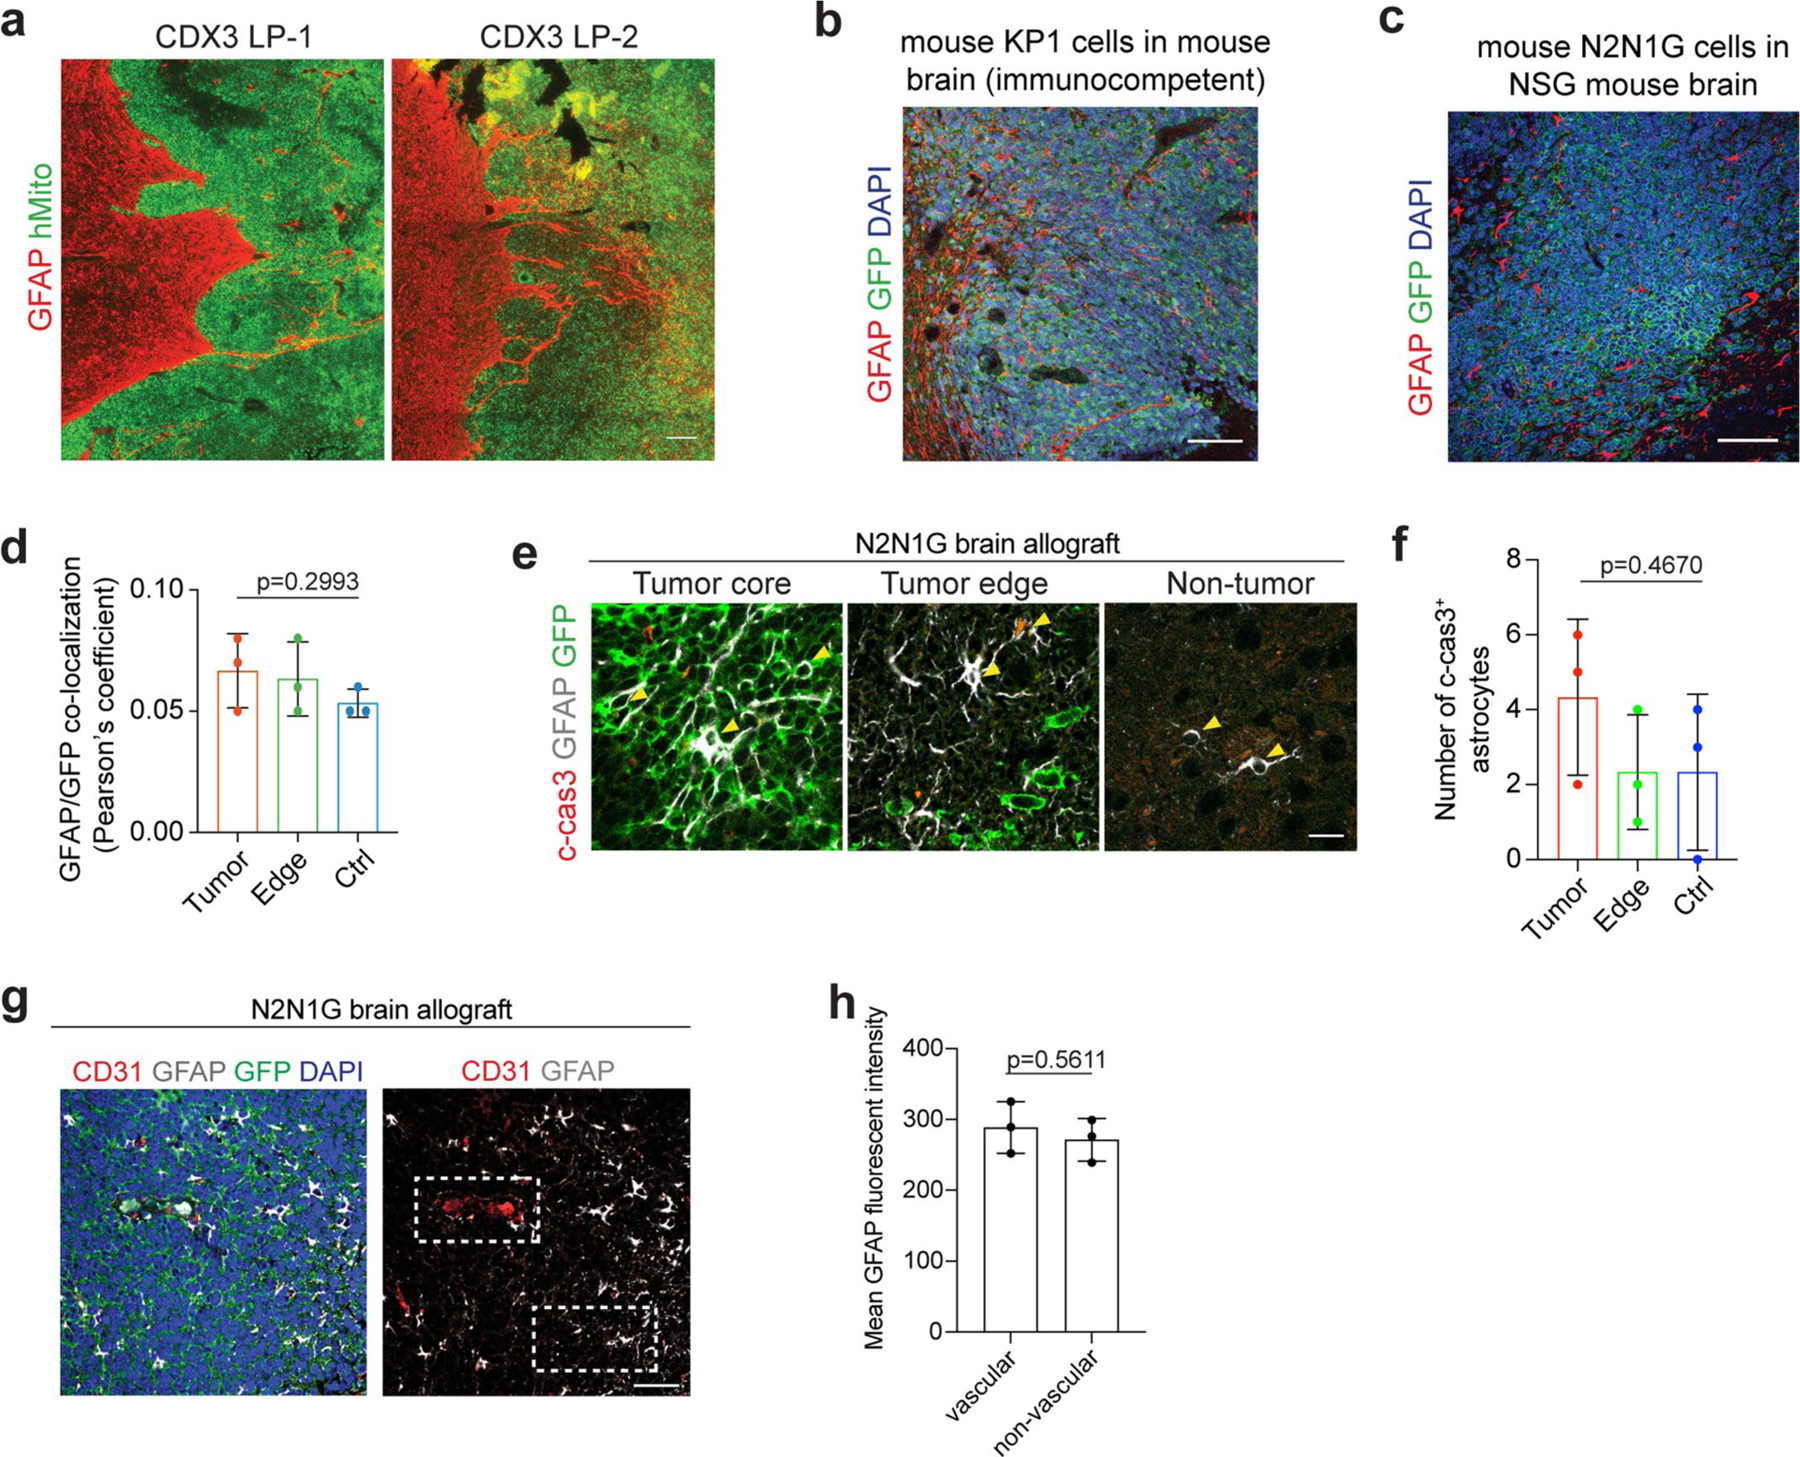
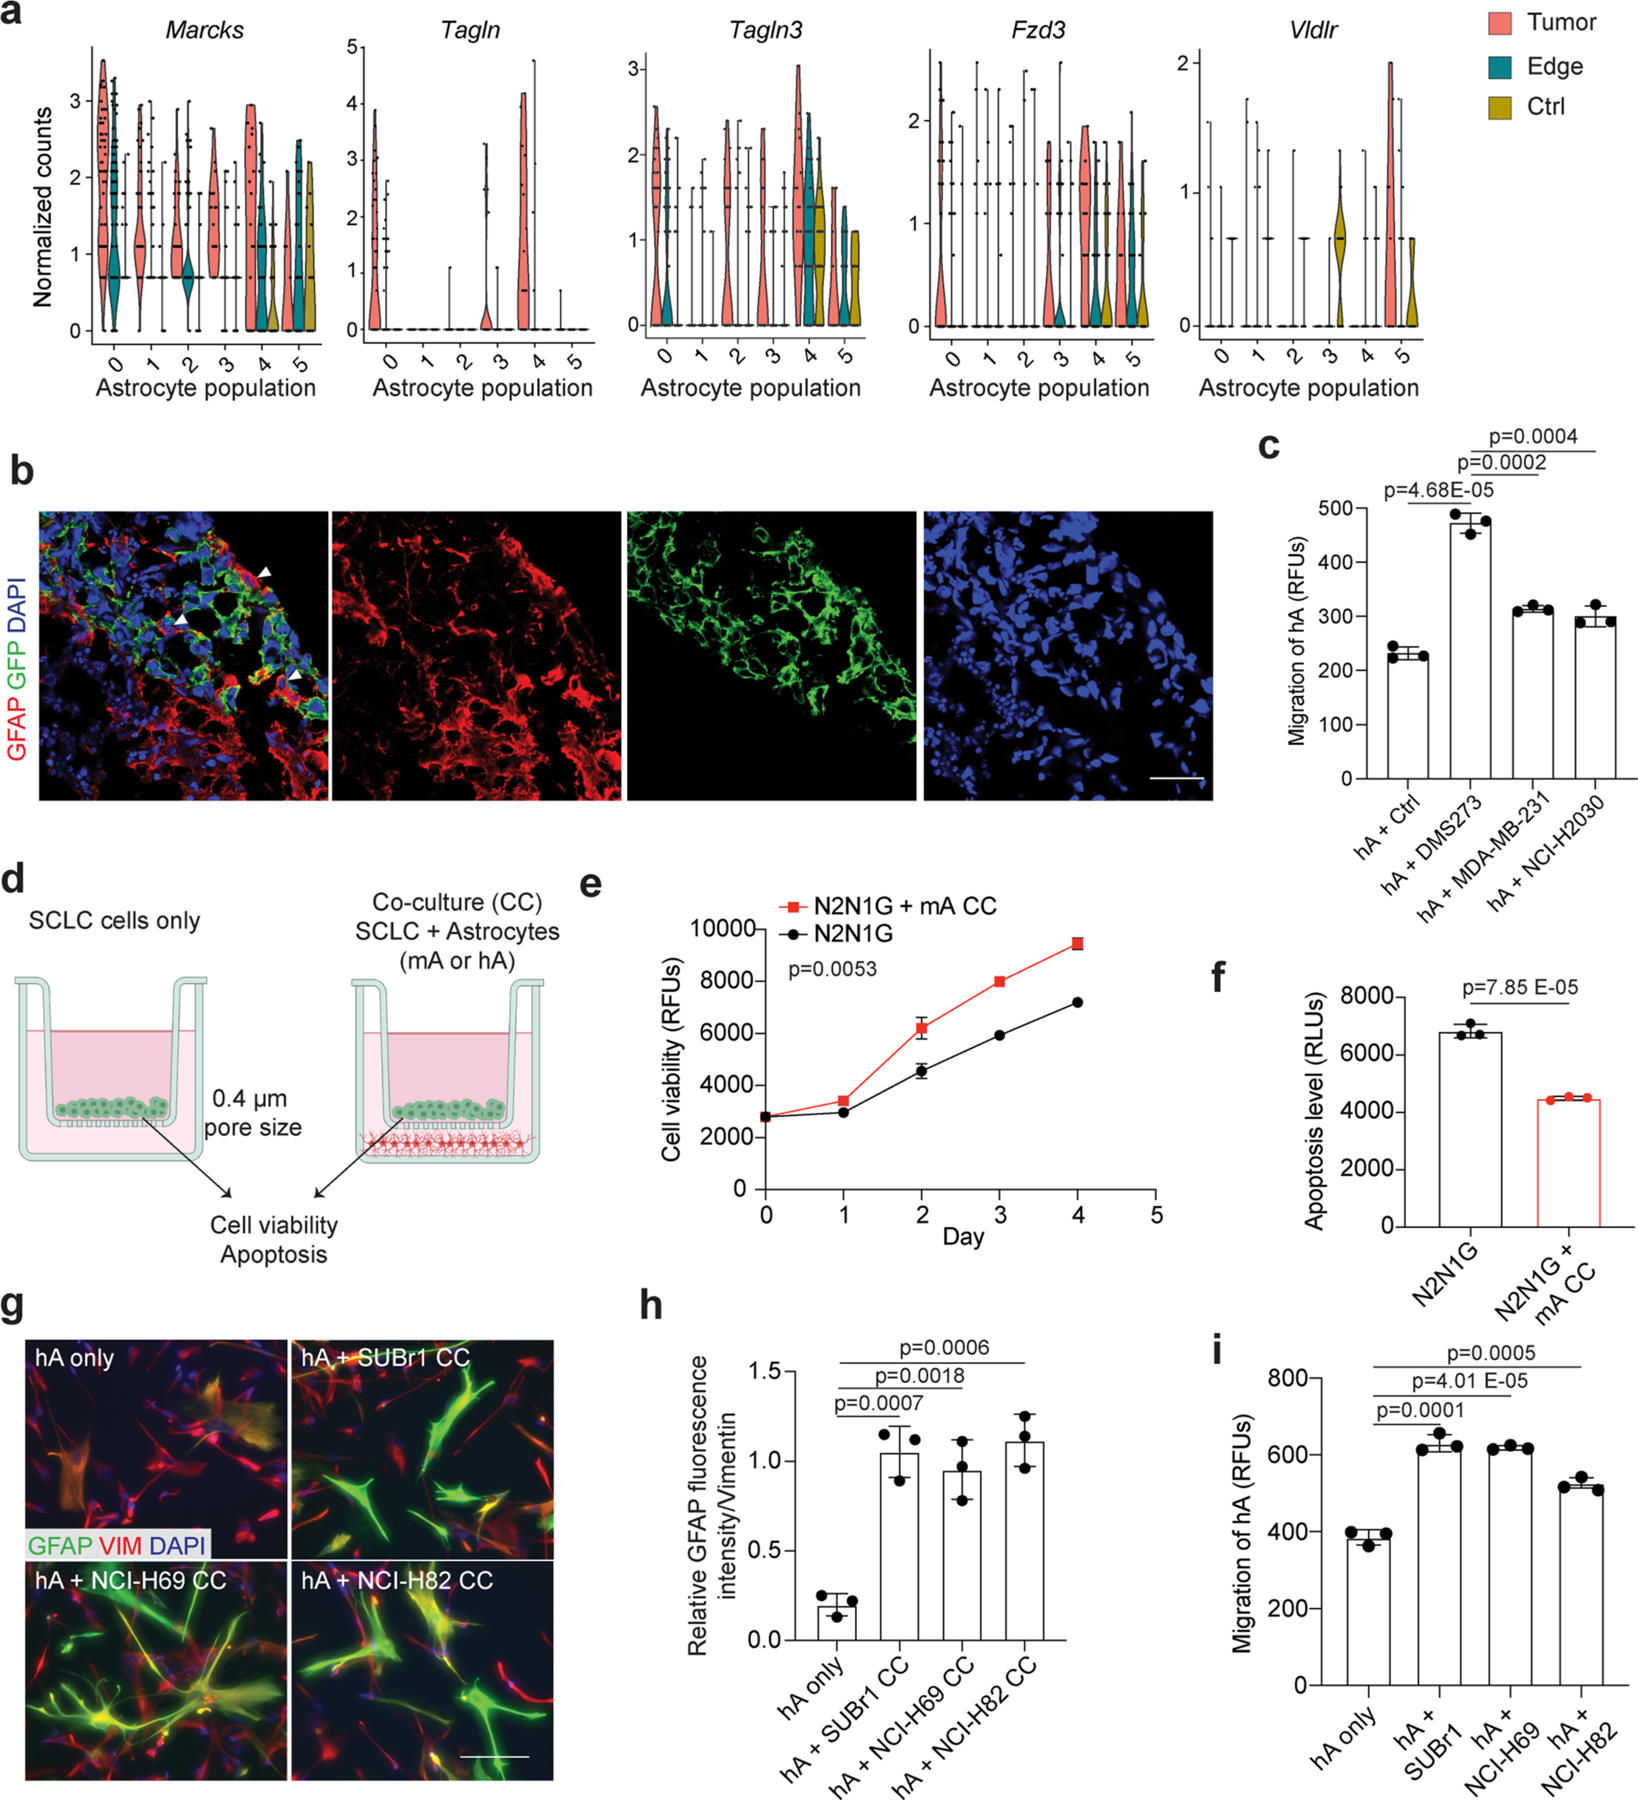
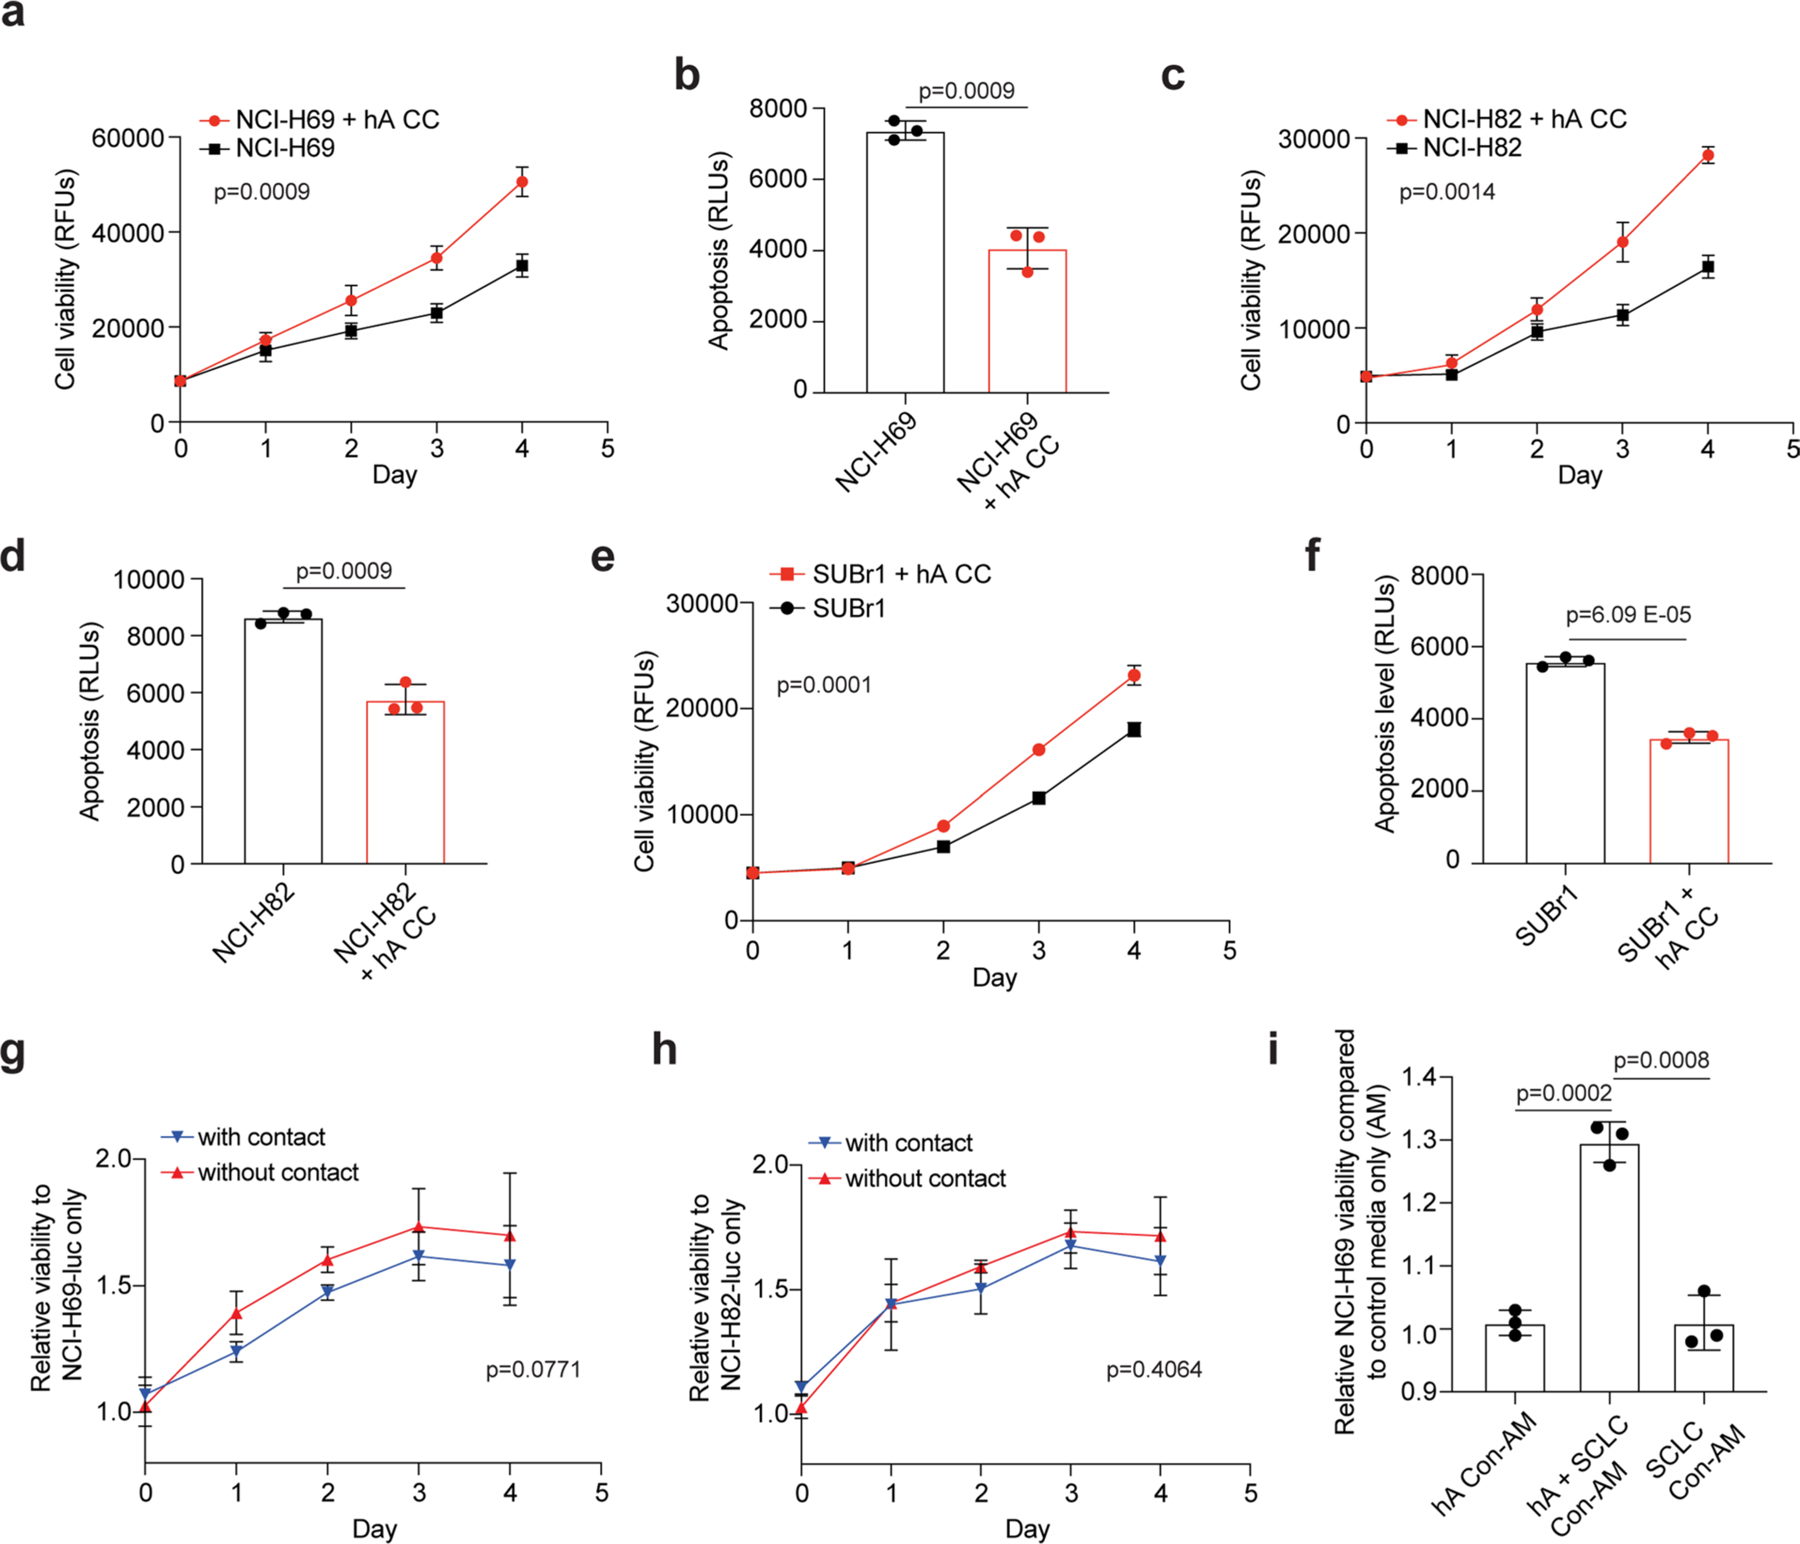
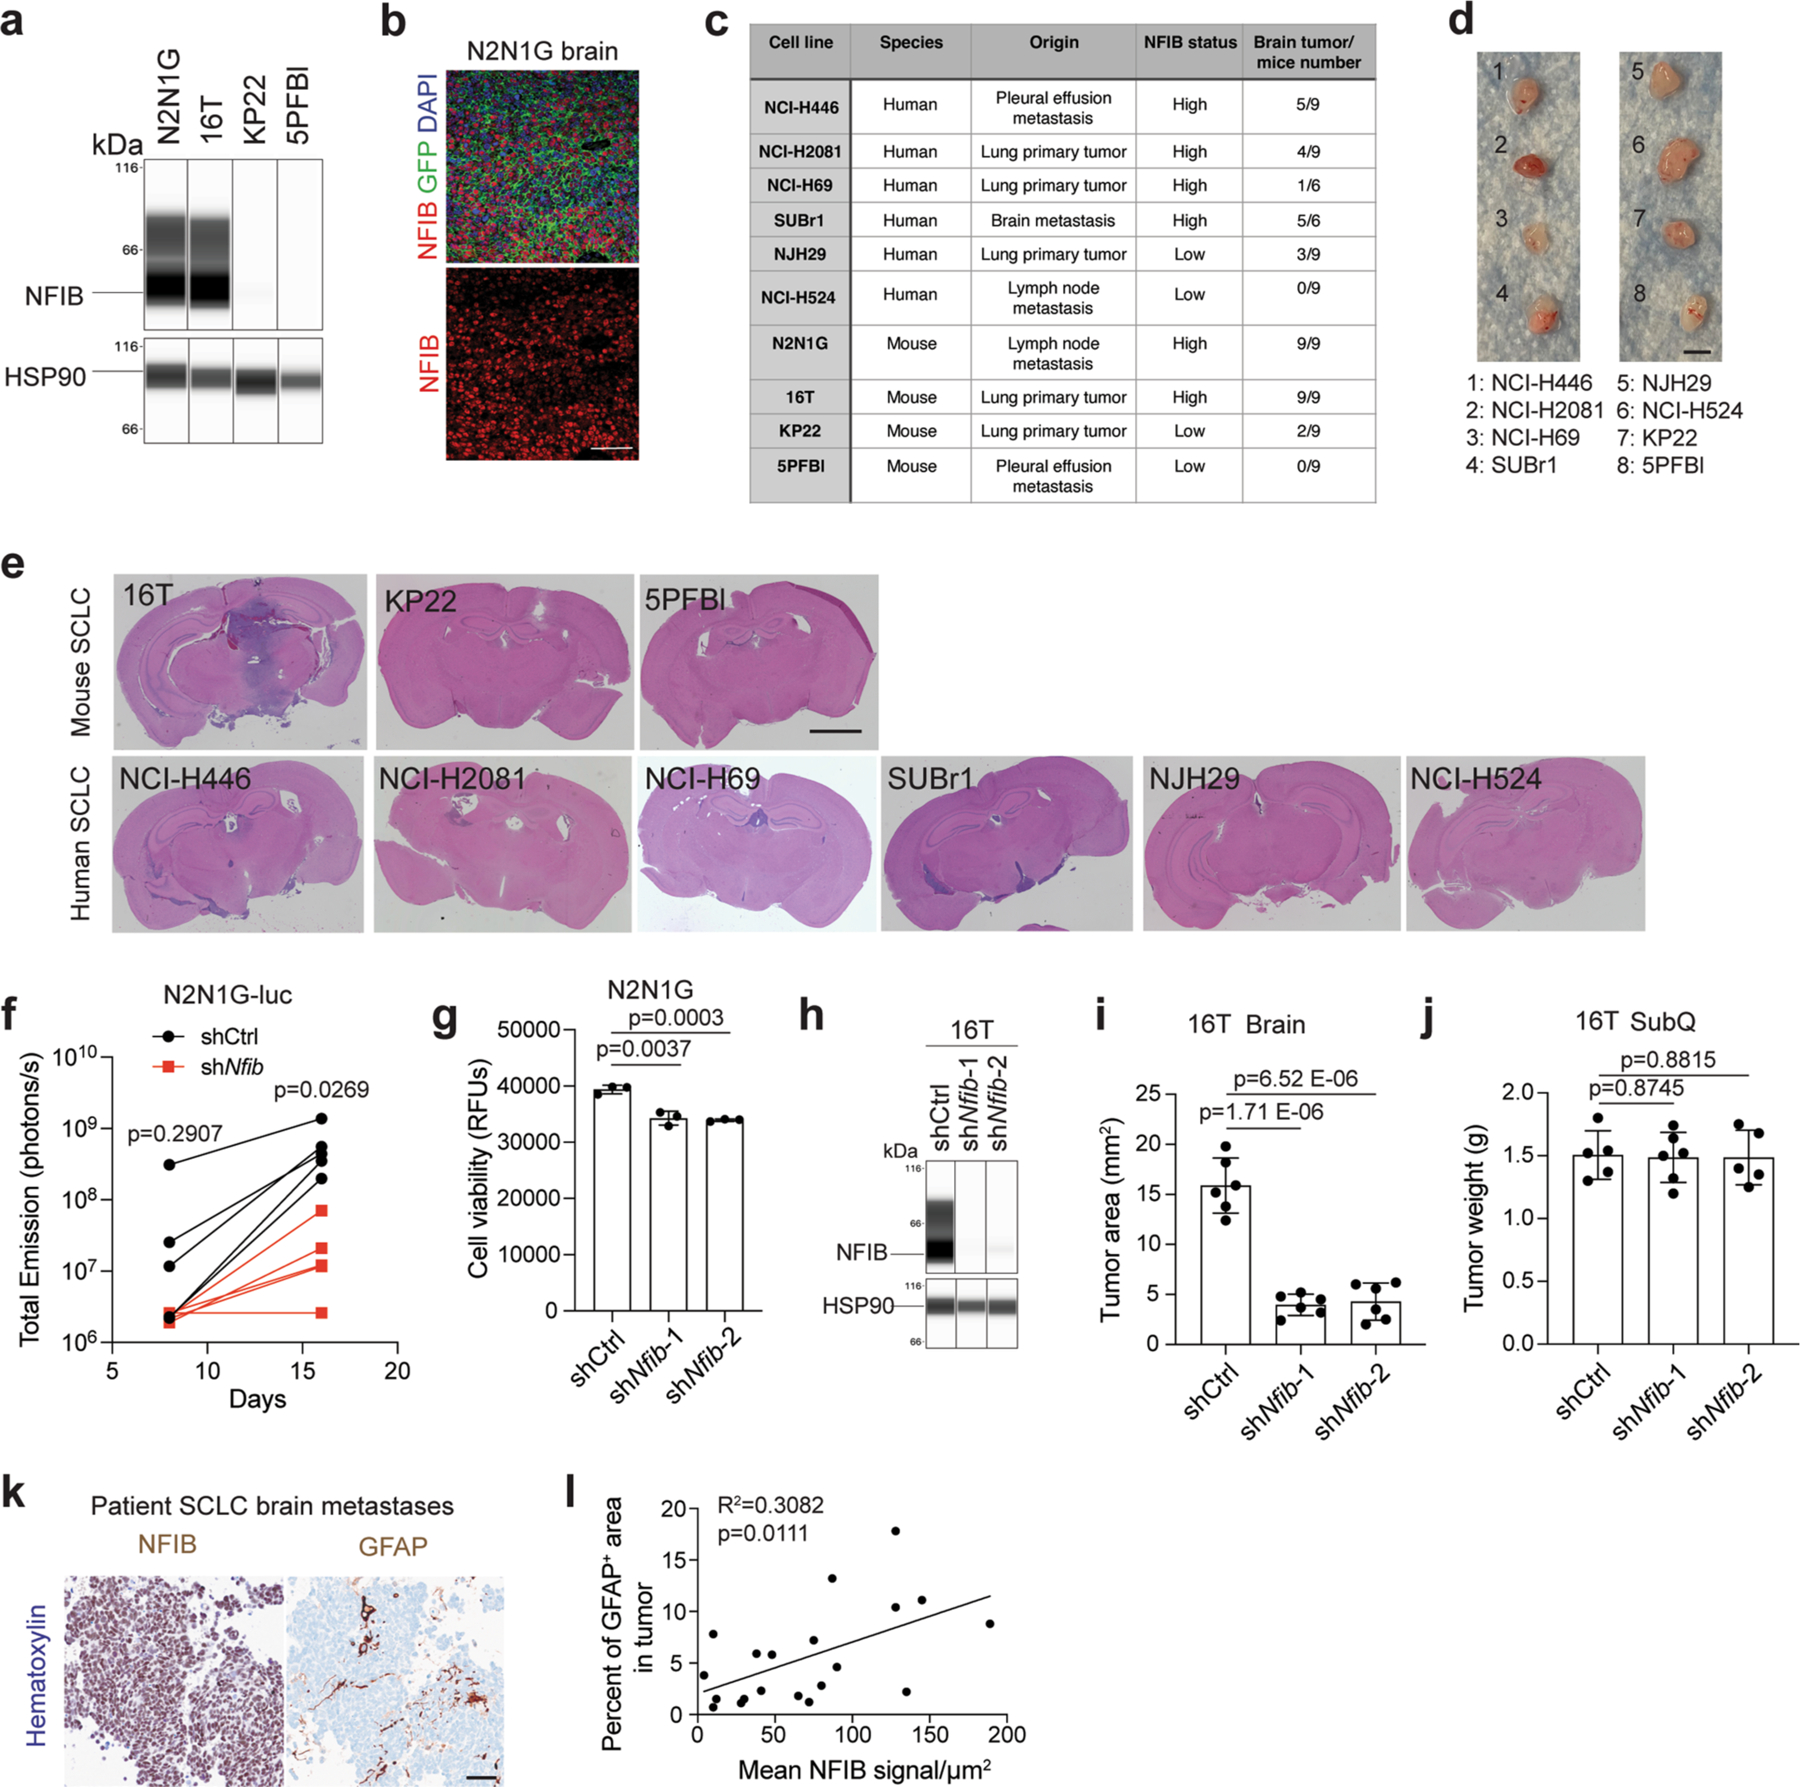
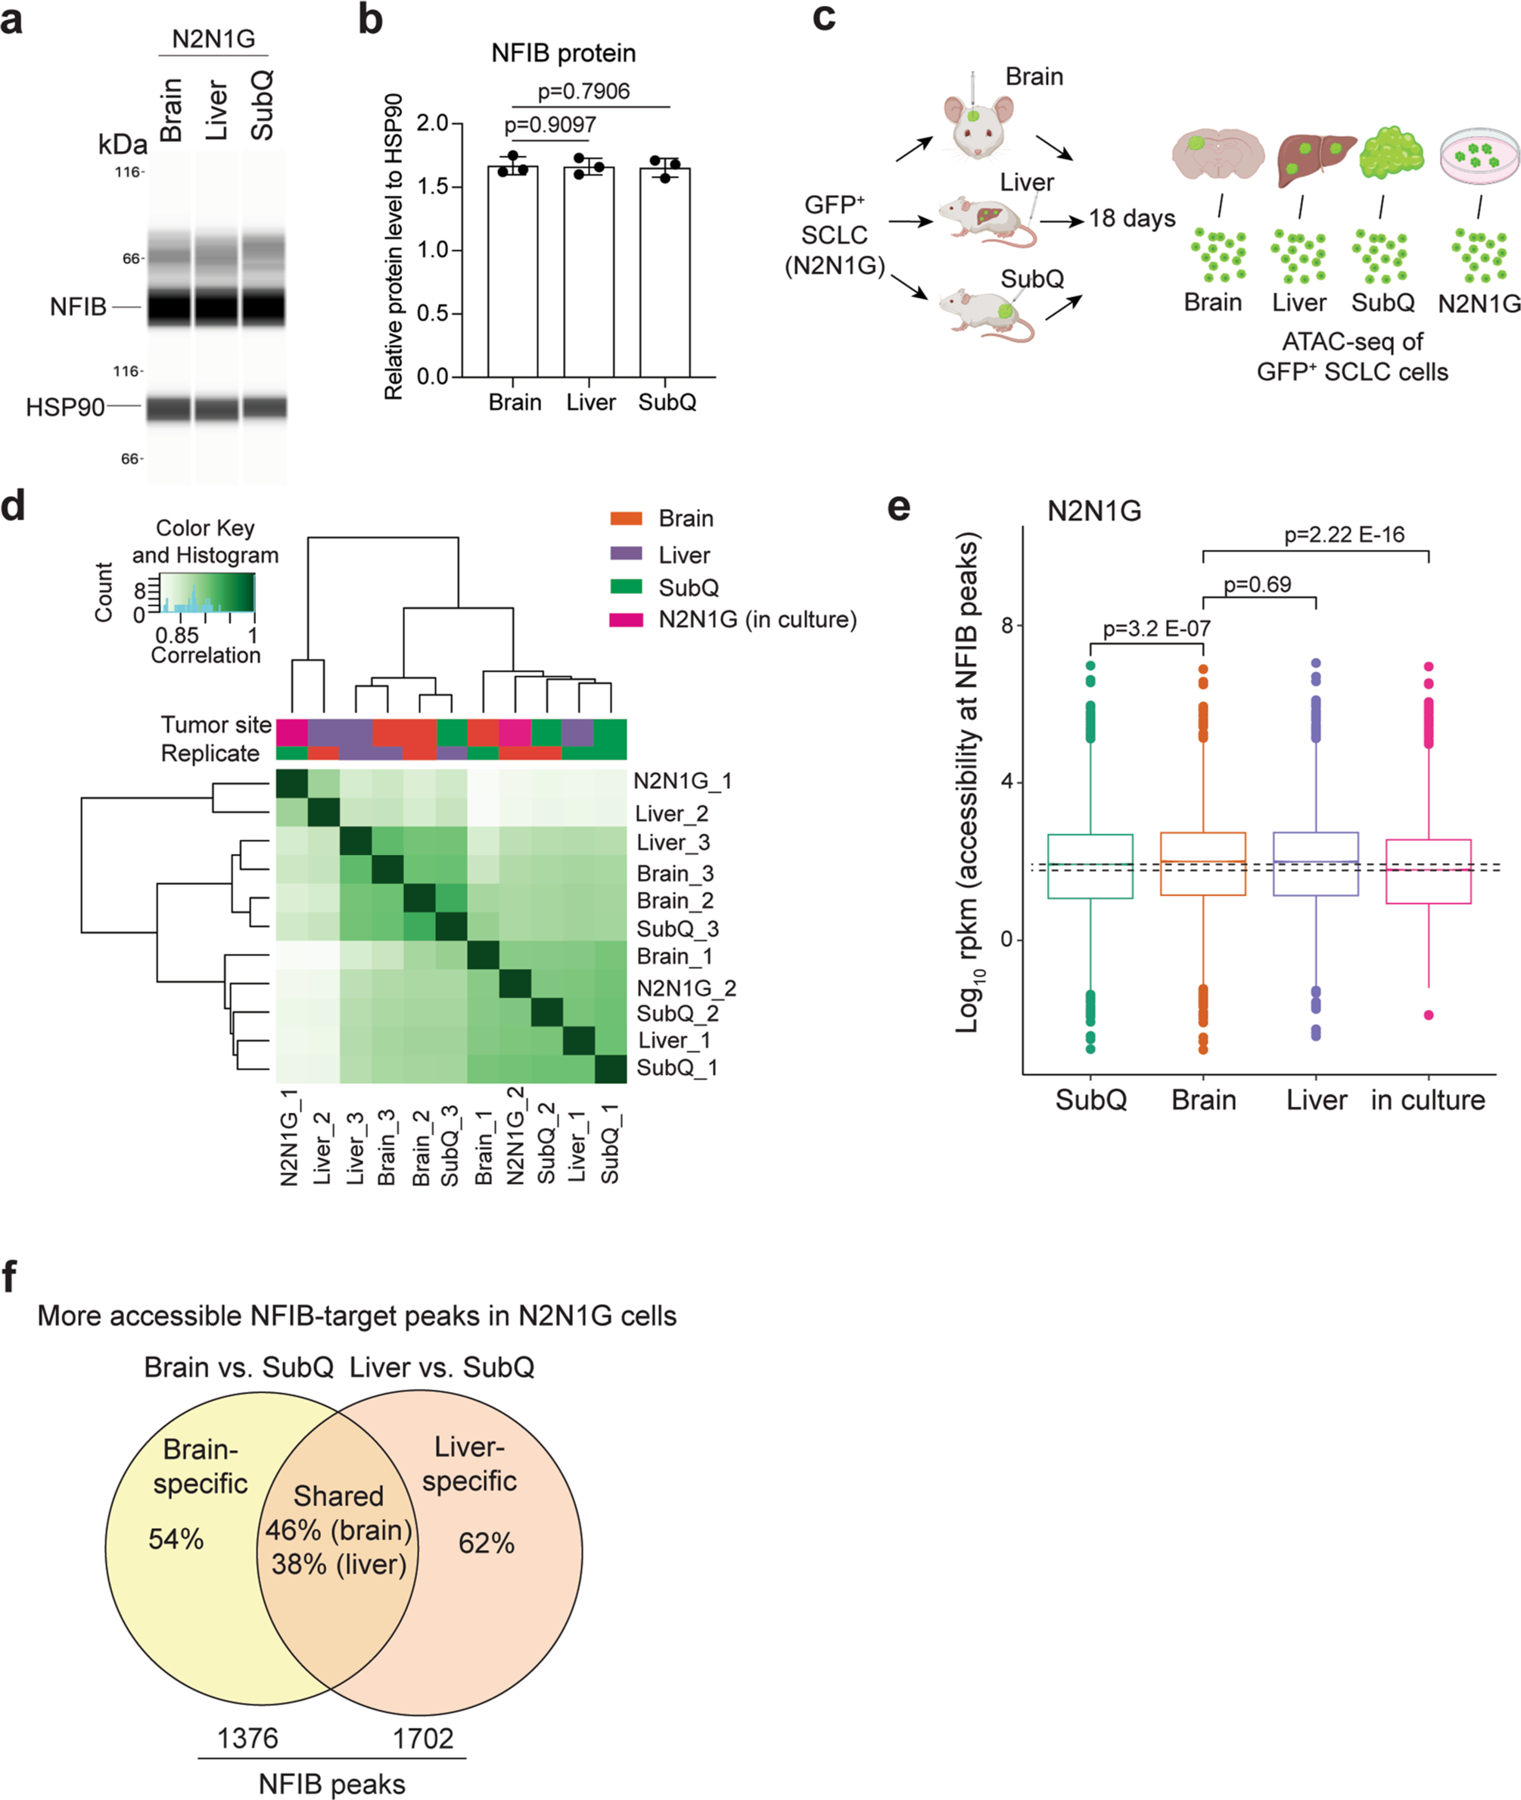
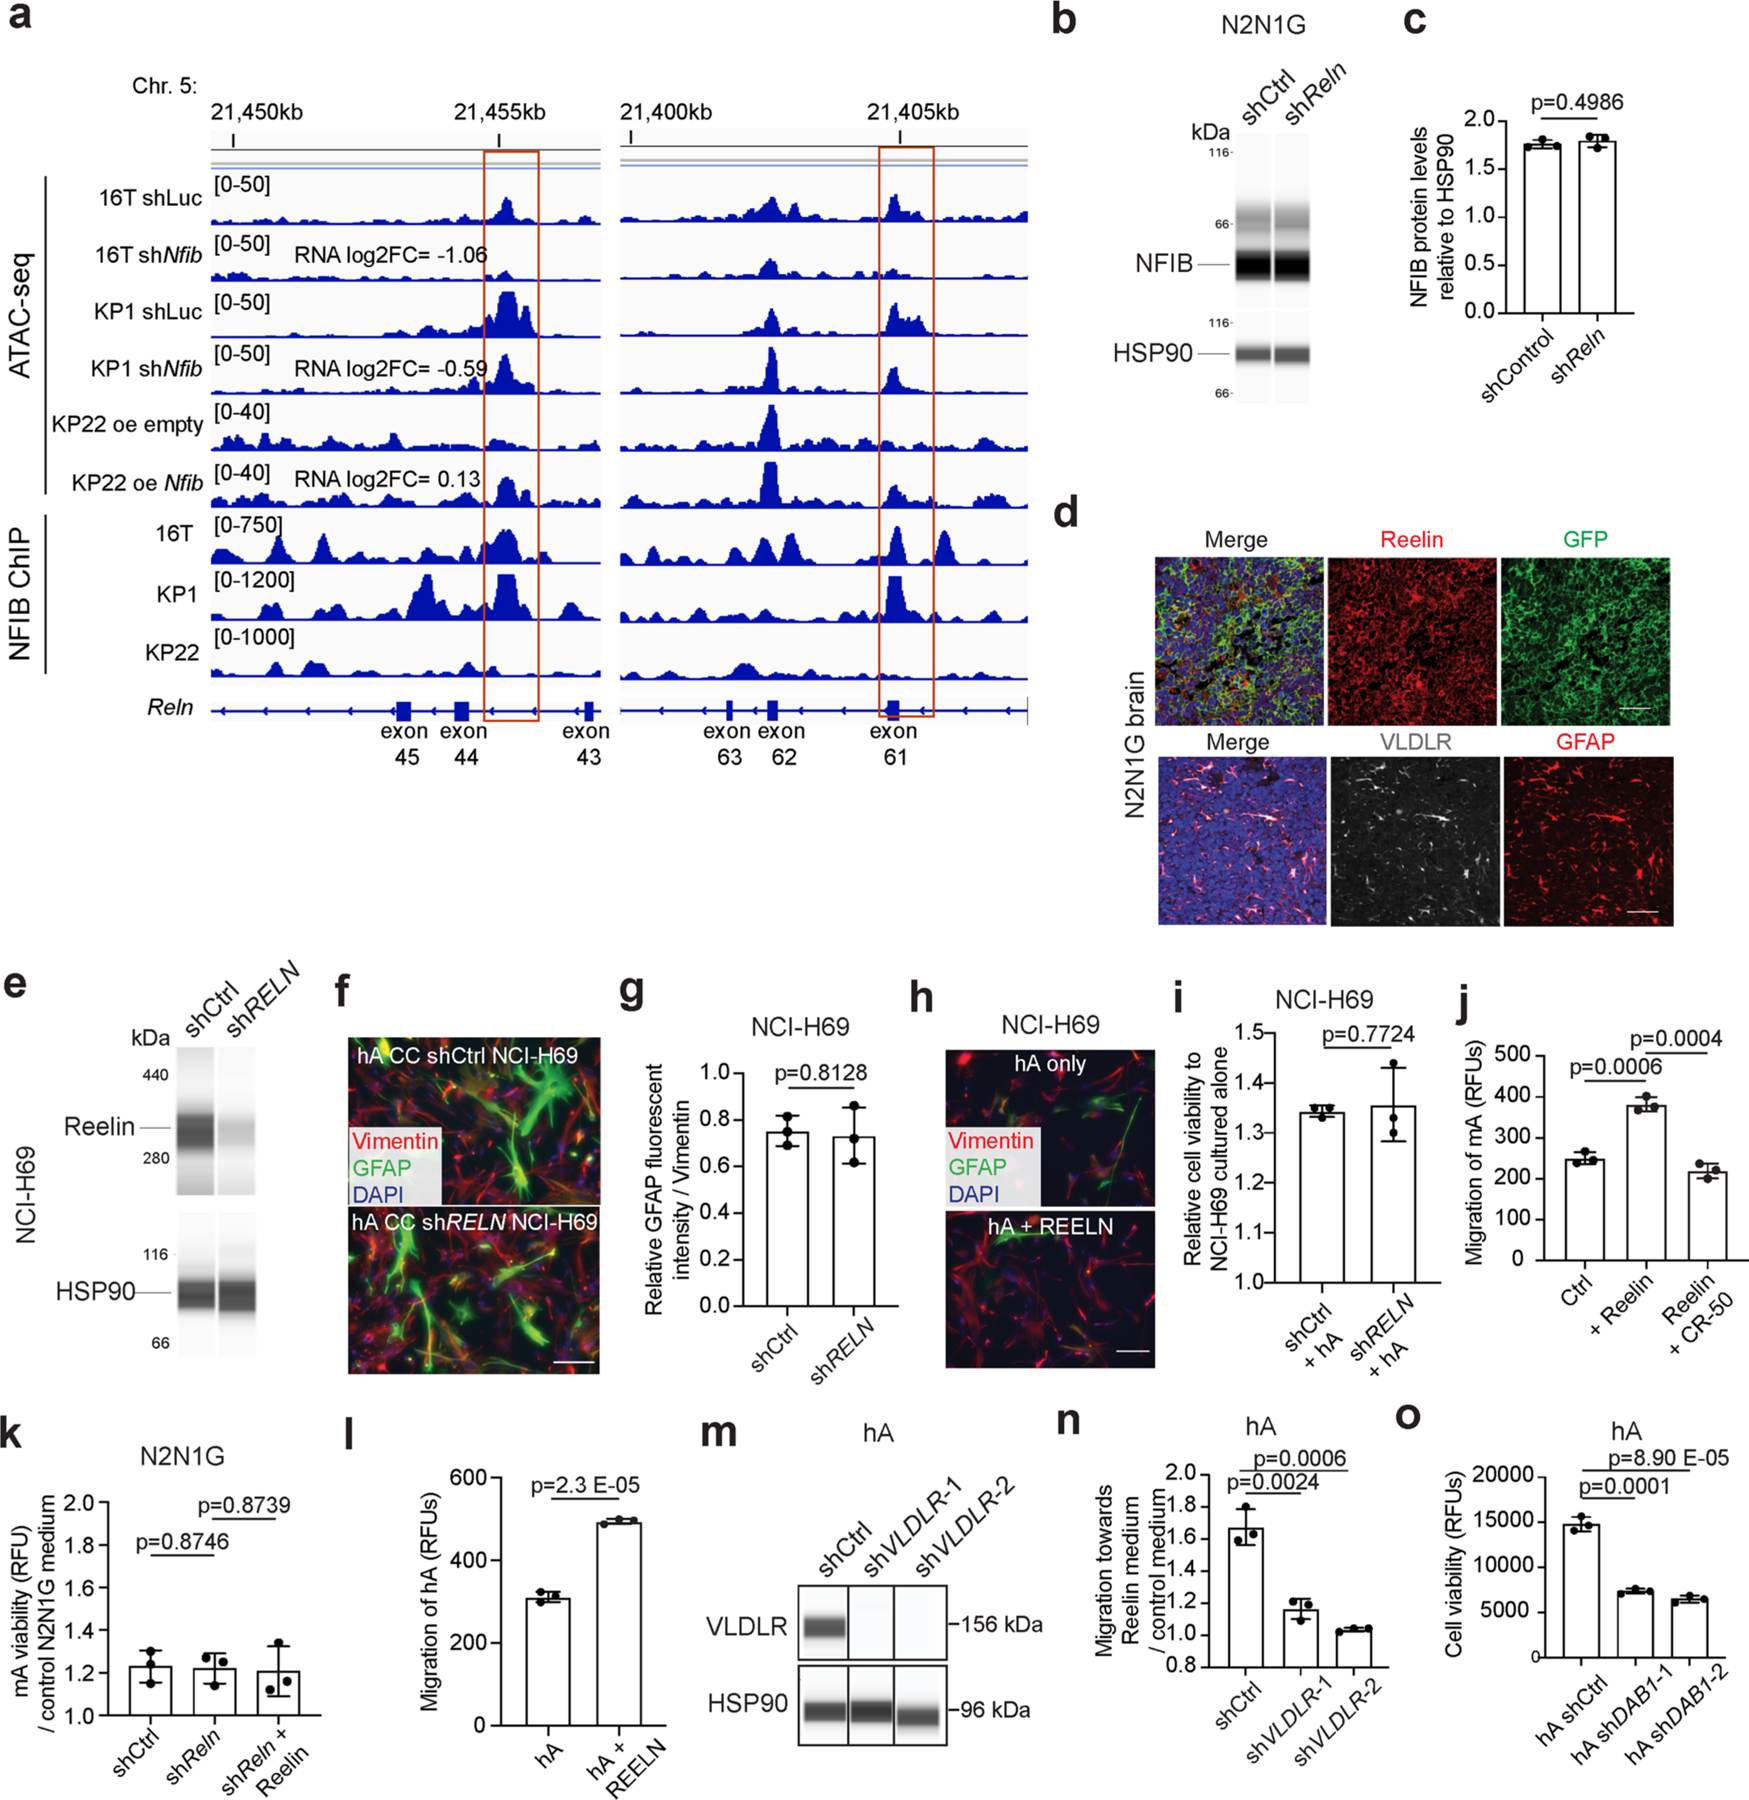
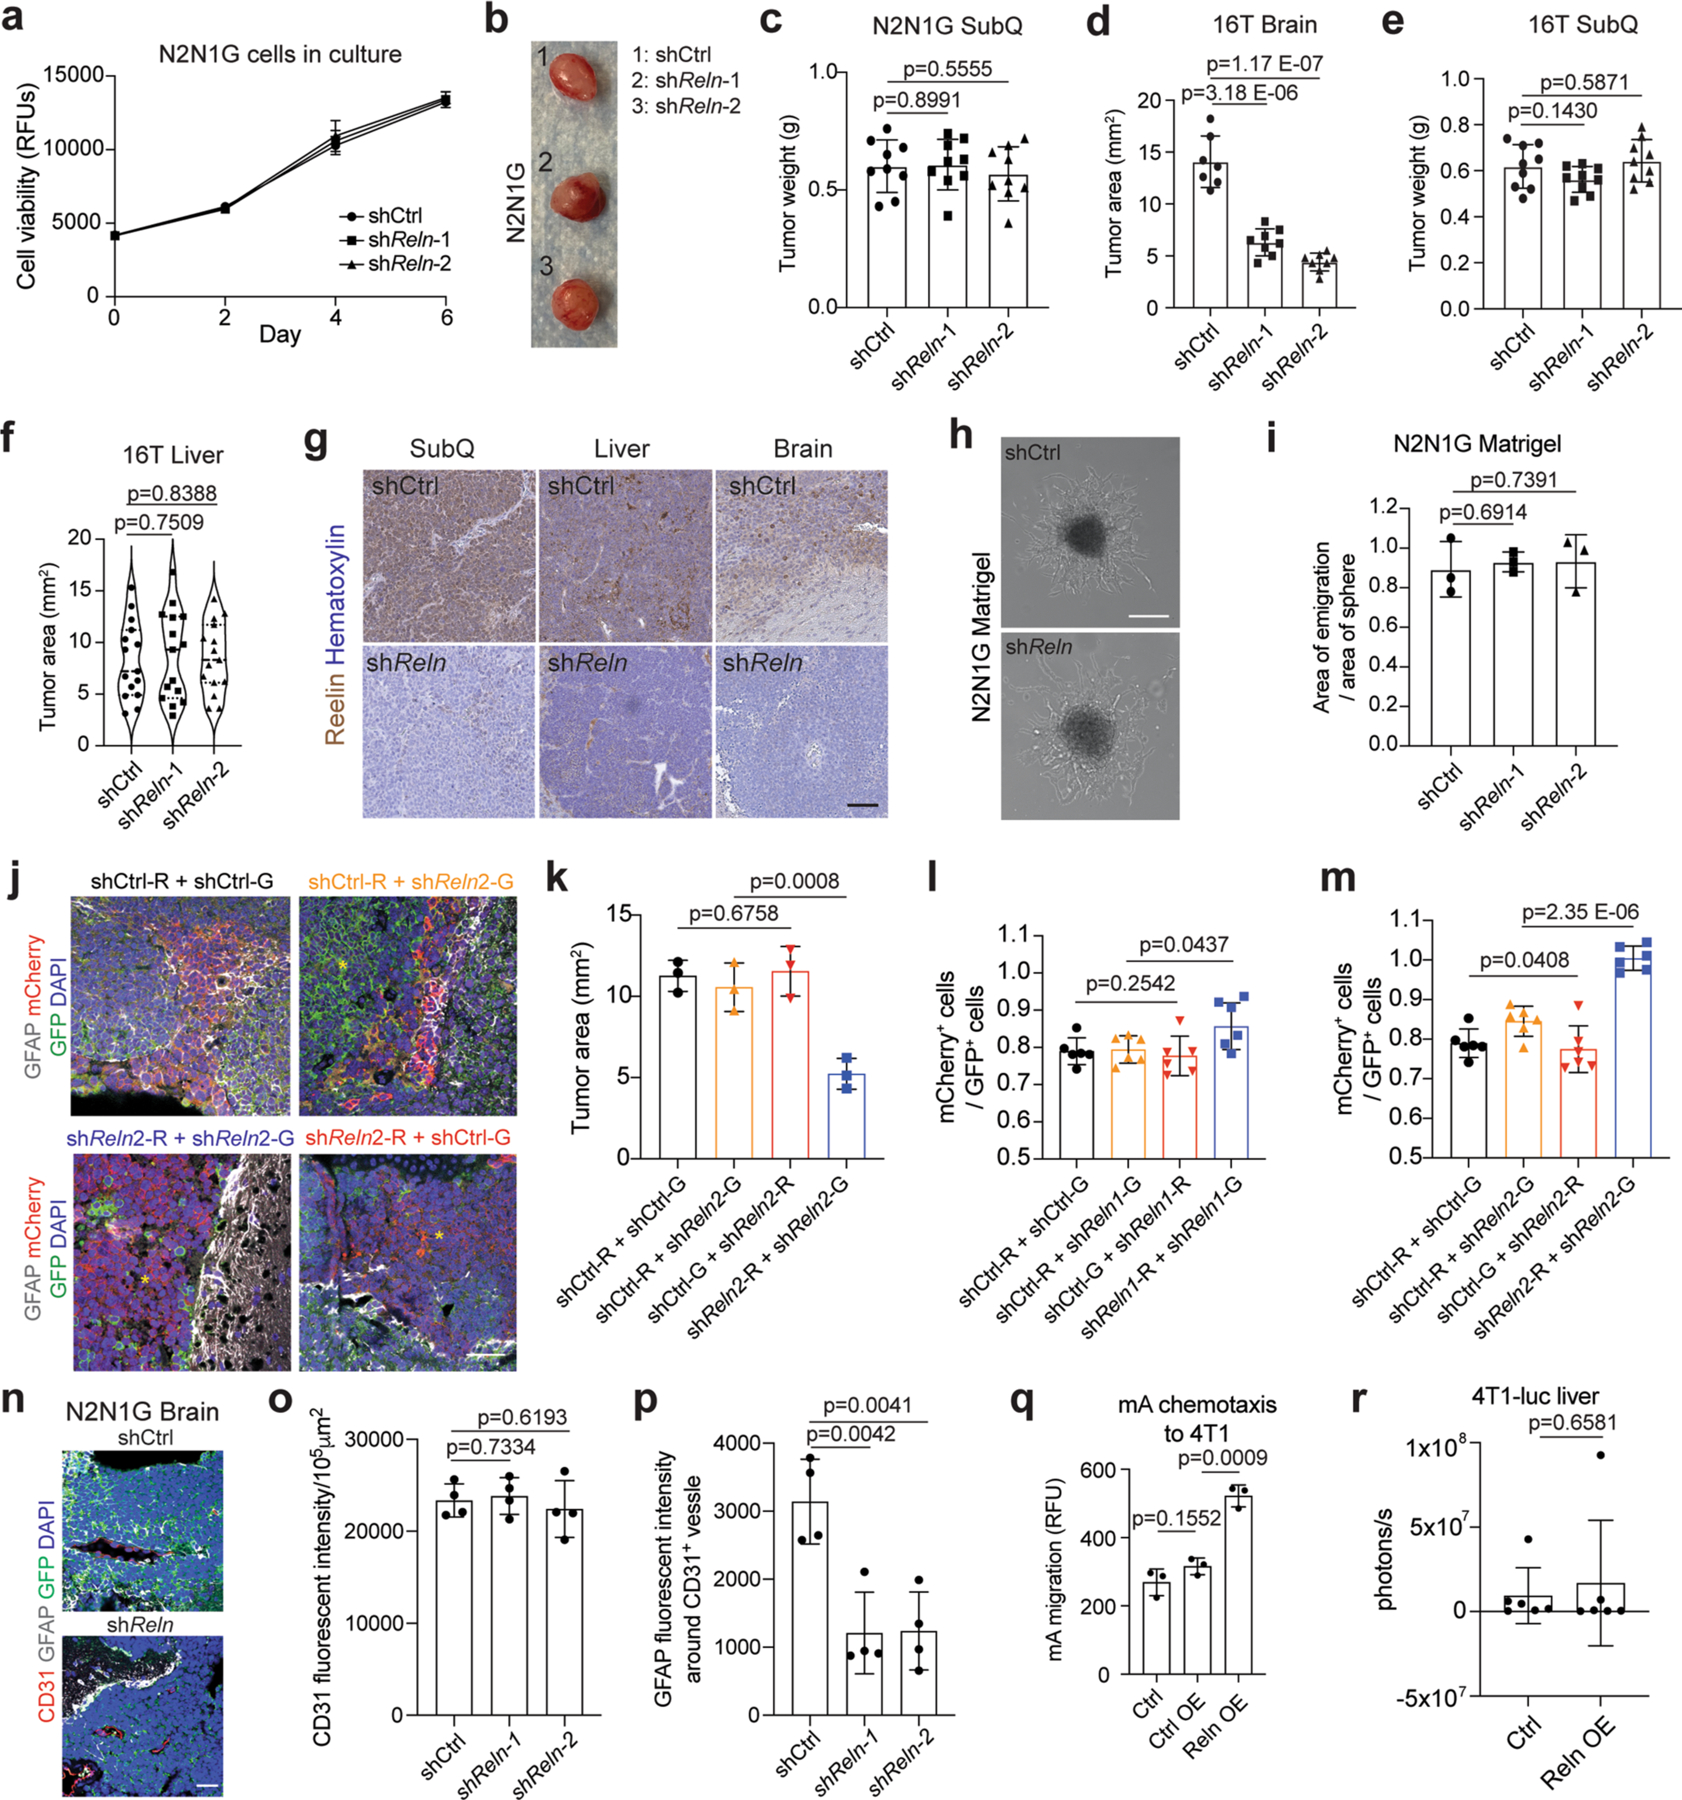
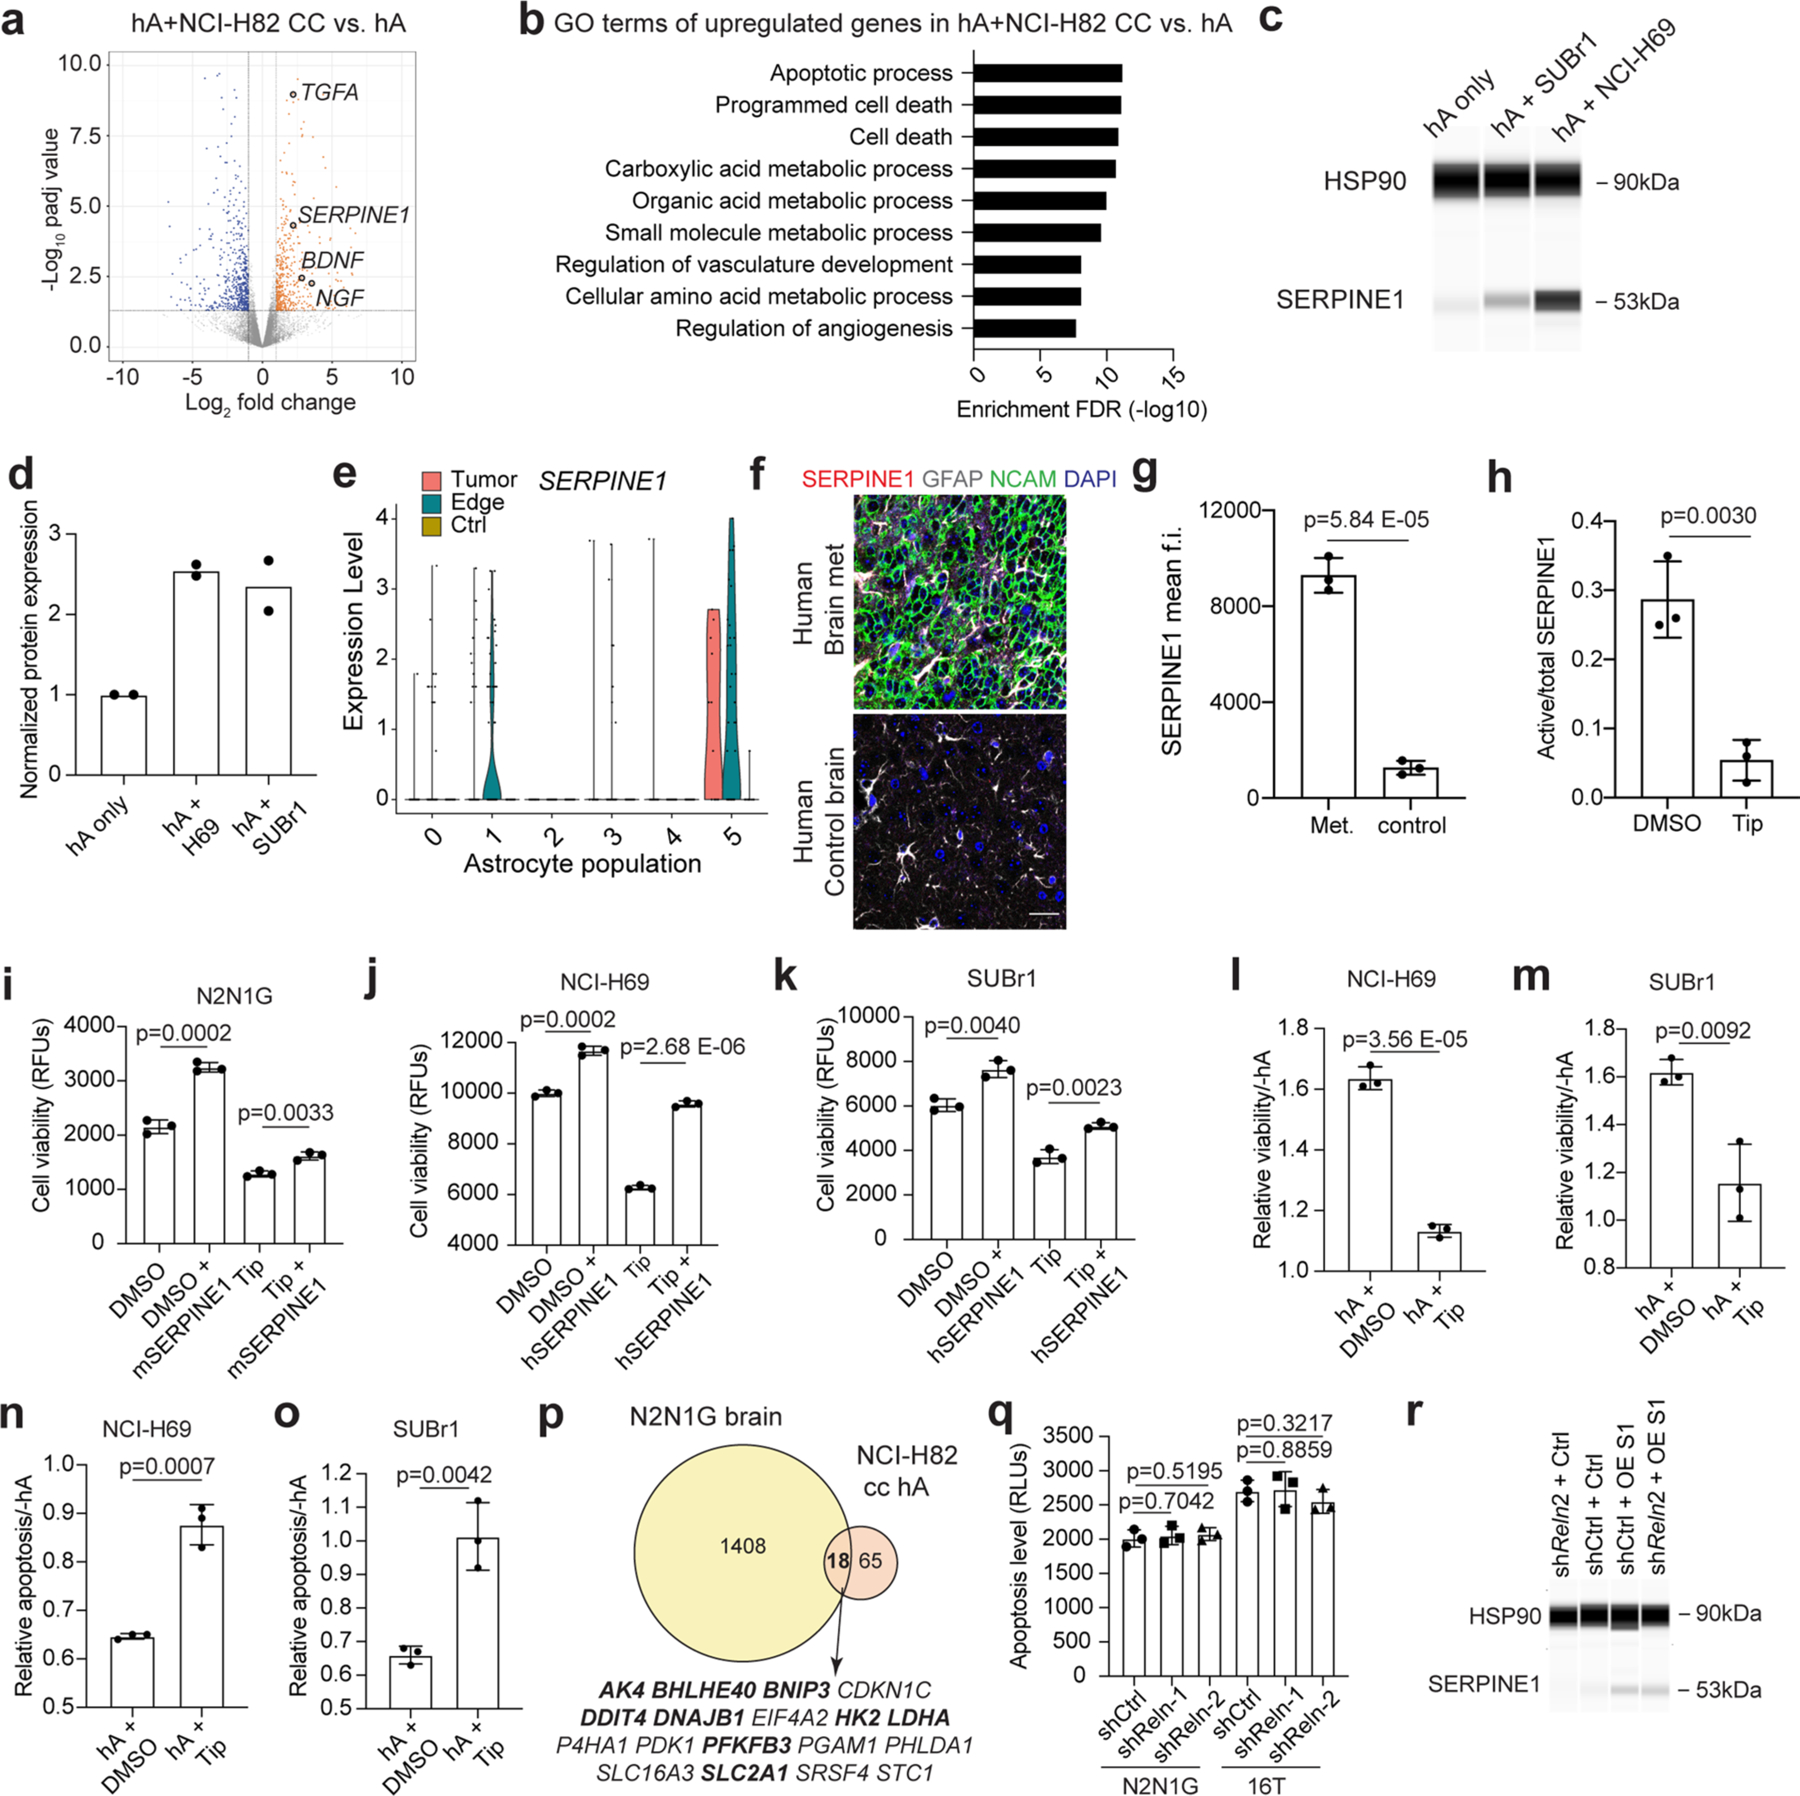
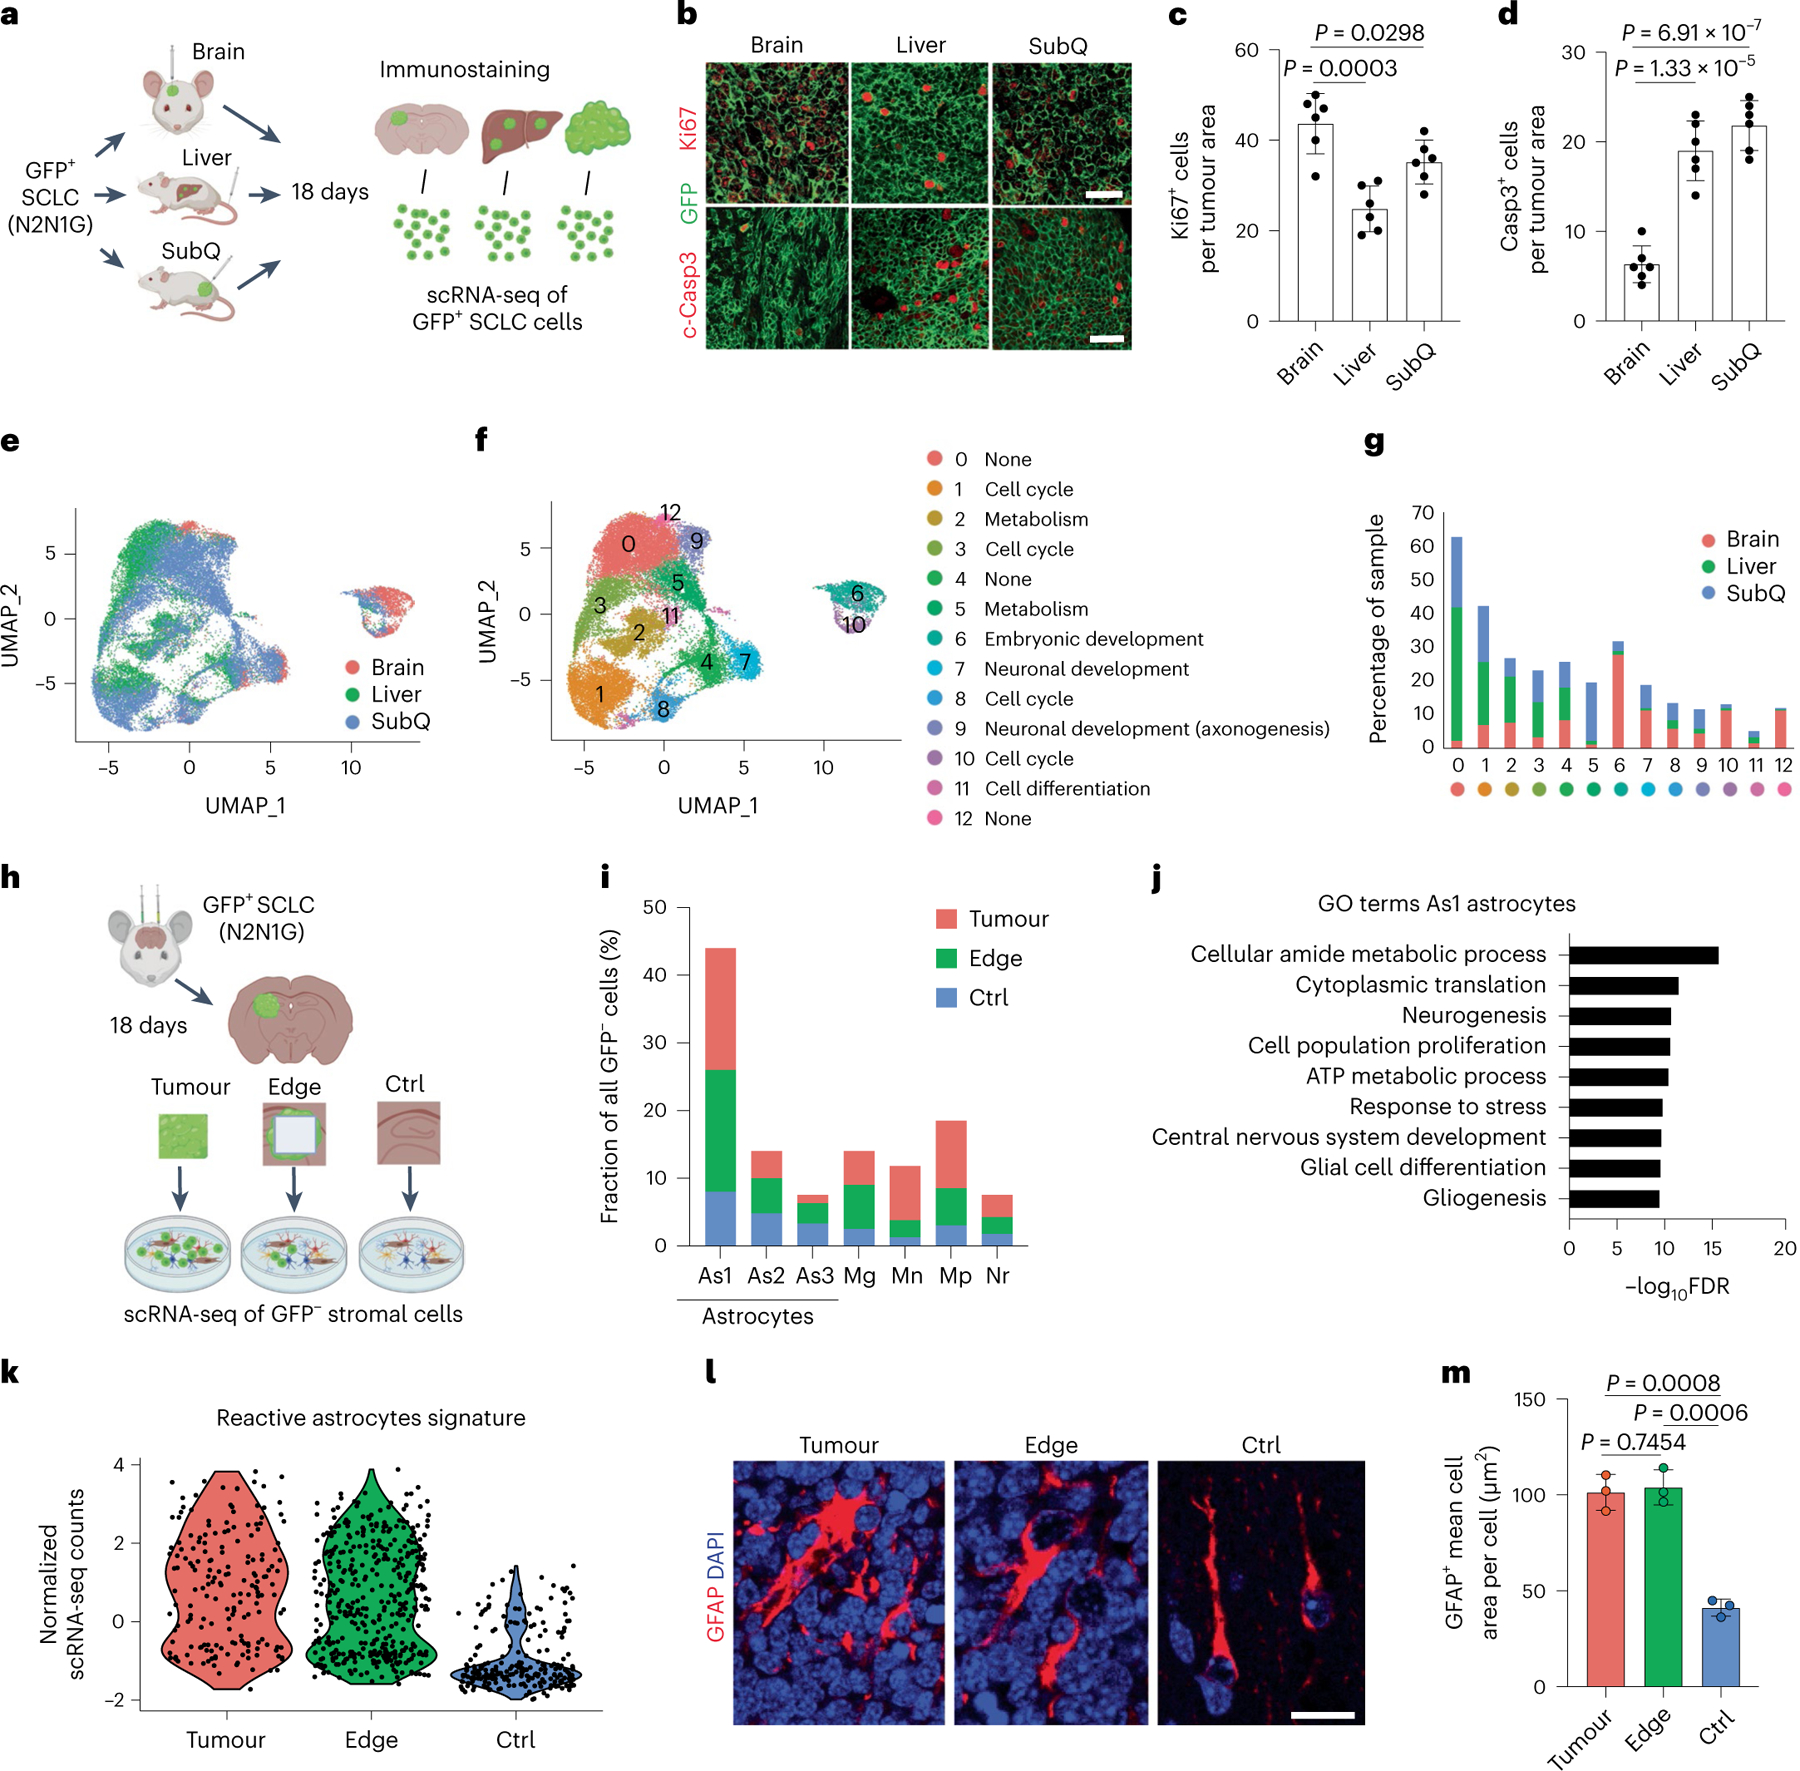
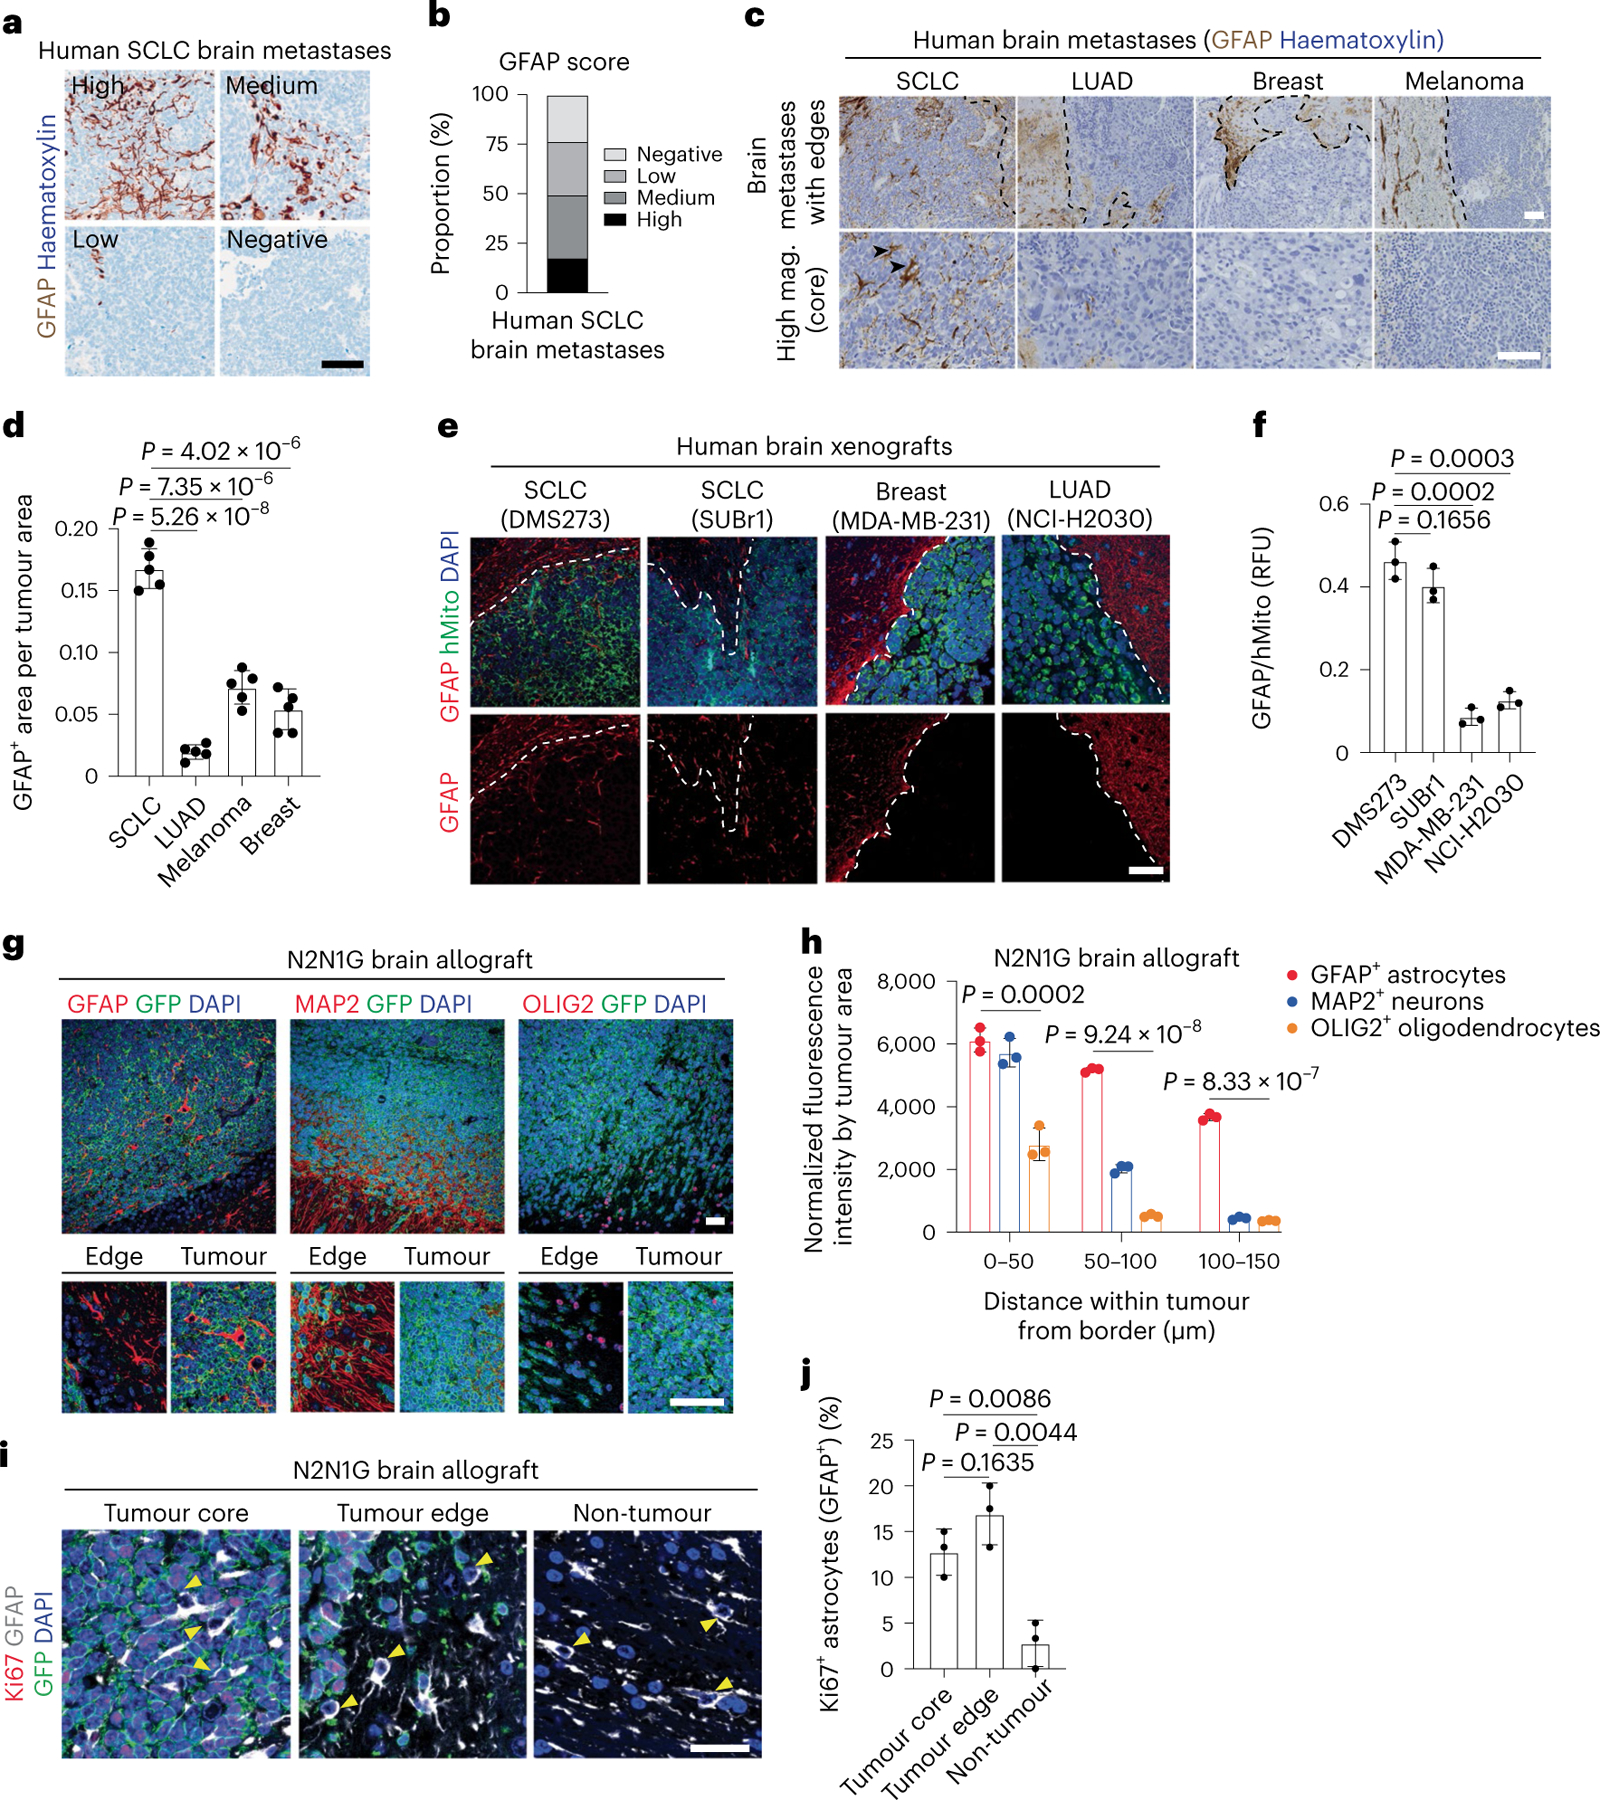
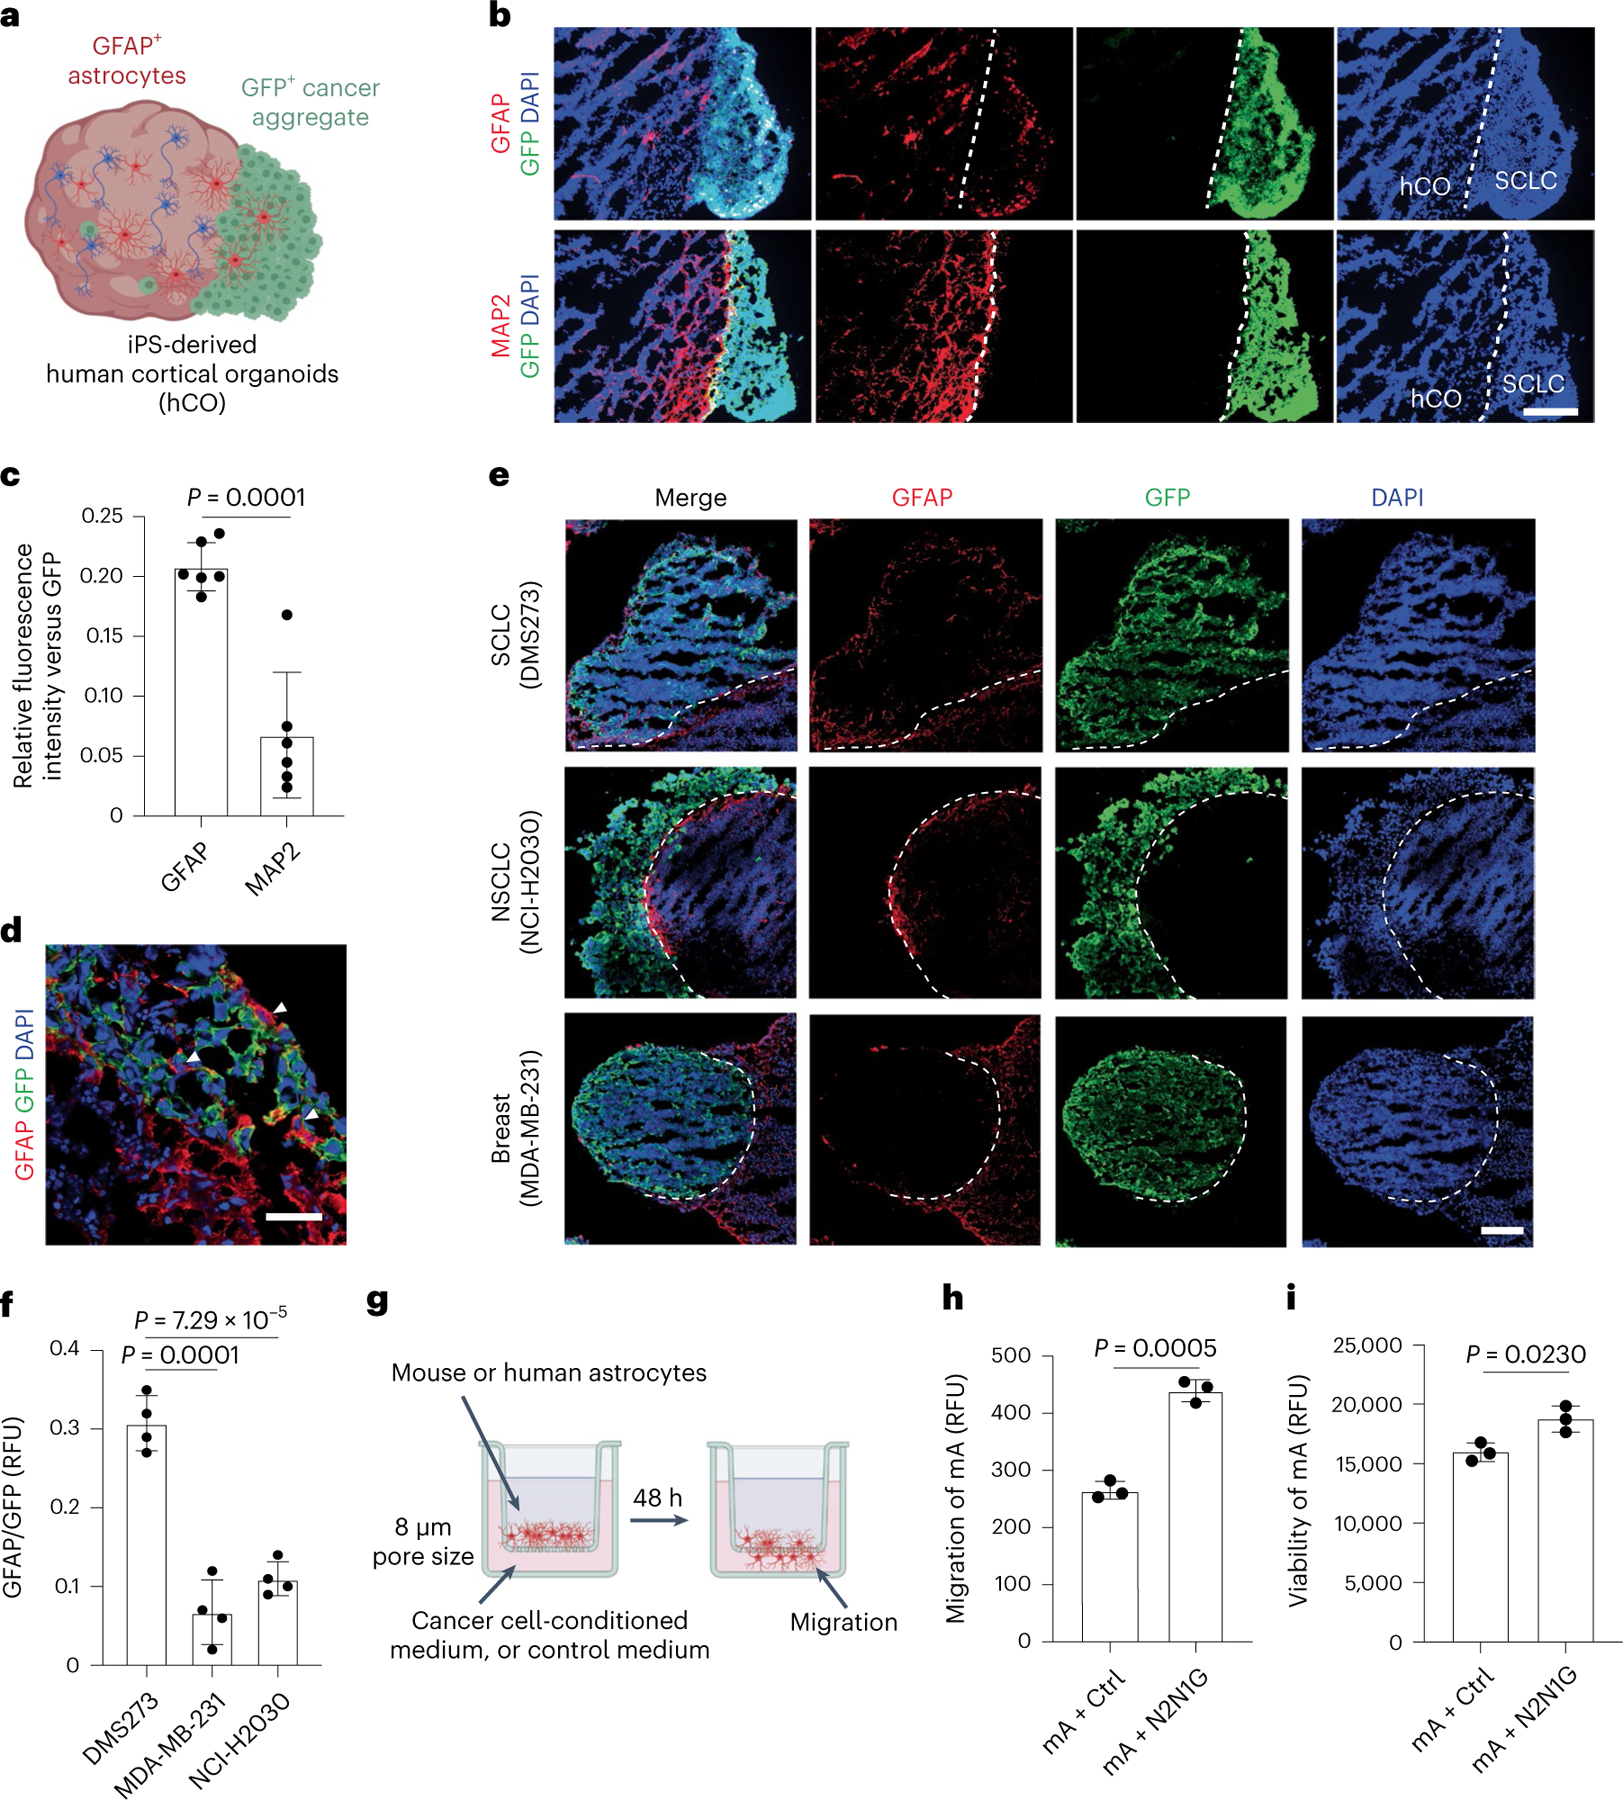
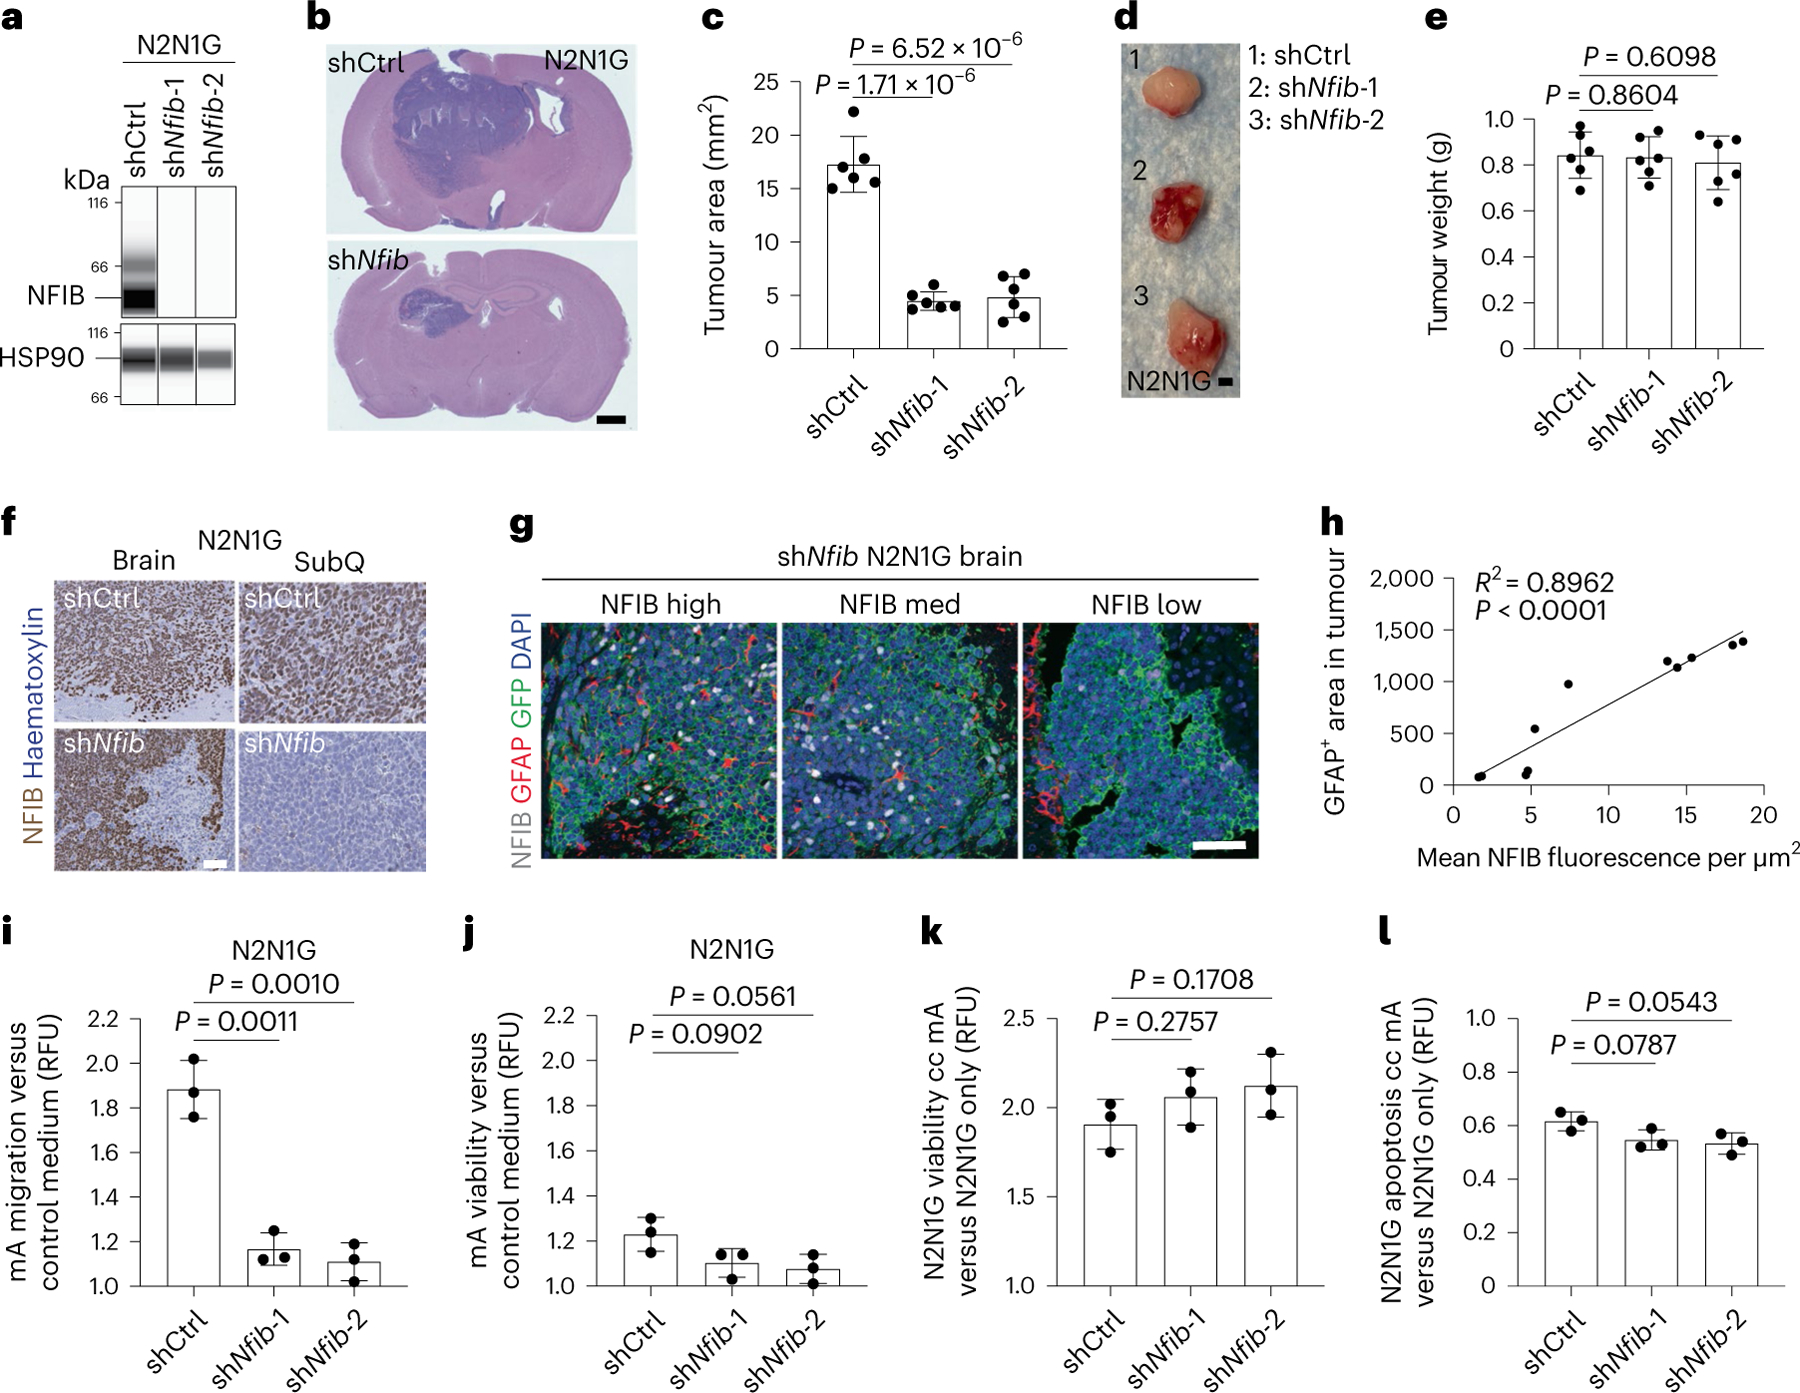
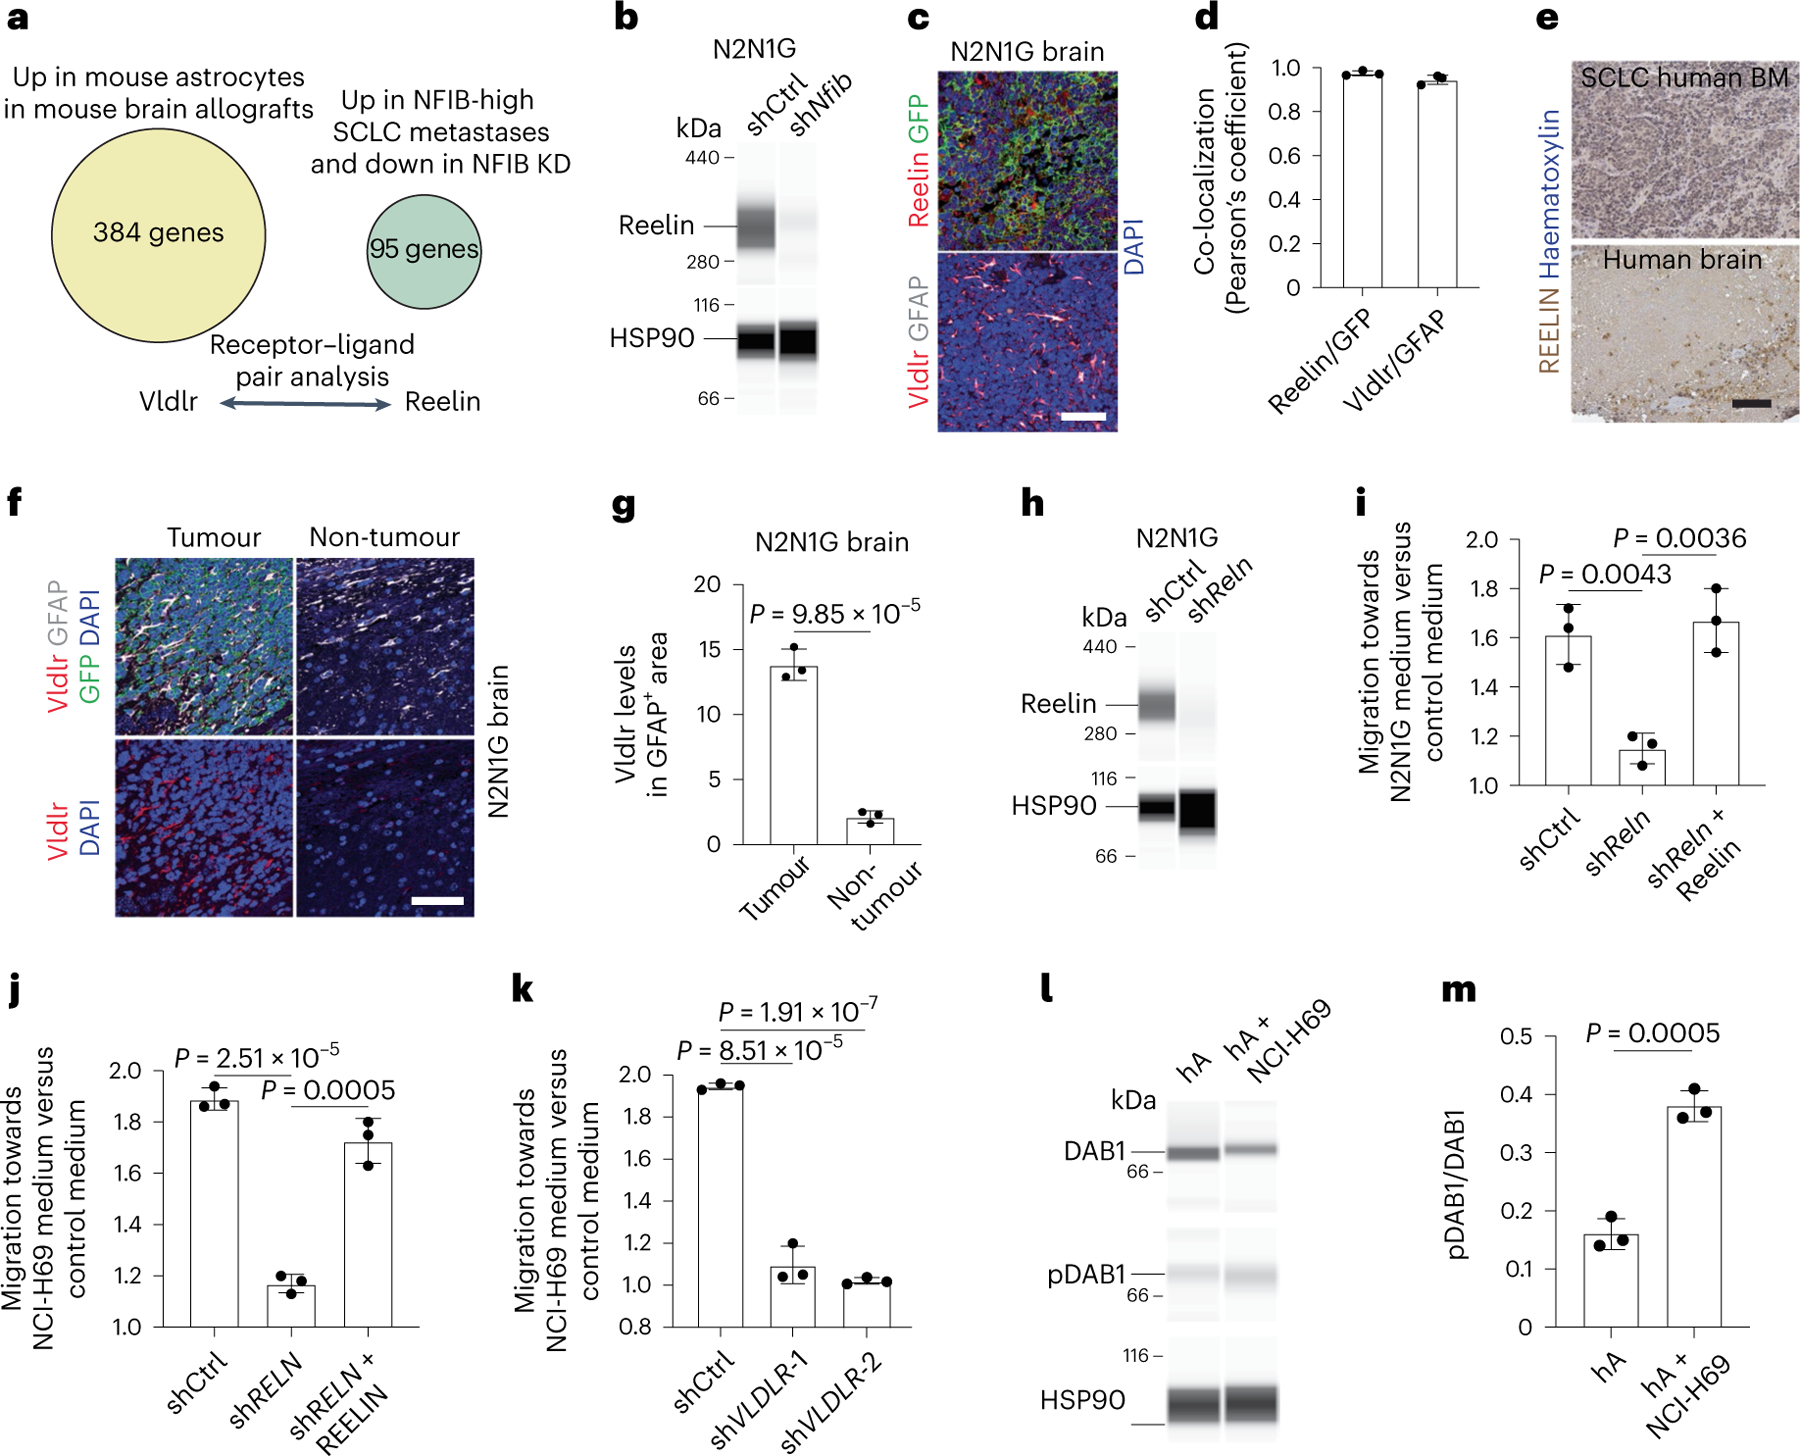
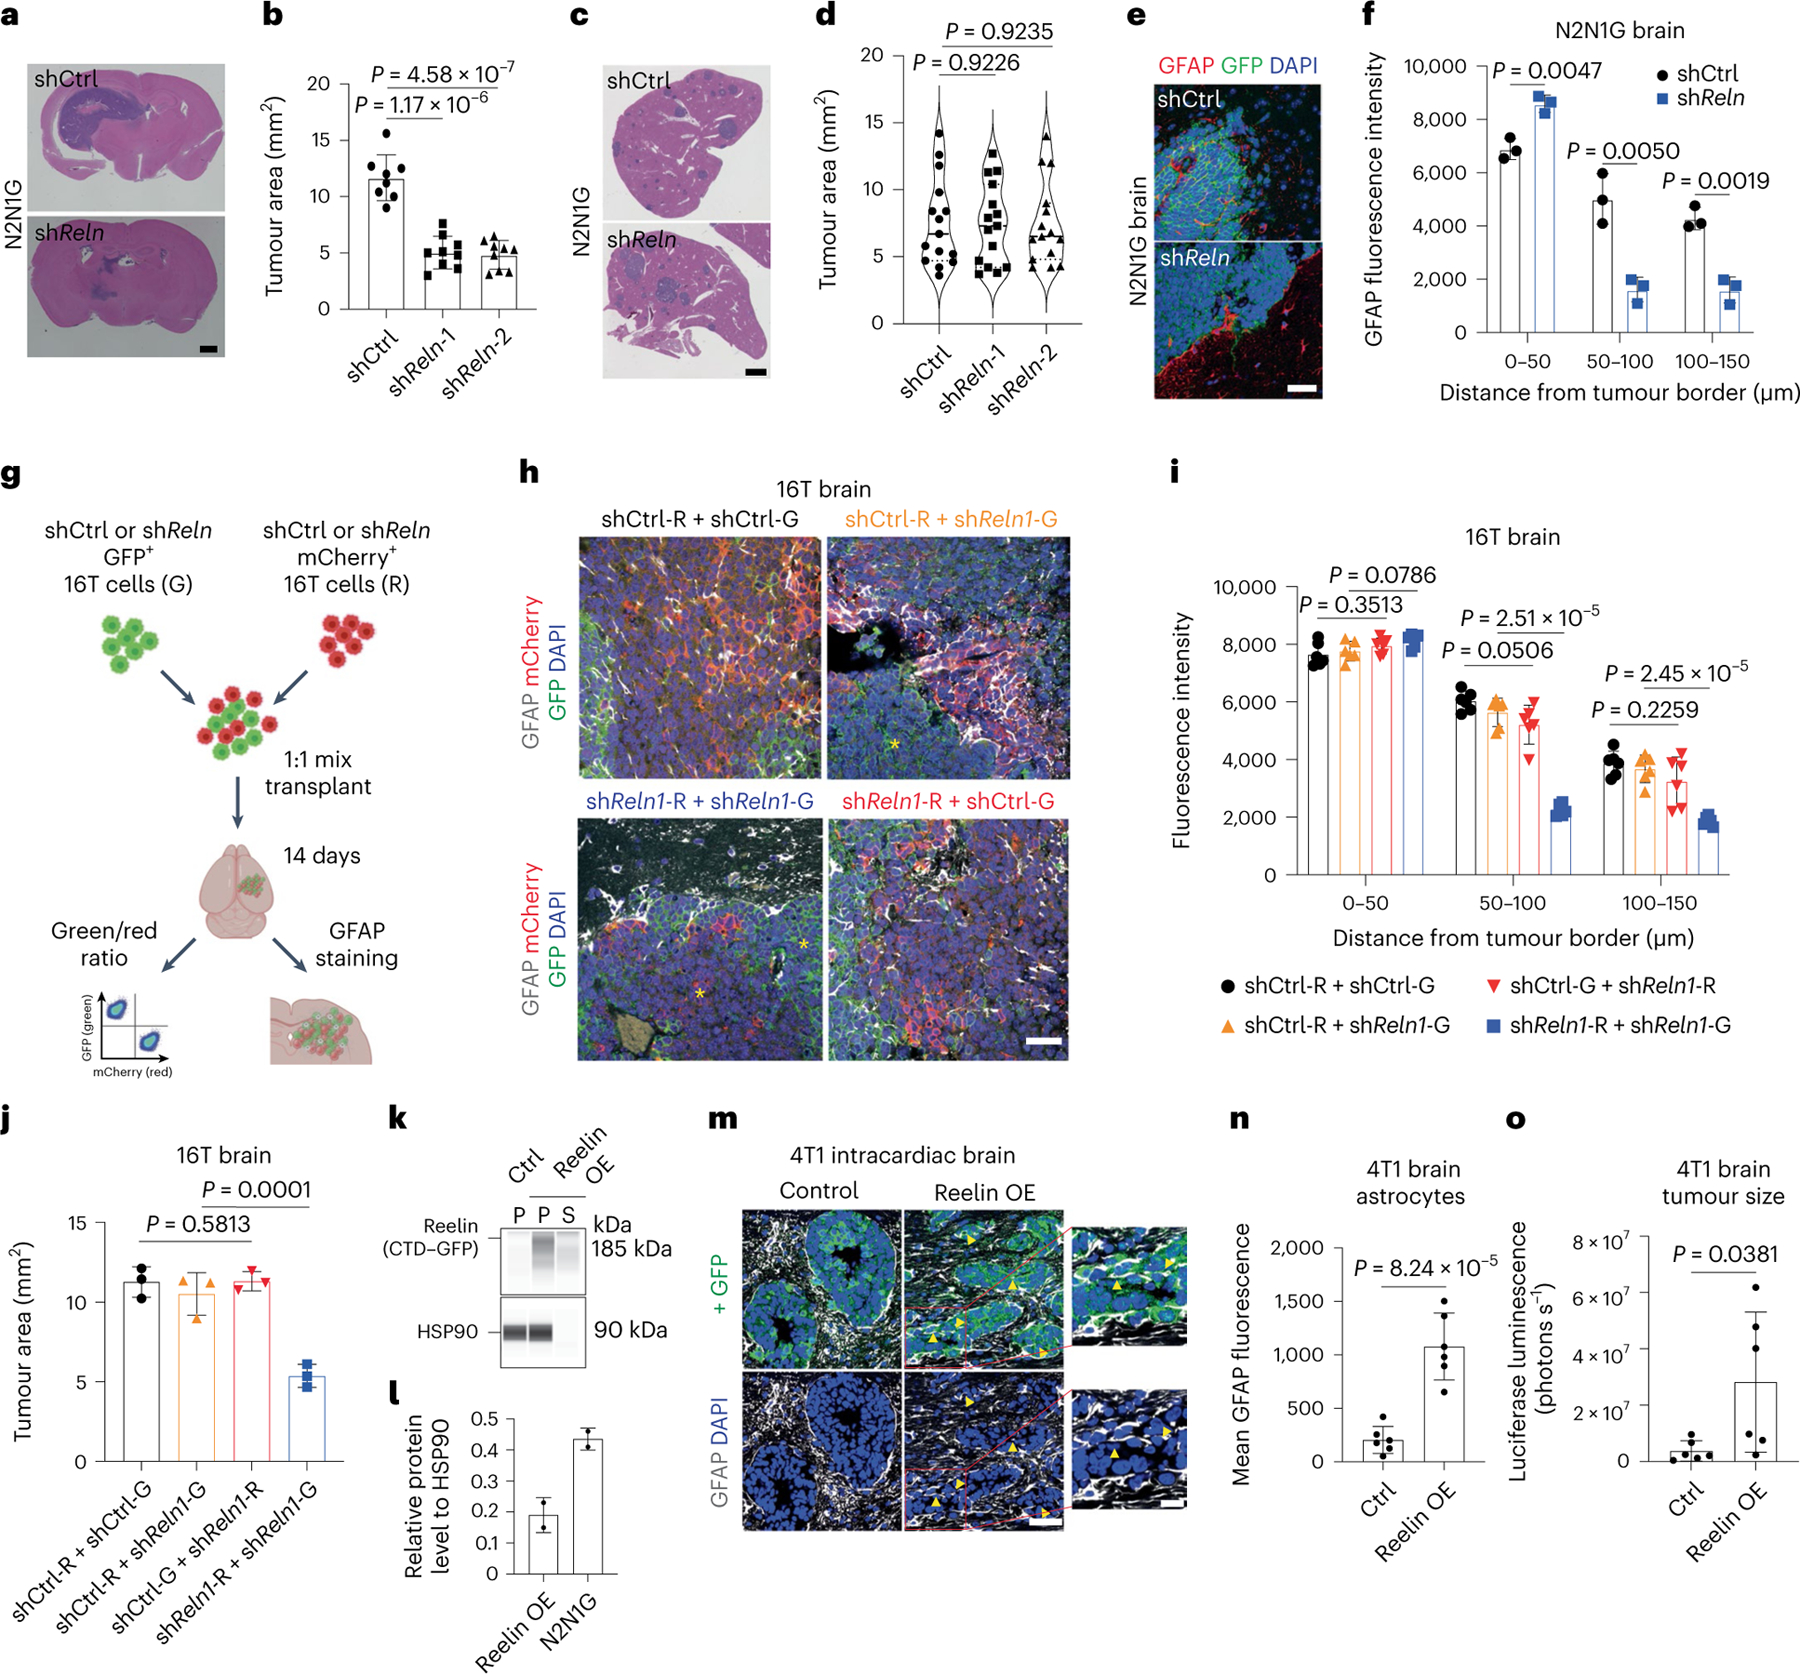
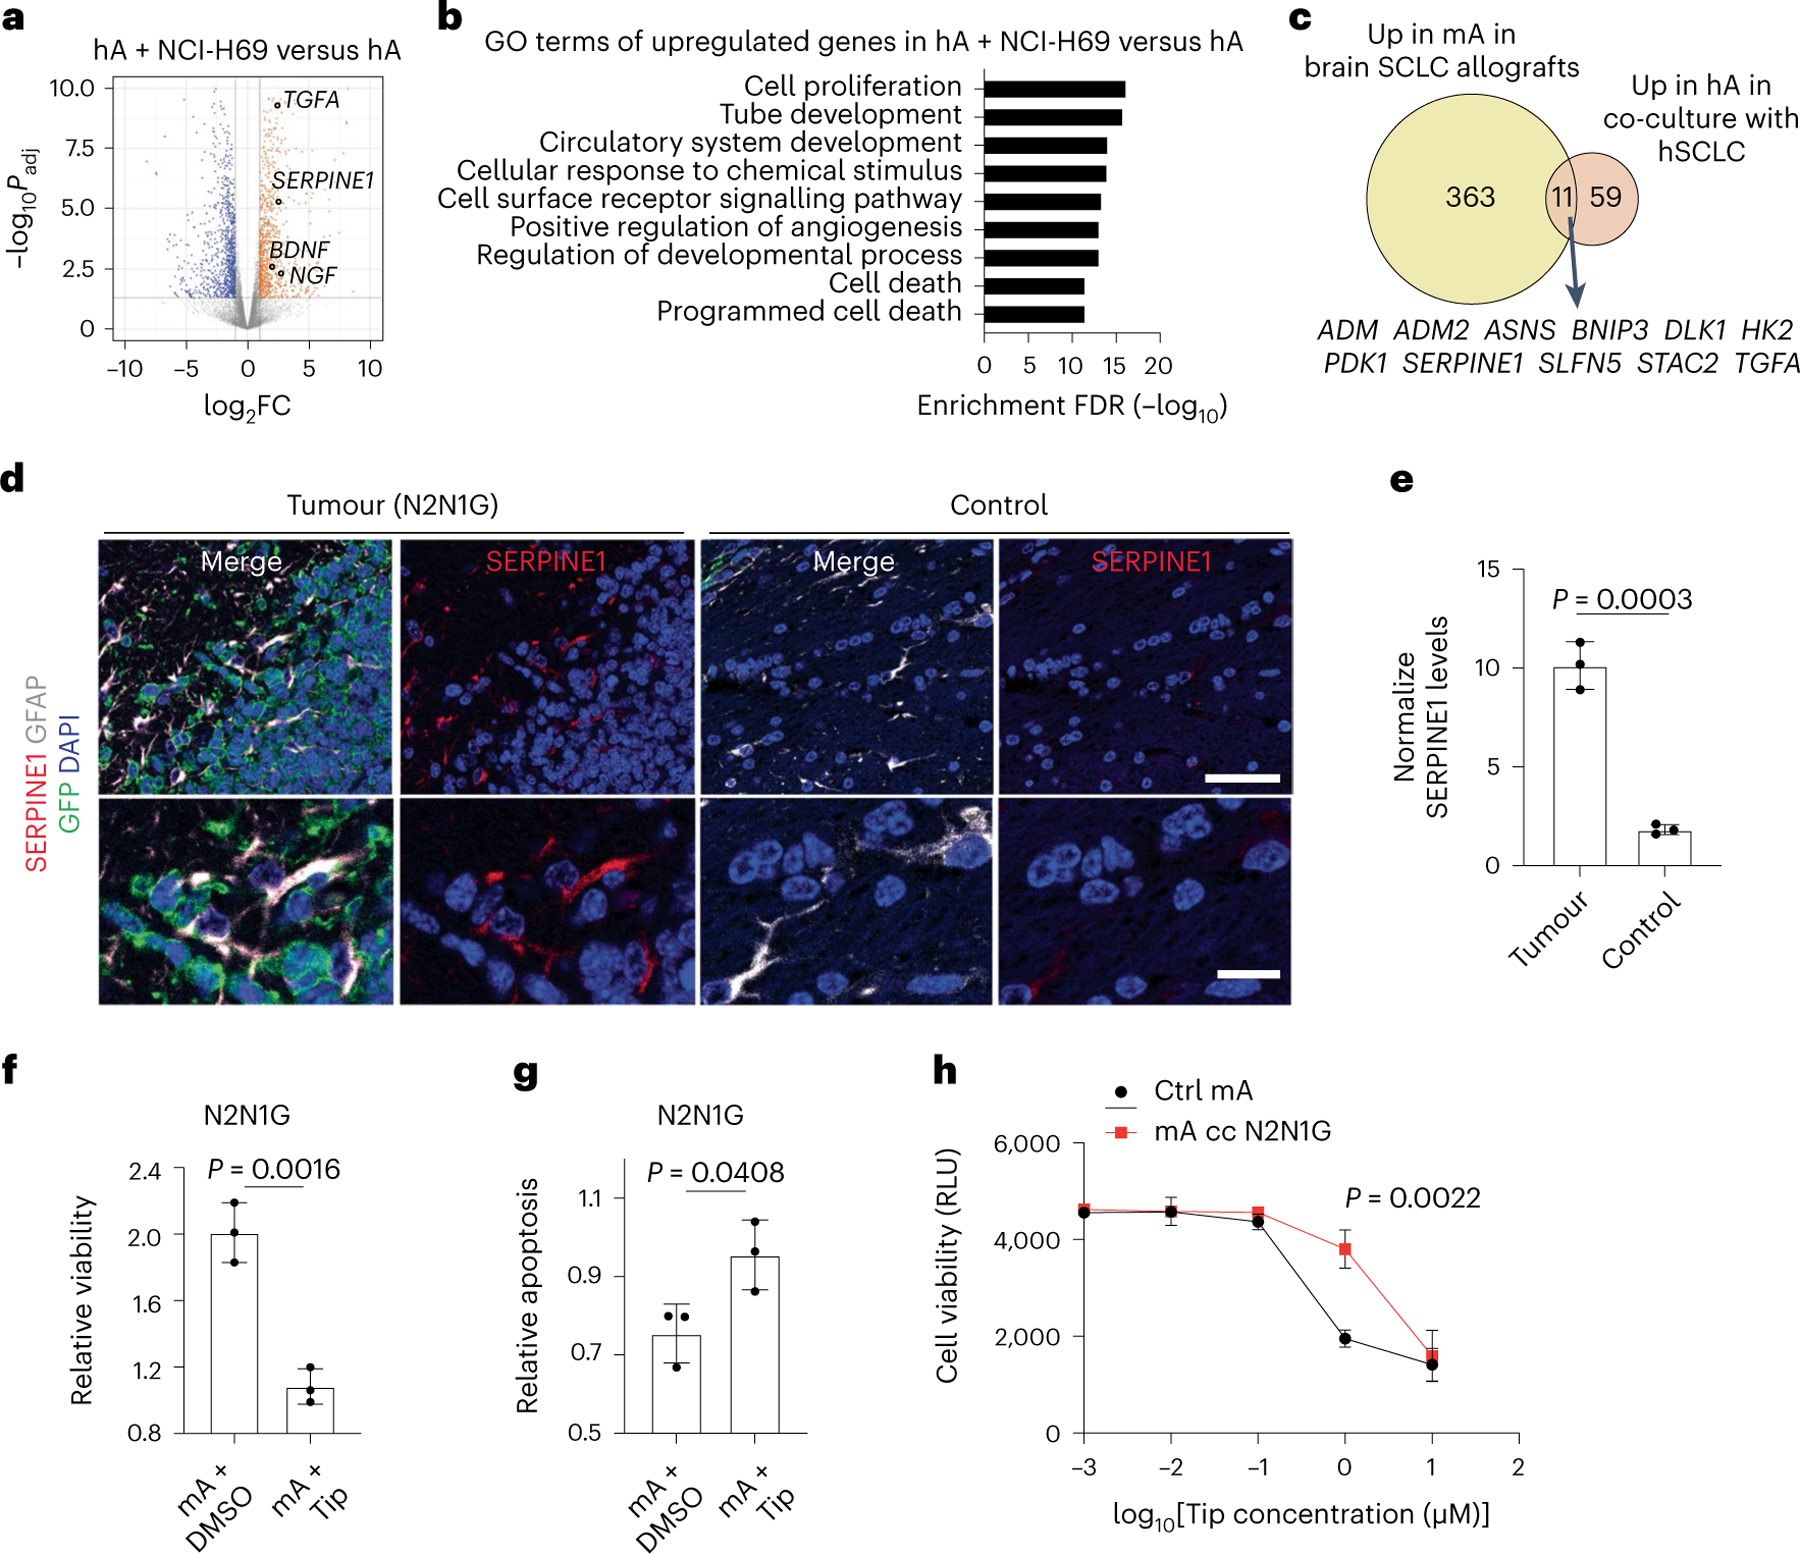
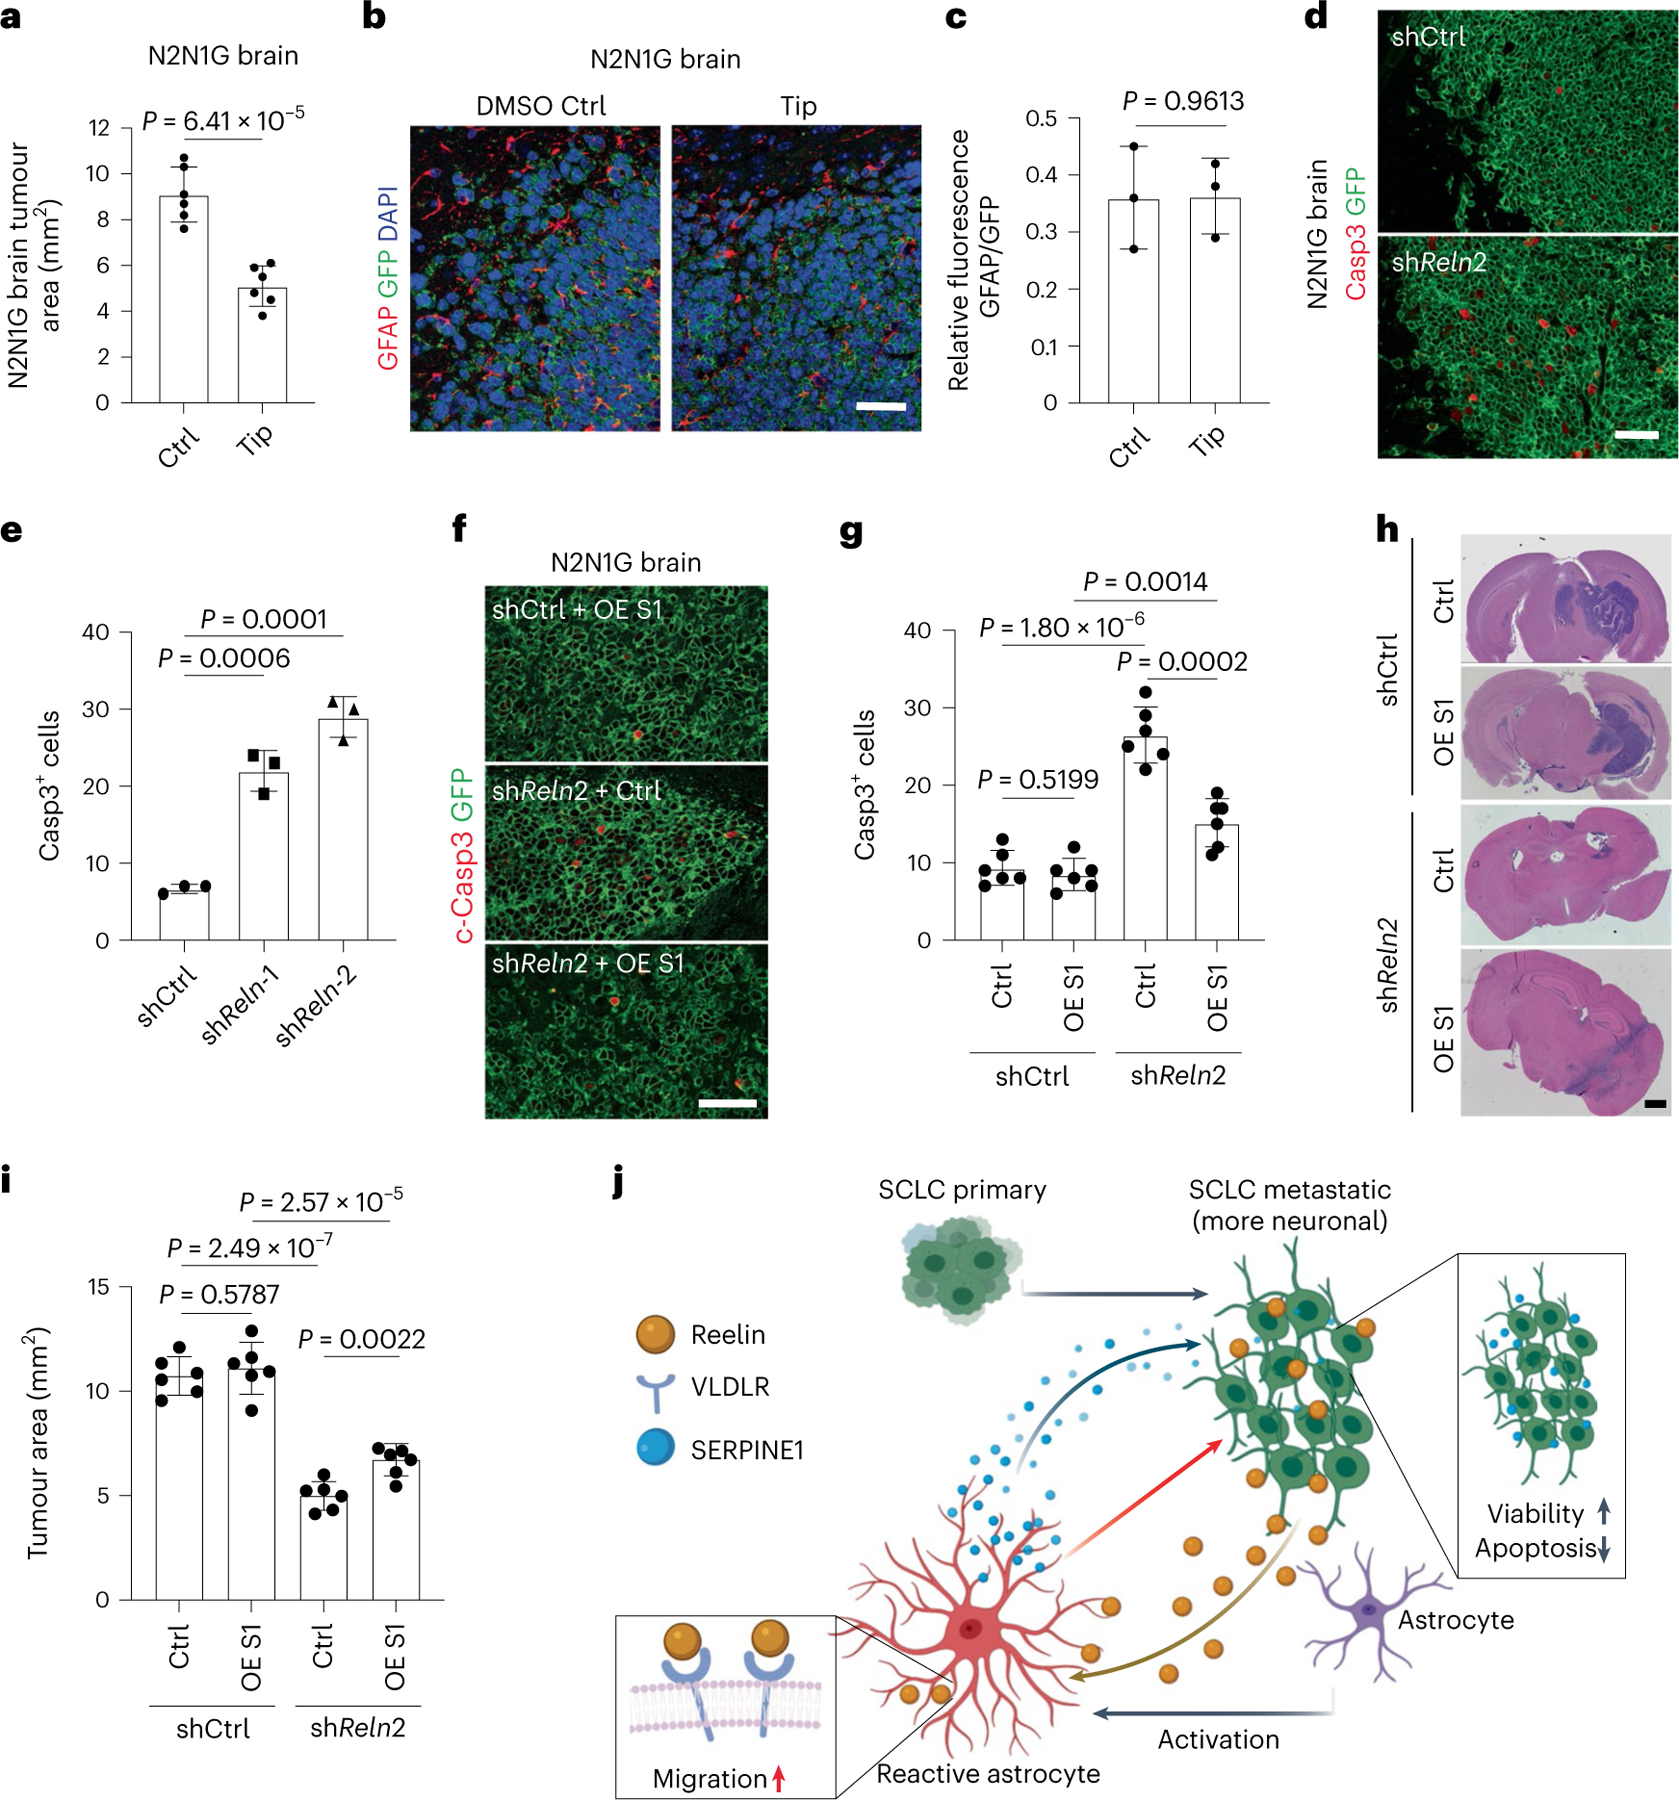
Brain metastases represent an important clinical problem for patients with small-cell lung cancer (SCLC). However, the mechanisms underlying SCLC growth in the brain remain poorly understood. Here, using intracranial injections in mice and assembloids between SCLC aggregates and human cortical organoids in culture, we found that SCLC cells recruit reactive astrocytes to the tumour microenvironment. This crosstalk between SCLC cells and astrocytes drives the induction of gene expression programmes that are similar to those found during early brain development in neurons and astrocytes. Mechanistically, the brain development factor Reelin, secreted by SCLC cells, recruits astrocytes to brain metastases. These astrocytes in turn promote SCLC growth by secreting neuronal pro-survival factors such as SERPINE1. Thus, SCLC brain metastases grow by co-opting mechanisms involved in reciprocal neuron-astrocyte interactions during brain development. Targeting such developmental programmes activated in this cancer ecosystem may help prevent and treat brain metastases.


Conflict of interest statement

Competing interests

J.S. licensed a patent to Forty Seven/Gilead on the use of CD47-blocking strategies in SCLC and has equity in, and is an advisor for, DISCO Pharmaceuticals. M.M.W. has equity in, and is an advisor for, D2G Oncology. M.D. has received recent research support from Novartis, Abbvie, United Therapeutics, Verily and Varian, and has consulted with Beigene, Astra Zeneca and Jazz Pharmaceuticals. M.P. has received honoraria for lectures, consultation or advisory board participation from the following for-profit companies: Bayer, Bristol-Myers Squibb, Novartis, Gerson Lehrman Group (GLG), CMC Contrast, GlaxoSmithKline, Mundipharma, Roche, BMJ Journals, MedMedia, Astra Zeneca, AbbVie, Lilly, Medahead, Daiichi Sankyo, Sanofi, Merck Sharp & Dome, Tocagen, Adastra, Gan & Lee Pharmaceuticals and Servier. The other authors declare no competing interests.

Figures

Extended Data Fig. 1 |
Extended Data Fig. 1 |. Modeling SCLC brain metastasis in mice following injection of mouse SCLC cells.
a. Survival data of NSG mice with N2N1G and 16 T mouse SCLC brain allografts (n = 6). b. Representative images of hematoxylin and eosin (H&E) counterstained-brain sections for the N2N1G mouse brain allografts and for human SCLC brain metastases. Similar to human tumors, mouse tumors display stippled chromatin, nuclear molding, scant cytoplasm, and frequent mitotic figures and apoptosis. Dark purple: tumor. Scale, 200 μm. Similar results were observed from 3 biologically independent samples. c. Representative images of luciferase (luc) bioluminescence activity from growing tumors after injection of N2N1G cells stably expressing luciferase (N2N1G-luc). d. Quantification of luciferase bioluminescence signal from 5 mice as in (c). e. Representative image of luciferase bioluminescence following intracarotid injection of N2N1G-luc cells (28 days). White arrow: subcranial tumor; asterisk: liver metastases. f. Representative images of hematoxylin and eosin (H&E) counterstained-brain and liver sections with parenchymal (PA), leptomeningeal (LP), ventricular (VC) brain metastases and liver metastases following injections of N2N1G-luc cells. Scale bar, 1 mm. g. Quantification of (f) for intracranial, intracardiac, and intracarotid injections. n = 9 mice per approach. h. Quantification of N2N1G tumors at different sites (n = 3 each); these tumors were used for analyses in Fig. 1b–d. Data show mean with SD. P value calculated by one-way ANOVA.
Extended Data Fig. 2 |
Extended Data Fig. 2 |. Reactivation of astrocytes in mouse SCLC brain metastases analyzed by RNA sequencing.
a. Representative fluorescent image of an N2N1G mouse brain allograft (cancer cells are GFP+) 18 days post-injection. Similar results were observed from 6 biologically independent samples from 2 experiments. Scale bar, 1 mm. b. Representative flow cytometry data of all GFP+ cells isolated from an N2N1G brain tumor core, its edge, and the sham control side. c. Uniform Manifold Approximation and Projection (UMAP) analysis of scRNA-seq of GFPneg stromal cells isolated from an N2N1G brain tumor core, its edge, and the sham control side. d. Percentage of each cell type in GFPneg stromal cell populations as in (c). e. Uniform Manifold Approximation and Projection (UMAP) of astrocyte populations from scRNA-seq data from (c). More than 3 populations of astrocytes as in (d) were found when the analysis was focused on astrocytes. f. Expression plot of reactive astrocyte signature genes in astrocyte populations within tumors, at the tumor edge, and in sham injection control regions. g. Schematic representation of the immunopanning protocol to isolate SCLC-associated and injury-associated (surgery and sham injection) control astrocytes before bulk RNA sequencing and analysis. Astrocytes were isolated from the two sides of the brain of the same mice (N2N1G allograft model). Created with BioRender.com h. Gene ontology (GO) enrichment (top 10) for the genes that are upregulated in tumor-associated astrocytes (TA) compared to control astrocytes (CA) as in (g). FDR, false discovery rate. i. Gene expression heatmap of TA and CA grouped by signature genes of alternative activation, inflammatory genes, mature, and progenitor astrocytes (RNA-seq). j. Gene Set Enrichment Analysis (GSEA) for an MCAO (middle cerebral artery occlusion)-induced activation signature (Heiland et al., 2019) for genes upregulated in N2N1G brain TA compared to CA.
Extended Data Fig. 3 |
Extended Data Fig. 3 |. Reactive astrocytes infiltrate SCLC brain metastases in mice and humans.
a. Representative images showing immunofluorescent staining of GFAP (red, astrocytes) and human mitochondria (hMito, green, SCLC CDX3 xenograft model) on sections from a leptomeningeal metastasis (LP). Scale, 100 μm. Similar results were observed from 3 biologically independent samples. b. Representative images showing immunofluorescent staining of GFAP (red) and GFP (green for SCLC cells) on sections from an immunocompetent mouse SCLC allograft model (KP1-GFP cells). Similar results were observed from 4 biologically independent samples. Blue, DAPI DNA stain. Scale, 50 μm. c, d. Representative images (c) showing immunofluorescent staining of GFAP (red) and GFP+ N2N1G SCLC cells (green) and quantification (d) of colocalization (Pearson’s coefficient for the red and green channels). n = 3 biologically independent samples. Blue, DAPI DNA stain. Scale, 50 μm. e, f. Representative immunofluorescent staining images (e) and quantification (f) of cleaved-caspase 3 (c-cas3) expression on a section from a GFP+ N2N1G SCLC brain allograft. n = 3 biologically independent samples. P values calculated by one-way ANOVA for (d) and (f). g-h. Representative immunofluorescent staining images (g) and quantification (h) of perivascular and non-perivascular astrocytes (GFAP+). CD31 stains endothelial cells in the vasculature. n = 3 biologically independent samples. Data show mean with SD. P values calculated by two-sided t-test when comparing two groups and one-way ANOVA when comparing three and more groups.
Extended Data Fig. 4 |
Extended Data Fig. 4 |. Astrocytes activated by SCLC cells promote the growth and survival of mouse and human SCLC cells.
a. Expression of upregulated cell migration genes in astrocyte populations (as in Extended Data Fig. 2e) from tumor or tumor edge compared to a sham injection control. n = 3 animals. b. Representative high magnification images of immunofluorescent staining of GFAP (red) and GFP (green for human cancer cells) at an SCLC-hCO assembloid fusion interface showing the cell body of astrocytes within the SCLC aggregate. Showing separate channel images from Fig. 3d. Scale, 20 μm. c. Quantification of human astrocyte chemotaxis in control medium and human cancer cell-conditioned medium. d. Schematic description of the astrocyte-SCLC co-culture assay. Created with BioRender.com e, f. Cell viability (AlamarBlue assay, RFU: relative fluorescent unit) (d) and apoptosis (caspase3/7 activity, RLU: relative luminescence unit) (e) measured in N2N1G cells cultured with (red) or without (black) mouse astrocytes (mA). n = 3 independent experiments. g. Representative images showing immunofluorescent staining of human astrocytes (hA) cultured alone or co-cultured with human SCLC cell lines (SUBr1, NCI-H69, and NCI-H82). GFAP (green), Vimentin (VIM, red). Blue, DAPI DNA stain. Scale, 20 μm. h. Quantification of GFAP fluorescent intensity relative to Vimentin (n = 6 from 3 independent experiments). i. Quantification of hA chemotaxis toward human SCLC-conditioned medium. N = 3 independent experiments. Data show mean with SD. P values calculated by two-sided t-test for (c)(f)(h)(i), and two-way ANOVA for (e).
Extended Data Fig. 5 |
Extended Data Fig. 5 |. Paracrine mechanisms in the promotion of the growth and survival of SCLC cells by reactive astrocytes.
a, b. Cell viability (AlamarBlue assay, RFU: relative fluorescent unit) (a) and apoptosis (caspase3/7 activity, RLU: relative luminescence unit) (b) measured in NCI-H69 cells cultured with (red) or without (black) human astrocytes (hA), as in Extended Data Fig. 3c. c, d. As in (a-b) with NCI-H82 cells. e, f. As in (a-b) with SUBr1 cells. g, h. Relative cell viability (luciferase activity) of NCI-H69 (g) or NCI-H82 (h) cells co-cultured with (blue) or without (red) direct contact with hA during co-culture. i. Relative cell viability of NCI-H69 cells cultured in astrocyte-conditioned medium (hA Con-AM), SCLC-astrocyte co-culture-conditioned medium (hA + SCLC Con-AM), or SCLC-conditioned medium (SCLC Con-AM). n = 3 independent experiments. P values calculated by two-sided t-test for (b)(d)(f)(i) and two-way ANOVA for (a) (c)(e)(g)(h).
Extended Data Fig. 6 |
Extended Data Fig. 6 |. Correlation between NFIB levels and the growth of SCLC brain metastases.
a. Immunoassay (by WES capillary transfer) for NFIB expression in NFIB-high 16 T and N2N1G mouse SCLC cells and in NFIB-low KP22 and 5PFBl cells. HSP90 serves as a loading control. Similar results were observed from 2 independent experiments. b. Representative image of immunofluorescent staining for NFIB (red) and N2N1G NFIB-high SCLC cells (green) on sections from a brain allograft (right). Similar results were observed from 3 biologically independent samples. Scale bar, 20 μm. c. Summary of the ability of various mouse and human SCLC tumors to grow in the brain following intra-cranial injection and subcutaneously. d. Representative images of subcutaneous xenografts and allografts from models in (c) after 14 days in NSG mice. Scale bar, 5 mm. e. Representative images of brains sections from models in (c) after 21 days. f. Quantification of tumor growth of shCtrl (control) and shNfib N2N1G-luc cells measured by bioluminescence imaging (n = 5 tumors from 5 mice each genotype). g. Cell viability measured by AlamarBlue assay of shCtrl and shNfib N2N1G cells at 48 hours in culture. n = 3 independent experiments. h. Immunoassay for NFIB expression in 16 T cells with control and shNfib shRNAs (n = 1 experiment). HSP90: loading control. i-j. Quantification of tumor size of control and shNfib 16 T brain allografts (i) and subcutaneous allografts ( j). n = 5 (control and shNfib-2) and 6 (shNfib-1) mice from 2 experiments. k. Representative immunohistochemistry (IHC) for NFIB and GFAP expression (brown signal) in brain metastases sections from SCLC patients. Scale bar, 50 μm. l. Quantification of (k) (n = 20 regions from 10 patient metastases) for GFAP staining area and NFIB intensity (brown signal). Data show mean with SD. P-values calculated by two-sided t-test when comparing two groups and by one-way ANOVA when comparing three groups.
Extended Data Fig. 7 |
Extended Data Fig. 7 |. NFIB levels and activity do not significantly change in the brain microenvironment compared to other tumor sites.
a. Immunoassay (by WES capillary transfer) for NFIB expression in N2N1G cells isolated from brain, liver, and subcutaneous (SubQ) tumors. HSP90 serves as a loading control. b. Quantification of NFIB protein levels from (a) (n = 3 tumors from 3 mice). Data show mean with SD. P values calculated by two-sided t-test. c. Schematic description for the ATAC-seq analysis of N2N1G cells isolated from brain allograft, liver metastases, SubQ tumors, and cells in culture. Created with BioRender.com d. Clustering of ATAC-seq data of 3 brains, 3 livers, 3 SubQ, and 2 N2N1G in culture. e. Box plot showing accessibility at NFIB peaks across the different samples, as indicated (ATAC-seq datasets). For each box, the line represents the median of the spread. Box, 75% of all peaks; whiskers, 25% outlier peaks. n = 3 biologically independent samples. P values calculated by two-sided Wilcox’s test for non-parametric data. f. Number and percentage of site-specific and shared peaks that are more accessible in N2N1G cells from brain and liver tumors compared to subcutaneous tumors (cut-off: 1.5x more accessible).
Extended Data Fig. 8 |
Extended Data Fig. 8 |. Reelin-Vldlr signaling regulates SCLC-induced astrocyte migration.
a. Chromatin accessibility at two sites in the Reln locus assessed by ATAC-seq in shCtrl (control) and shNfib 16 T and KP1 cells, and KP22 cells overexpressing empty vector (oe empty) or mouse NFIB (oe Nfib). Chromatin immunoprecipitation (ChIP) for NFIB in 16 T, KP1, and KP22 cells. b. Immunoassay for NFIB in shCtrl and shReln N2N1G cells. HSP90 serves as a loading control. c. Quantification of (b) (n = 3 independent experiments). d. Representative images showing immunofluorescence staining of Reelin (red) and GFP (green, cancer cells), or Vldlr (gray) and GFAP (red) on an N2N1G brain allograft section. Blue: DAPI DNA stain. Scale bar, 50 μm. Similar results were observed from 3 biologically independent samples. e. Immunoassay for Reelin in shCtrl and shRELN NCI-H69 cells. HSP90 serves as a loading control (n = 1). f. Representative images showing immunofluorescent staining of human astrocytes (hA, marked by Vimentin) for the reactivation marker GFAP (green) when co-cultured (CC) with shCtrl or shRELN NCI-H69 cells. Blue: DAPI to stain DNA. Scale bar, 20 μm. g. Quantification of fluorescent intensity for GFAP normalized to Vimentin (n = 3 independent experiments) as in (f). h. Representative images showing rare immunofluorescent staining of GFAP (green) in Vimentin+ (red) hA treated with or without recombinant human Reelin. Blue: DAPI DNA stain. Scale bar, 20 μm. Similar results were observed from 2 independent experiments. i. Cell viability (AlamarBlue assay) measured in shCtrl and shRELN NCI-H69 cells cultured with hA compared to without hA (n = 3 independent experiments). j. Chemotaxis of mouse astrocytes (mA) in control medium or medium with recombinant mouse Reelin protein and the mouse Reelin-blocking antibody CR-50. k. Relative viability of mA in shCtrl and shReln N2N1G-conditioned medium with or without the addition of recombinant mouse Reelin compared to control medium (n = 3 independent experiments). l. Same as (i) for hA and human Reelin. m. Immunoassay for VLDLR in shCtrl and shVLDLR hA. HSP90 serves as a loading control (n = 1 experiment). n. Chemotaxis assay for shCtrl and shVLDLR hA with or without hSCLC-conditioned medium (n = 3 independent experiments). o. Viability of shDAB1 hA cells at 48 hours. Data show mean with SD. n = 3 independent experiments. P values calculated via two-sided t-test when comparing two groups and via one-way ANOVA when comparing 3–4 groups.
Extended Data Fig. 9 |
Extended Data Fig. 9 |. Reelin expression is critical for the recruitment of GFAP+ astrocytes and the growth of SCLC brain metastases.
a. Cell viability of shCtrl (control) and shReln N2N1G cells measured by AlamarBlue assay (n = 3). b, c. Representative image and tumor size of shCtrl and shReln N2N1G subcutaneous allografts 21 days post-transplant. Scale bar, 5 mm. N = 9 from 2 experiments. d-f. Tumor size of shCtrl and shReln 16 T brain allografts (d), subcutaneous allografts (e), and liver metastases (f) 21 days post-transplant. N = 7 (shCtrl) and 8 (shReln) from 2 experiments in (d). N = 9 mice from 3 experiments in (e) and (f). g. Representative images of immunohistochemistry staining of Reelin (brown, with blue hematoxylin counterstain) on SCLC brain tumors generated by shCtrl and shReln N2N1G cells. Scale bar, 100 μm. Similar results were observed from 3 independent experiments. h-i. Representative images (h) and quantification (i, n = 3 independent experiments) of shCtrl and shReln SCLC cell migration from 3D cancer spheres in Matrigel. j. Representative images of immunofluorescent staining of GFAP (white) in SCLC brain tumors grown from a 1:1 mix of shCtrl and shReln2 16 T cells expressing mCherry (red) or GFP (green), as indicated. Blue: DAPI DNA stain. Scale bar, 20 μm. Yellow asterisk shows regions where astrocytes are absent. k. Quantification of tumor size in ( j). l-m. Quantification of the ratio between mCherry+ and GFP+ of 16T cells growing in the brain from (Fig. 6h and Extended Data Fig. 9j). N = 6 mice from 2 independent experiments. n. Representative images of immunofluorescent staining of CD31 and GFAP in shCtrl and shReln N2N1G brain allografts. GFP labels N2N1G cells, DAPI stain for nucleus. Scale bar, 20 μm. o-p. Quantification of CD31 level and perivascular GFAP-positive astrocytes in shCtrl and shReln N2N1G brain allografts. N = 4 tumors. q. Chemotaxis of mouse astrocytes in conditioned media from 4T1 cells, 4T1 cells expressing control vector, and 4T1 cells expressing mouse Reelin central domain. n = 3 independent experiments. r. Quantification of liver metastasis size by luciferase imaging of the abdomen of mice 14 days after intracardiac injections of 4T1 cells expressing control vector or mouse Reelin central domain (Leu1221-Ile 2661). N = 6 mice from 2 experiments. Data show mean with SD. P values calculated by two-sided t-test when comparing two groups and one-way ANOVA when comparing three or more groups.
Extended Data Fig. 10 |
Extended Data Fig. 10 |. Astrocytes activated by SCLC cells secrete factors promoting the survival of SCLC cells.
a. Volcano plot showing differentially expressed genes in hA co-cultured with NCI-H82 compared to hA alone. b. Gene ontology (GO) enrichment (top 9) for the genes that are upregulated in hA co-cultured with NCI-H82 compared to hA alone. c. Immunoassay (by WES capillary transfer) for SERPINE1 expression in naive hA and hA co-cultured with the NCI-H69 and SUBr1 human SCLC cell lines. HSP90 serves as a loading control. d. Quantification of (c) (n = 2 independent experiments). e. The expression level of SERPINE1 in astrocyte populations (as in Extended Data Fig. 2f) from N2N1G brain allograft tumor, tumor edge, and sham control brain. n = 3 biologically independent samples. f-g. Representative images and quantification of immunofluorescent staining of SERPINE1 in patient SCLC brain metastases. NCAM stains SCLC cells. GFAP stains astrocytes. DAPI stains nucleus. Scale bar, 20 μm. n = 3 samples. h. Ratio of active SERPINE1 measured by ELISA in culture medium from mouse astrocytes co-cultured with N2N1G cells for 2 days and then treated with DMSO (control) and Tiplaxtinin (5 μM). i. Cell viability (AlamarBlue assay) measured in N2N1G cells treated with recombinant mSERPINE1 and Tip (n = 3 experiments). j, k. Cell viability (AlamarBlue assay) measured in NCI-H69 cells ( j) and SUBr1 cells (k) treated with recombinant hSERPINE1 and the SERPINE1 inhibitor Tiplaxtinin (Tip) (n = 3 experiments). l-m. Relative cell viability (AlamarBlue assay) measured in NCI-H69 cells (l) and SUBr1 cells (m) cultured with hA compared to without hA, with or without Tiplaxtinin treatment (n = 3 experiments). n-o. Relative apoptosis (caspase3/7 activity) measured in NCI-H69 cells (n) and SUBr1 cells (o) cultured with hA compared to without hA, with or without Tip treatment (n = 3 experiments). p. Overlap between upregulated genes in NCI-H82 cultured with hA and N2N1G cells growing in the brain compared to subcutaneously. q. Apoptosis measured by cleaved caspase3/7 in shCtrl (control) and shReln N2N1G and 16T cells in culture. r. Immunoassay for SERPINE1 expression in N2N1G cells in Fig. 7m, n. Data show mean with SD. P values calculated via two-sided t-test when comparing two groups and one-way ANOVA when comparing three groups.
Fig. 1 |
Fig. 1 |. Brain developmental programmes are reactivated in cancer cells and stromal cells in an SCLC brain metastasis model.
a, Schematic description of the analysis of mouse N2N1G SCLC cells expressing GFP growing in brain, liver and subcutaneous tumours (SubQ). bd, Representative images (b) and quantification of immunofluorescence staining for Ki67 (c), cleaved caspase-3 (Casp3) (d) and N2N1G cells (GFP) on tumour sections (quantification is number of positive cells per area quantified = 2 × 104 μm2) as in (a) (n = 6 tumours from 2 independent experiments). Scale bars, 20 μm. e, UMAP analysis of scRNA-seq data from N2N1G cells isolated from brain, liver and subcutaneous allografts. f,g, Distribution of N2N1G cells isolated from brain, liver and subcutaneous allografts on the UMAP analysis plot (f) and the percentage of cells in each cluster (g). h, Schematic representation of the analysis of stromal cells from N2N1G brain allografts. The site without cancer cells (control (Ctrl)) also underwent surgery and sham injection. i, The percentage of specific cell types in GFP stromal cells from the tumour core, tumour edge and sham control. As1, astrocyte 1; As2, astrocyte 2; As3, astrocyte 3; Mg, microglia; Mn, monocyte; Mp, macrophage; Nr, neutrophil (see Extended Data Fig. 2d for all cell populations). j, GO enrichment for genes that are upregulated in astrocyte population 1 (As1). FDR, false discovery rate. k, Expression of a reactive astrocyte signature from scRNA-seq data of astrocytes isolated from an N2N1G brain tumour, its tumour edge and sham injection control brain. n = 3 biologically independent samples. l, Representative images showing immunofluorescence staining of GFAP (astrocytes) from N2N1G brain tumours (tumour core and edge) or control brain regions. Blue, DAPI DNA stain. Scale bar, 20 μm. m, Cell area of GFAP+ astrocytes as in (l). n = 3 tumours from 3 mice. Data are mean ± s.d. P values calculated by two-sided t-test.
Fig. 2 |
Fig. 2 |. Reactive astrocytes infiltrate SCLC brain metastases.
a, Representative image of brain metastasis sections with different numbers of GFAP+ astrocytes (by immunohistochemistry with haematoxylin counterstain). Scale bar, 100 μm. b. Quantification of human SCLC brain metastases from images as in (a). n = 52 SCLC patient brain metastases, with 5 areas for each sample analysed. c, Representative images showing GFAP immunostaining (with haematoxylin counterstain) on brain metastasis sections from patients with SCLC, lung adenocarcinoma (LUAD), breast cancer or melanoma. Arrowheads show astrocytes within SCLC tumours. Scale bars, 500 μm (top), 100 μm (bottom). Mag., magnification. d, Quantification of GFAP+ astrocytes as in (c) (n = 3 SCLC, n = 3 LUAD, n = 3 breast cancer and n = 2 patients with melanoma, with 5 tumour regions analysed for each). e, Representative images showing immunofluorescence staining for GFAP and human mitochondria (hMito, for cancer cells) on sections from tumours growing in the brain after intracranial injection of human cancer cell lines as noted. Blue, DAPI DNA stain. Scale bar, 20 μm. f, GFAP fluorescence intensity relative to hMito as in (e) (n = 3 tumours from 3 mice). g, Representative immunofluorescence for GFAP (reactive astrocytes), MAP2 (mature neurons) and OLIG2 (oligodendrocytes and precursors) on a section from an N2N1G SCLC brain allograft. Blue, DAPI DNA stain. RFU, relative fluorescence unit. Bottom: corresponding higher magnification images, showing tumour edge and tumour. Scale bars, 20 μm. h, Distribution of neurons, astrocytes and oligodendrocytes as in (g) (n = 9 tumours from 3 independent experiments, showing mean ± s.d.). i, Representative immunofluorescence of Ki67+ astrocytes on a section from a GFP+ N2N1G SCLC brain allograft. Arrowheads show nuclei of GFAP+ (grey) astrocytes. Cancer cells are GFP+ (green). Blue, DAPI DNA stain. Scale bar, 10 μm. j, Quantification of Ki67+ astrocytes as in i (n = 3 tumours from 3 mice). Data are mean ± s.d. P values by two-sided t-test when comparing two groups and one-way ANOVA when comparing three groups.
Fig. 3 |
Fig. 3 |. SCLC cells induce the migration of astrocytes.
a, Schematic description of SCLC–hCO assembloids. b, Representative images showing immunofluorescence staining of GFAP, MAP2 and GFP (for N2N1G SCLC cells) on sections from an assembloid at post-fusion day 10. Blue, DAPI DNA stain. Scale bar, 200 μm. c, Relative GFAP or MAP2 fluorescence intensity versus GFP as in (b) (n = 6 tumours from 2 experiments). d, Representative high-magnification image of immunofluorescence staining of GFAP and GFP (for mouse N2N1G cells) at the SCLC–hCO interface, showing the cell body of astrocytes within the SCLC aggregate (arrowheads). Blue, DAPI DNA stain. Scale bar, 20 μm. e, Representative images showing immunofluorescence staining of GFAP and GFP (for cancer cells) on sections from cancer cell–hCO assembloids using SCLC, NSCLC and breast cancer cells at post-fusion day 10. Blue, DAPI DNA stain. Scale bar, 200 μm. f, Relative GFAP fluorescence intensity to GFP in human cancer aggregates at post-fusion day 10 (n = 4 tumours from 2 experiments for each cell line). g, Schematic description of the Transwell migration (chemotaxis) assay. h,i, Quantification of mouse astrocyte (mA) chemotaxis (h) and viability (i) in control medium and N2N1G-conditioned medium after 48 h. n = 3 independent experiments. Data are mean ± s.d. P values by two-sided t-test.
Fig. 4 |
Fig. 4 |. The brain development transcription factor NFIB is required for the optimal growth of SCLC brain metastases.
a, Immunoassay for NFIB expression in N2N1G cells with control (shCtrl) and Nfib (shNfib) short hairpin RNA (shRNA). HSP90 serves as a loading control (n = 1). b, Representative haematoxylin and eosin (H&E)-stained sections from brain allografts from control (shCtrl) and shNfib N2N1G cells 18 days post-injection (shNfib-1 example shown). Scale bar, 1 mm. c, Quantification of tumour area from images as in (b) (n = 6 tumours from 2 experiments). d, Representative images of subcutaneous tumours from shCtrl and shNfib N2N1G cells 18 days post-injection. Scale bar, 5 mm. e, Quantification of weight of tumours imaged in (d) (n = 6 tumours from 2 experiments). f, Representative immunohistochemistry for NFIB expression in sections from shCtrl and shNfib N2N1G brain allografts and subcutaneous tumours 18 days after transplant (shNfib-1 examples shown). Scale bar, 20 μm. g, Representative image of immunofluorescence staining of GFAP (red) in brain allografts from control (shCtrl) and shNfib N2N1G cells 18 days post-injection (shNfib-1 example shown). Scale bar, 5 mm. h, Quantification of GFAP+ area and NFIB fluorescence intensity from images as in (g) (n = 11 regions from 4 tumours). i, Relative chemotaxis of mouse astrocytes in shCtrl and shNfib N2N1G-conditioned medium compared with control medium (n = 3 experiments). j, Relative viability of mouse astrocytes in shCtrl and shNfib N2N1G-conditioned medium compared with control medium (n = 3 experiments). k,l, Relative cell viability (k) and apoptosis (l) of control N2N1G and shNfib N2N1G cells co-cultured (cc) with mouse astrocytes compared to those cultured alone (n = 3 experiments). Data are mean ± s.d. P values calculated by two-sided t-test.
Fig. 5 |
Fig. 5 |. Reelin–Vldlr signalling regulates SCLC-induced astrocyte migration.
a, Receptor–ligand pair analysis on genes both upregulated in NFIB-high SCLC metastases and downregulated upon Nfib knockdown (KD) with upregulated genes in SCLC-associated astrocytes. b, Immunoassay for Reelin in shCtrl (control) and shNfib N2N1G cells. HSP90 serves as a loading control (n = 1). c, Representative images showing immunofluorescence staining of Reelin and GFP (cancer cells) and Vldlr and GFAP on an N2N1G brain allograft section. Blue, DAPI DNA stain. Scale bar, 50 μm. d, Co-localization of Reelin with GFP (SCLC cells) and Vldlr with GFAP (astrocytes) in N2N1G brain allografts (n = 3). e, Representative images of immunohistochemistry staining of REELIN in a brain metastasis and a normal brain area from a patient with SCLC. Scale bar, 100 μm. BM, bone marrow. f, Representative images of immunofluorescence staining of Vldlr and GFAP on an N2N1G brain allograft section. Blue, DAPI DNA stain. Scale bar, 50 μm. g, Quantification of Vldlr immunofluorescence intensity in astrocytes normalized to normal adult brain region from images as in (e) (N2N1G, n = 3 tumours). h, Immunoassay for Reelin in shCtrl and shRNA targeting Reln (shReln) N2N1G cells. HSP90 serves as a loading control (n = 1). i, Chemotaxis of mouse astrocytes (mA) with shCtrl and shReln (with or without recombinant mouse Reelin) N2N1G-conditioned culture medium compared with control culture medium (n = 3). j, As in (i) with human astrocytes (hA) and human NCI-68 cells (n = 3). k, Chemotaxis of shCtrl and shVLDLR hA in NCI-H69-conditioned culture medium compared with control culture medium (n = 3). l,m, Immunoassay (l) and quantification (m; n = 3) of DAB1 and phospho-DAB1 (pDAB1) (Tyr232) in human astrocytes (hA) treated with control medium or NCI-H69 conditioned medium. HSP90 serves as a loading control. Data are mean ± s.d. P values by two-sided t-test.
Fig. 6 |
Fig. 6 |. Reelin expression is critical for the recruitment of GFAP+ astrocytes in vivo and for the growth of SCLC brain metastases.
a,b, Representative H&E images (a) and tumour size (b) of shCtrl (control) and shReln N2N1G brain allografts 21 days post-transplant. Purple, tumour. Scale bar, 2 mm. n = 8 (shCtrl) and 9 (shReln) mice from 3 experiments. c,d, Representative H&E images (c) and tumour size (d) of shCtrl (control) and shReln N2N1G liver metastases 21 days post-transplant. n = 15 tumours from 4 mice. Scale bar, 2 mm. e, GFAP immunofluorescence staining on SCLC brain tumour sections (N2N1G cells). Blue, DAPI DNA stain. Scale bar, 20 μm. f, Astrocyte infiltration quantified by the mean fluorescence intensity for GFAP measured by the distance from tumour border in N2N1G brain tumours. n = 3 biologically independent samples. g, Description of the mixed tumour assay using shCtrl and shReln 16 T cells. h, GFAP immunofluorescence staining (white) in 16T brain tumours grown from a 1:1 mix of shCtrl and shReln cells expressing mCherry or GFP. Blue, DAPI DNA stain. Scale bar, 20 μm. Yellow asterisk shows regions where astrocytes are absent. i,j, GFAP+ astrocyte infiltration (i) and tumour size (j) from images as in (h). n = 6 mice from 2 independent experiments. k, Immunoassay for Reelin CTD–GFP expression in 4T1 cells expressing control vector or Reelin CTD (Leu1221–Ile2661 with GFP tag) (stained with an anti-GFP antibody). P, cell pellet; S, culture media supernatant. HSP90 serves as a loading control. OE, overexpression. l, Quantification of experiment in (k) (n = 2, pellet data, left bar), compared with endogenous levels of Reelin N2N1G cells (shCtrl samples in Fig. 5). m, GFAP immunofluorescence staining in brain metastases (day 14) from intracardiac injections of 4T1 cells. Arrowheads indicate infiltrated astrocytes. Scale bars, 20 μm (low magnification) and 10 μm (high magnification). n, GFAP level in the GFP+ tumour area in (m). n = 6 mice from 2 experiments. o, Quantification of brain metastasis size by luciferase imaging 14 days after intracardiac injections of 4T1 cells. n = 6 mice from 2 experiments. Data are mean ± s.d. P values by two-sided t-test when comparing two groups and one-way ANOVA when comparing three or more groups.
Fig. 7 |
Fig. 7 |. Astrocytes reactivated by SCLC cells upregulate anti-apoptotic programmes.
a, Volcano plot showing differentially expressed genes in human astrocytes co-cultured with NCI-H69 cells compared to human astrocytes cultured alone. Selected genes are indicated. Padj values calculated by the Wald test with correction for multiple comparison. b, GO enrichment (top 9) for genes upregulated in human astrocytes co-cultured with NCI-H69 cells. c, Overlap between upregulated genes in tumour-associated mouse astrocytes and human astrocytes co-cultured with SCLC cells. The 11 overlapping genes are indicated. d, Representative immunofluorescence staining images of GFAP and SERPINE1 in a brain tumour from N2N1G mouse SCLC cells. Blue, DAPI DNA stain. Scale bar, 50 μm (top) and 10 μm (bottom). e, Quantification of SERPINE1 immunofluorescence intensity in astrocytes normalized to normal adult brain region from images as in (d) (N2N1G, n = 3 tumours). f,g, Relative viability (f) and apoptosis (g) of N2N1G cells cultured with mouse astrocytes with or without the SERPIN1 inhibitor tiplaxtinin (Tip, 5 μM) compared to N2N1G cells cultured alone. n = 3 independent experiments. h, Dose–response (measured cell viability via Alamar blue) of tiplaxtinin on mouse astrocytes. Black, naive astrocytes. Red, astrocytes reactivated by N2N1G cells. RLU, relative luminescence unit. Data are mean ± s.d. P values by two-sided t-test when comparing two groups and one-way ANOVA when comparing three or more groups; P value calculated by two-way ANOVA in h.
Fig. 8 |
Fig. 8 |. Astrocytes recruited to SCLC promote brain tumour growth.
a, Quantification of tumour area after intracranial injection of N2N1G mouse cells with DMSO or tiplaxtinin (n = 6 tumours from 2 experiments) 14 days after injection. b,c, Representative images (b) and quantification (c) of immunofluorescence staining of GFAP in N2N1G allografts treated with DMSO control or tiplaxtinin 7 days after injection. n = 3 independent experiments. Scale bar, 20 μm. d,e, Representative immunofluorescence staining (d) and quantification of Casp3+ shCtrl and shReln N2N1G cells (e) growing in the brain of mice. n = 3 independent experiments. Scale bar, 20 μm. f,g, Representative immunofluorescence staining (f) and quantification (g) of Casp3+ shCtrl and shReln N2N1G cells overexpressing control vector or SERPINE1 (OE S1) when grown in the brain of mice. n = 3 independent experiments. Scale bar, 20 μm. h,i, Representative H&E images (h) and quantification (i) of tumour size from experiment in (f). Tumours appear dark purple. Scale bar, 2 mm. n = 3 independent experiments. j, Working model: SCLC is a neuroendocrine cancer whose neuronal features are often accentuated during tumour progression, including as SCLC cells reach the brain microenvironment. The neuronal programmes expressed by SCLC cells resemble those of neurons during early brain development and reactive astrocytes associated with SCLC cells in the brain also gain features of astrocytes during brain development. Secretion of the brain development molecule Reelin by SCLC cells recruits reactivated astrocytes to the brain metastasis site. Secretion of factors such as SERPINE1 by astrocytes in turn promotes the survival of SCLC cells.

References

    1. Chaffer CL & Weinberg RA A perspective on cancer cell metastasis. Science 331, 1559–1564 (2011). - PubMed
    1. Valiente M et al. The evolving landscape of brain metastasis. Trends Cancer 4, 176–196 (2018). - PMC - PubMed
    1. Suh JH et al. Current approaches to the management of brain metastases. Nat. Rev. Clin. Oncol 17, 279–299 (2020). - PubMed
    1. Bos PD et al. Genes that mediate breast-cancer metastasis to the brain. Nature 459, 1005–1009 (2009). - PMC - PubMed
    1. Lorger M & Felding-Habermann B Capturing changes in the brain microenvironment during initial steps of breast-cancer brain metastasis. Am. J. Pathol 176, 2958–2971 (2010). - PMC - PubMed

Publication types