. 2023 Dec;4(12):1648-1659.
doi: 10.1038/s43018-023-00645-5. Epub 2023 Oct 2.

Ex vivo drug response profiling for response and outcome prediction in hematologic malignancies: the prospective non-interventional SMARTrial

Affiliations

Ex vivo drug response profiling for response and outcome prediction in hematologic malignancies: the prospective non-interventional SMARTrial

Nora Liebers et al. Nat Cancer. 2023 Dec.

Abstract

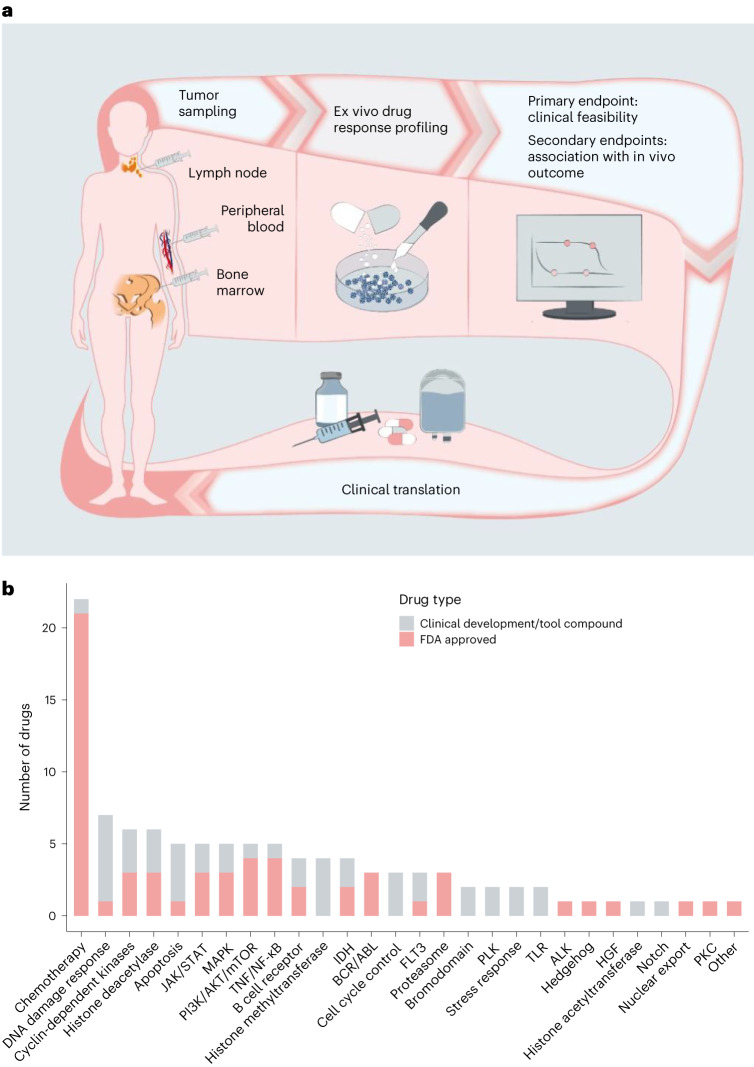
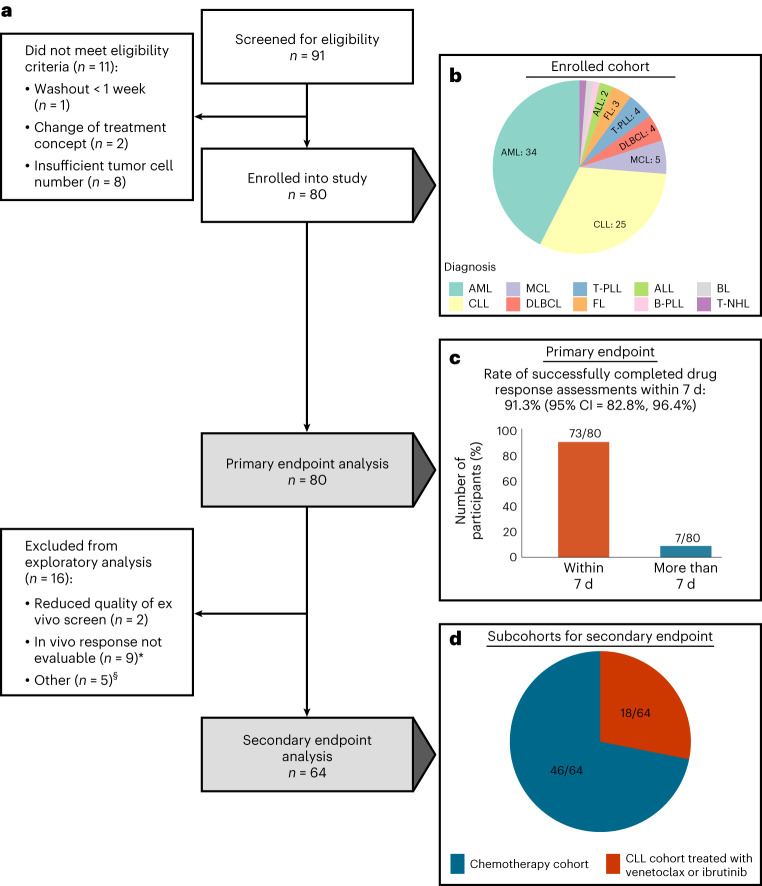
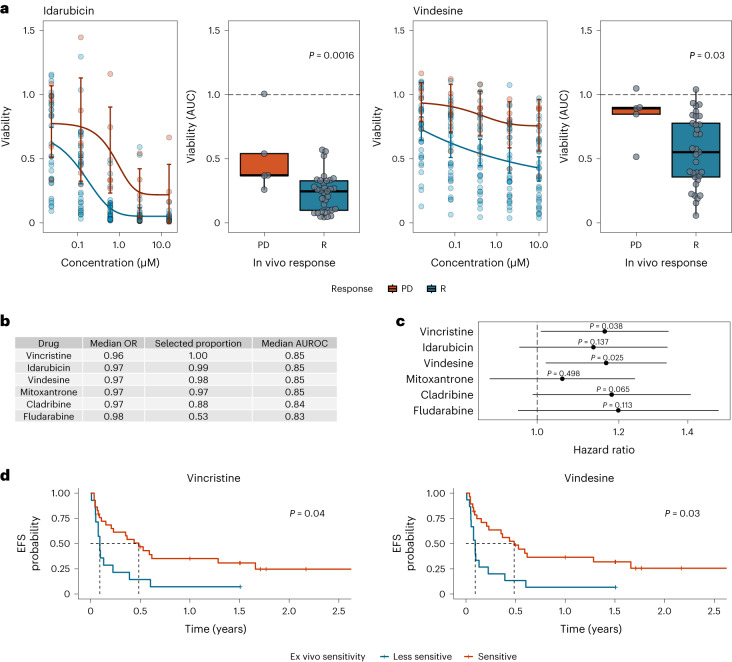
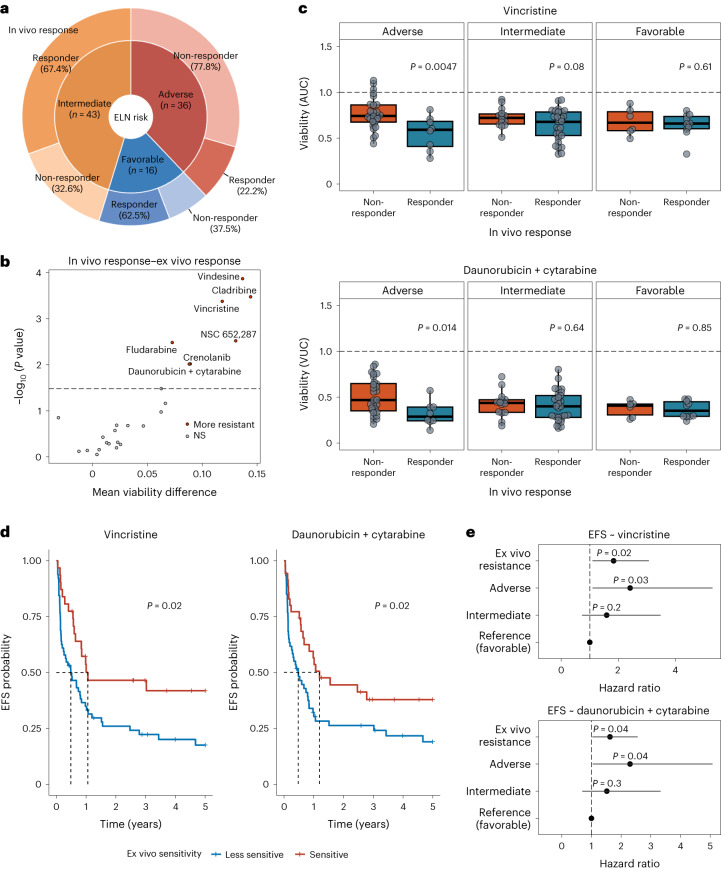
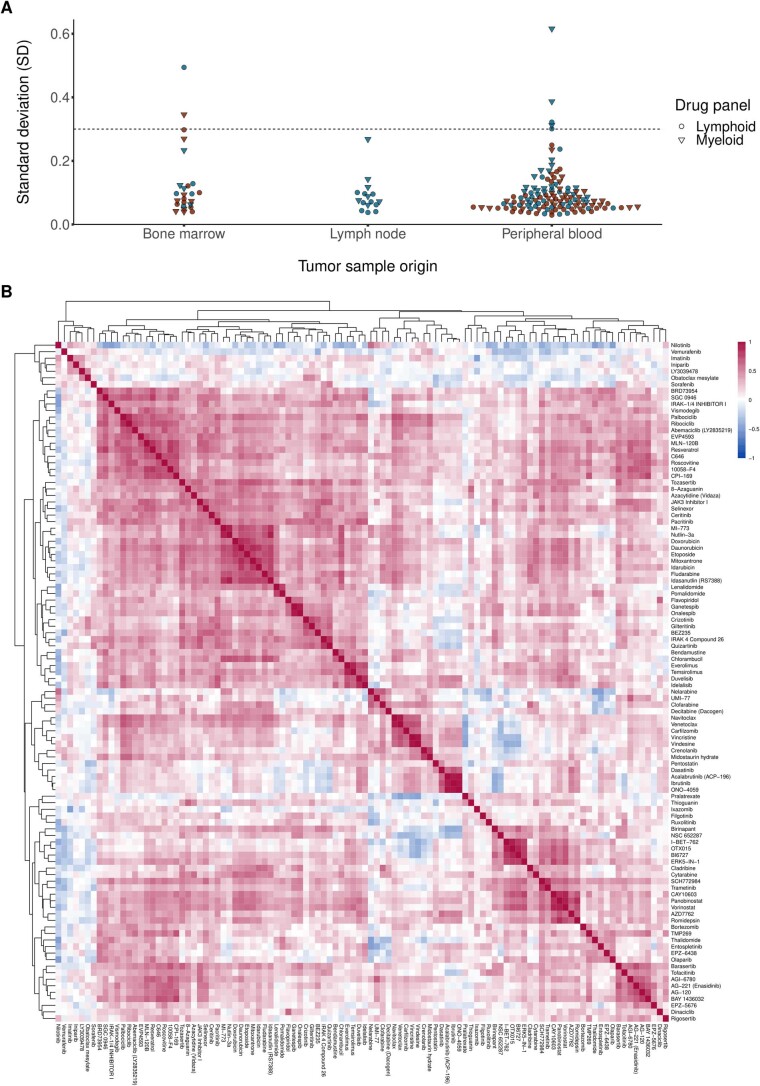
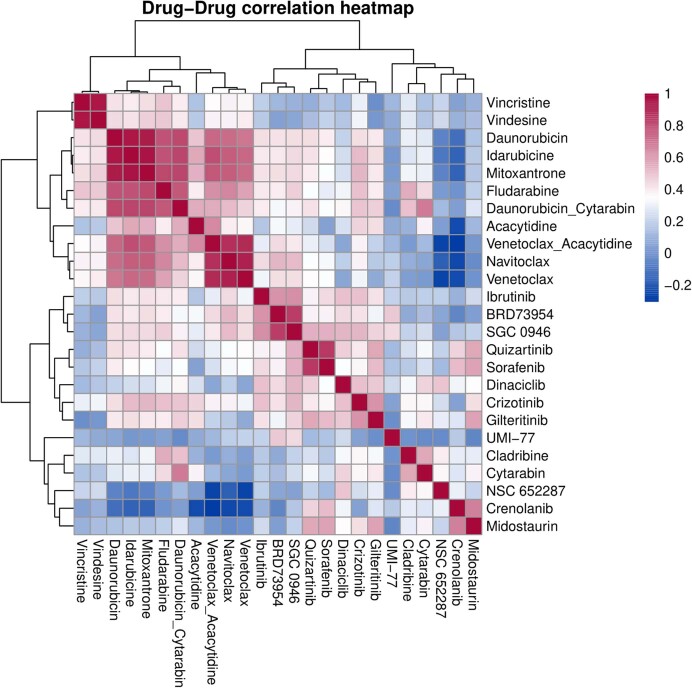
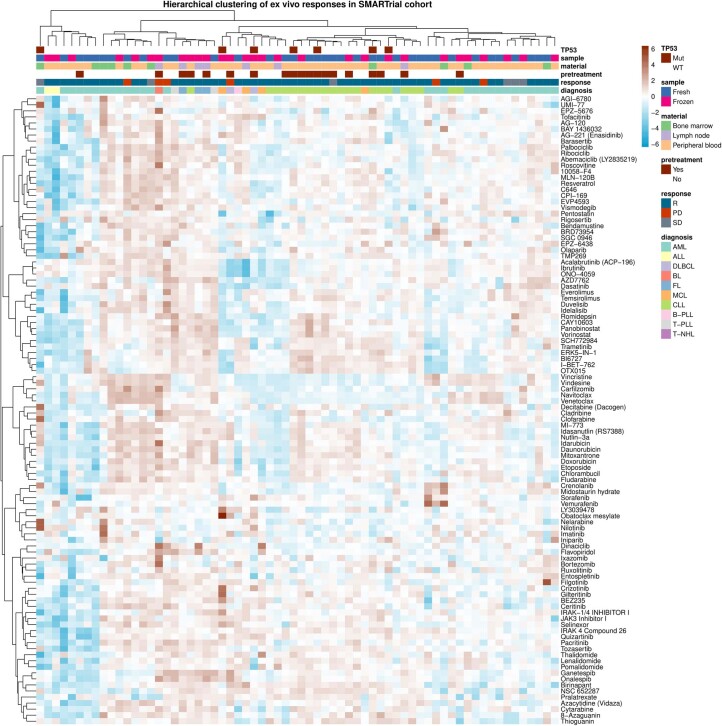
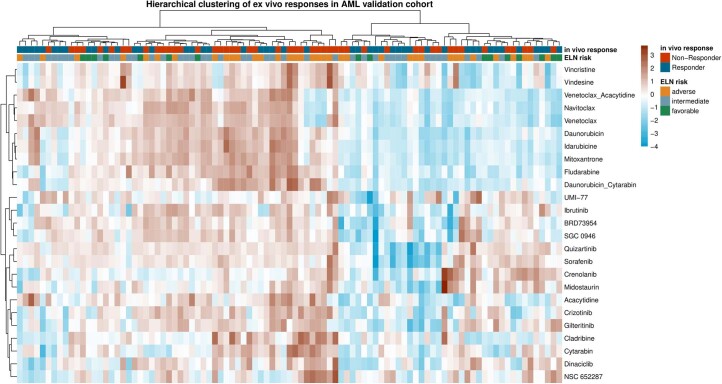
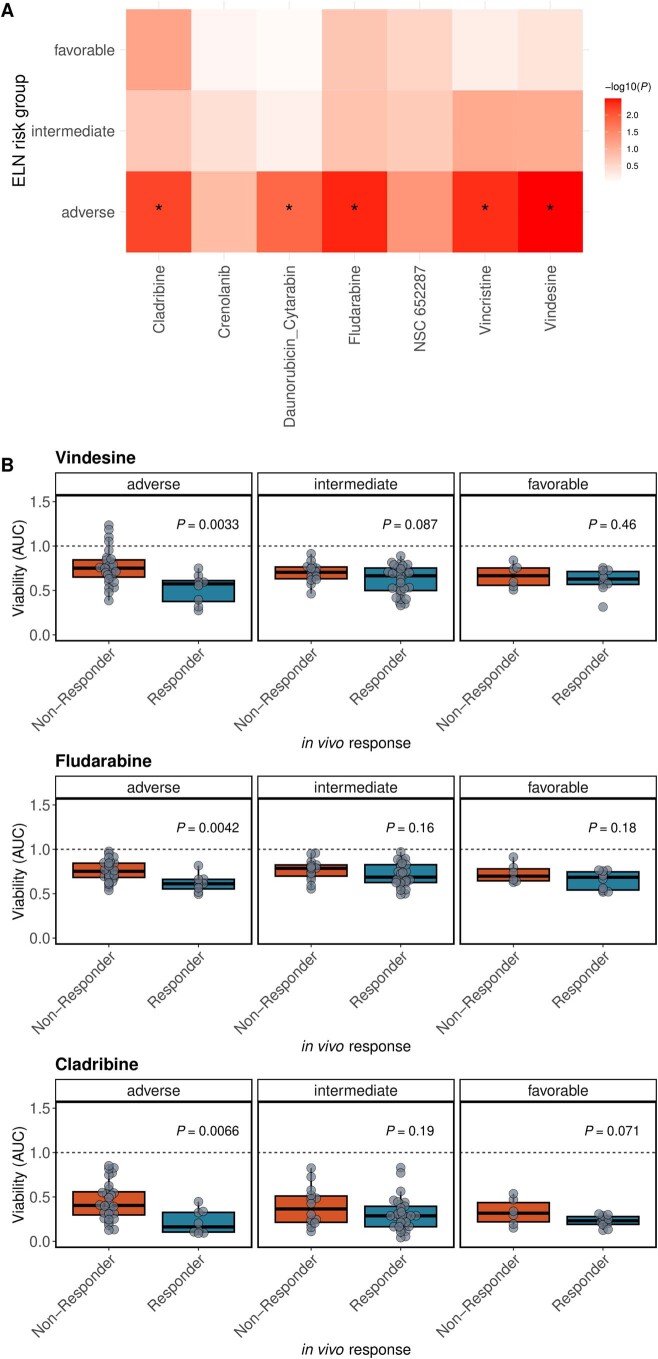
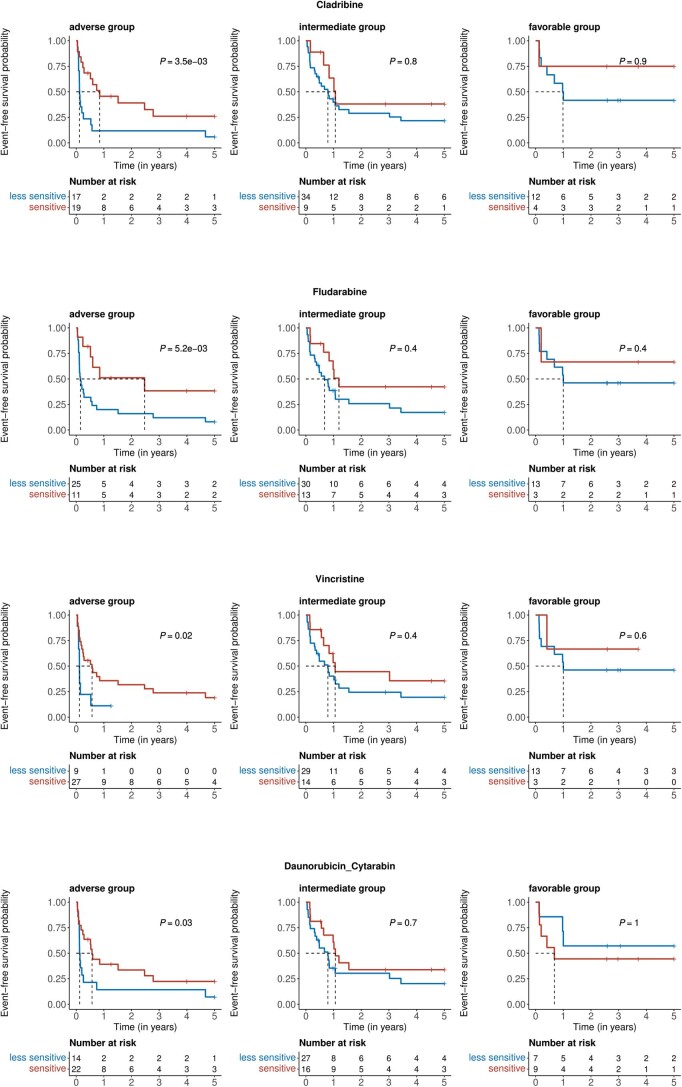
Ex vivo drug response profiling is a powerful tool to study genotype-drug response associations and is being explored as a tool set for precision medicine in cancer. Here we conducted a prospective non-interventional trial to investigate feasibility of ex vivo drug response profiling for treatment guidance in hematologic malignancies (SMARTrial, NCT03488641 ). The primary endpoint to provide drug response profiling reports within 7 d was met in 91% of all study participants (N = 80). Secondary endpoint analysis revealed that ex vivo resistance to chemotherapeutic drugs predicted chemotherapy treatment failure in vivo. We confirmed the predictive value of ex vivo response to chemotherapy in a validation cohort of 95 individuals with acute myeloid leukemia treated with daunorubicin and cytarabine. Ex vivo drug response profiles improved ELN-22 risk stratification in individuals with adverse risk. We conclude that ex vivo drug response profiling is clinically feasible and has the potential to predict chemotherapy response in individuals with hematologic malignancies beyond clinically established genetic markers.

Trial registration: ClinicalTrials.gov NCT03488641 NCT03096821.


Conflict of interest statement

The authors declare no competing interests.

Figures

Fig. 1
Fig. 1. Overview of study design and drug selection.
a, Outline of the prospective observational study. b, Overview of the drug classes in the compound library based on their targets/mode of action. FDA, Food and Drug Administration; TNF, tumor necrosis factor; IDH, isocitrate dehydrogenase; PLK, polo-like kinase 1; TLR, Toll-like receptor; HGF, hepatocyte growth factor; PKC, protein kinase C. Source data
Fig. 2
Fig. 2. Flow diagram and primary endpoint analysis.
a, Flow diagram of study participants and downstream analyses. The asterisk indicates that in nine individuals, the in vivo response was not evaluable due to the following reasons: scheduled treatment could not be initiated due to infection leading to death (n = 1), fulminant PD leading to early death (n = 1), scheduled treatment was denied by the participant before the start of treatment (n = 1) or within 14 d after treatment start (n = 1), scheduled treatment was prematurely discontinued due to side effects without prior response assessment (n = 2), scheduled treatment was discontinued several times due to side effects (n = 1) or response assessment was not available (n = 2). The section sign (§) indicates that five participants could not be assigned to the two subgroups (chemotherapy cohort and CLL cohort treated with venetoclax or ibrutinib) used for the secondary endpoint analysis. These participants were treated with palbociclib (n = 1), alemtuzumab (n = 1) and idelalisib ± rituximab (n = 2). One participant was treated with ibrutinib and rituximab but had a diffuse large B cell lymphoma. b, Enrolled participant cohort by diagnosis. c, Rate of successfully completed drug response assessments within 7 d (primary endpoint). d, Subcohorts for secondary endpoint analysis. MCL, mantle cell lymphoma; DLBCL, diffuse large B cell lymphoma; B-PLL, B cell prolymphocytic leukemia; T-NHL, T cell non-Hodgkin lymphoma. Source data
Fig. 3
Fig. 3. Association between ex vivo drug response and in vivo response or clinical outcome.
a, Ex vivo sensitivity by clinical response group. Dose–response curves built by fitting a five-parameter logistic model using ex vivo viability measurements. Individual participant observations are displayed by circles in both plots. Blue and red represent groups of participants with clinical response (R) versus participants with PD, respectively (R: n = 33; PD: n = 5). Error bars represent mean and 95% CI. Centers, hinges and whiskers of the box plots signify medians, quartiles and 1.5× IQR, respectively. b, Elastic net logistic regression model of ex vivo drug viability (AUC) to chemotherapeutic agents with binary endpoint R versus PD (R: n = 33; PD: n = 5). The median odds ratio (OR) presented here relates to a change in ex vivo drug viability of 10%. Covariates are shown ordered by selection proportion (>0.5 shown here). The results of all covariates included in the model are shown in Supplementary Table 2. c, Association of ex vivo drug responses and EFS assessed by univariate Cox regressions (R: n = 33; SD: n = 5; PD: n = 5). Estimated hazard ratios with corresponding 95% CIs are shown. Ex vivo drug viability (AUC) was calculated per drug and scaled such that a unit change of the regressor corresponds to a 10% change in cell viability. P values are from two-sided Wald tests on Cox regression models. d, Kaplan–Meier plots for EFS stratified by ex vivo drug response to vincristine and vindesine (R: n = 33; SD: n = 5; PD: n = 5). Participant groups of ex vivo responders and weak responders were defined by ex vivo drug responses dichotomized using maximally selected log-rank statistics to visualize effects. Fourteen of 43 participants were classified as vincristine weak responders, and 15 of 43 participants were classified as vindesine weak responders. Source data
Fig. 4
Fig. 4. Validation of the association between ex vivo and in vivo drug responses in a cohort of individuals with AML.
a, Overview of the validation cohort. The inner circle represents ELN-22 risk groups in total numbers, and the outer circle represents the distribution of in vivo responders and non-responders in ELN-22 risk groups. b, Ex vivo treatments with significantly different responses in in vivo responders (n = 47) and non-responders (n = 48). Negative log10 (P value) of Student’s t-tests is shown on the y axis, and mean difference between responders and non-responders is on the x axis. The dashed line represents the 10% false discovery rate cutoff (Benjamini–Hochberg procedure); NS, not significant. c, Viability (AUC) after ex vivo treatment with vincristine (top) and viability (volume under the curve (VUC)) after treatment with daunorubicin and cytarabine (bottom) separated by ELN-22 risk groups (ELN-22 adverse risk: non-responder: n = 28, responder: n = 8; ELN-22 intermediate risk: non-responder: n = 14, responder: n = 29; ELN-22 favorable risk: non-responder: n = 6, responder: n = 10). P values are derived from two-sided Student’s t-tests. Centers, hinges and whiskers of the box plots signify medians, quartiles and 1.5× IQR, respectively. d, Kaplan–Meier plots for EFS stratified by ex vivo drug response to vincristine and daunorubicin + cytarabine. For visualization purposes, participant groups of ex vivo responders and weak responders were defined by ex vivo drug responses dichotomized using maximally selected log-rank statistics to visualize effects. Sixty-four of 95 participants were classified as vincristine weak responders. Sixty of 95 participants were classified as daunorubicin + cytarabine weak responders. P values are from two-sided Wald tests on Cox regression models using drug responses as continuous variables. e, Forest plot of hazard ratios in multivariate Cox proportional hazards models for EFS including ELN-22 risk groups and viability after ex vivo treatment with vincristine (top) and daunorubicin + cytarabine (bottom). The ex vivo responses (AUC values) were centered by mean and scaled by 2 s.d. to bring them to a similar scale as the categorical ELN-22 risk group variables. Source data
Extended Data Fig. 1
Extended Data Fig. 1. Quality assessment of SMARTrial cohort.
(a) To estimate the technical variability of the performed assay, we calculated the standard deviation (SD) of all 16 inner DMSO controls for each individual drug plate per patient. Plates with a relatively high technical noise (SD of negative DMSO controls >0.3) were excluded from further analyses (excluded myeloid plates: S047, S050, S056, S062; excluded lymphoid plates: S047, S050, S062). For two patients (S047, S062), no additional tumor material was available for retesting and they were completely excluded from the subsequent analyses. (b) The heatmap shows the drug-drug correlations for all pairs of drugs. All patients with an evaluable drug response profiling were included (n = 78, exclusion of two patients with samples with relatively high technical noise). Pearson correlation coefficients were calculated from all ex vivo drug responses, measured as AUC of all concentrations per drug. Drug pairs with high correlation and anti-correlation are represented by red and blue squares, respectively. Drugs with similar mechanism strongly correlate with each other, for example BTK inhibitors: ibrutinib, tirabrutinib (ONO-4059), and acalabrutinib. Source data
Extended Data Fig. 2
Extended Data Fig. 2. Drug-drug correlations of ex vivo drug responses – Validation cohort.
The heatmap shows the drug-drug correlations for all pairs of drugs in all samples of the validation cohort (n = 95). Pearson correlation coefficients were calculated from all ex vivo drug responses, measured as AUC of all concentrations per drug. Drug pairs with high correlation and anti-correlation are represented by red and blue squares, respectively. Drugs with similar mechanism strongly correlate with each other, for example, navitoclax + venetoclax, vindesine + vincristine. The combination of daunorubicin and cytarabine correlates more strongly with daunorubicin than with cytarabine, indicating that the overall effect is more strongly driven by the toxicity caused by daunorubicin. Source data
Extended Data Fig. 3
Extended Data Fig. 3. Drug response heatmap – SMARTrial.
Heatmap showing ex vivo viability measurements after drug treatment for the SMARTrial cohort. The data are shown on a robust z-score scale, that is, the logarithm of the relative viability measurements was scaled by the median absolute deviation within each row. Red indicates increased viability, and blue indicates decreased viability. Samples are annotated for diagnosis, in vivo response, pre-treatment status, material type and TP53 mutation. n = 78. Source data
Extended Data Fig. 4
Extended Data Fig. 4. Drug response heatmap – validation cohort.
Heatmap showing ex vivo viability measurements after drug treatment for the AML validation cohort. The data are shown on a robust z-score scale, that is, the logarithm of the relative viability measurements was scaled by the median absolute deviation within each row. Red indicates increased viability, and blue indicates decreased viability. Samples are annotated for ELN-22 risk groups and in vivo response. n = 95. Source data
Extended Data Fig. 5
Extended Data Fig. 5. Association of ex vivo drug response phenotypes with genotype and clinical response groups.
(a) Ex vivo drug responses to FLT3 inhibitors in AML samples (n = 27, excluding AML with FLT3 TKD mutation or missing FLT3 status). Kendall’s Tau for the correlation of ex vivo drug response and FLT3-ITD ratio shown. Ex vivo response calculated as averaged normalized viability across the 2 lowest concentrations. (b) Ex vivo response to FLT3 inhibitors in AML by FLT3-TKD mutation status (n = 24, excluding AML with missing FLT3 status or a FLT3-ITD mutation). Ex vivo response calculated as averaged normalized viability across the 2 lowest concentrations. (c) Ex vivo drug response to venetoclax in AML samples by IDH mutation status (n = 28, excluding AML with missing IDH status). Ex vivo response calculated as viability (AUC) across 5 concentrations. (d) Ex vivo drug response to nutlin-3a by TP53 mutation status (n = 42, SMARTrial samples from all entities, excluding samples with a missing TP53 status). (C + D) Each dot represents one patient sample, the boxes show mean +/− standard deviation. P value from two-sided Student’s t-test. Ex vivo response calculated as viability (AUC) across all 5 concentrations. (e) Ex vivo viability (AUC) per patient averaged by pathway and mean viabilities per pathway compared between chemosensitive patients (Clinical response (R): n = 34) and chemorefractory patients (Progressive disease (PD): n = 7) shown. Bars indicate mean viability difference between response groups. Red and blue indicates reduced and increased viability in chemosensitive samples, respectively. The bars are arranged by effect size and direction. (f) Significance in individual drug effect size between the clinical response groups. Student’s two sample t-tests were performed using ex vivo drug viability (AUC) between chemosensitive patients (Clinical response (R): n = 34) and chemorefractory patients (Progressive disease (PD): n = 7). The y axis shows the negative logarithm of the P values. Drugs are grouped by pathway and averaged effect size of the pathway group. P values smaller than the significance threshold (α = 0.05) are labeled. Source data
Extended Data Fig. 6
Extended Data Fig. 6. Tumor cell infiltration.
(a) Association between tumor cell infiltration and ex vivo drug response to chemotherapeutic agents in patients treated with chemotherapy. Ex vivo drug response per patient was averaged within the group of chemotherapeutic agents. Pearson correlation coefficient and respective P value from two-sided Pearson correlation shown in the plot. (b) Tumor cell infiltration stratified by in vivo response groups. Each dot represents one patient sample, the boxes show mean +/− standard deviation. P value from two-sided Student’s t-test. (Clinical response (R): n = 34, Progressive disease (PD): n = 7). (c) Significance in individual drug effect size between the clinical response groups as shown in Fig. 3b. P values from two-sided Student’s t-test with (y-axis) and without (x-axis) taking tumor infiltration into account. Source data
Extended Data Fig. 7
Extended Data Fig. 7. Clinical translation of ex vivo drug response profiling in a patient with highly aggressive refractory Burkitt lymphoma.
(a) Normalized ex vivo effect size scores (ESS) of all chemotherapeutics for S005. The effect size (1- viability AUC) of each drug was subtracted from the median effect sizes of the same drug of the complete SMARTrial study cohort. A negative and positive ESS indicate a higher or lower effect size in this specific patient sample, respectively. S005 was less responsive to the majority of chemotherapeutics than the cohort median ex vivo. The ex vivo effect of pralatrexate was higher than the median effect across all SMARTrial samples. (b) PET-CT scans of participant S005. Left: PET-CT scan showing a progressive disease (PD) in the liver after previous treatment with R-DHAP (rituximab, high dose cytarabine, cisplatin, dexamethasone). Right: PET-CT scan after treatment with 3 cycles of methotrexate (MTX) and consolidating allogeneic hematopoietic cell transplantation (alloHCT). The patient achieved a partial response after treatment with MTX which enabled him to undergo alloHCT and eventually resulted in complete remission. (C + D) Association of in vivo and ex vivo response in CLL patients treated with venetoclax +/- anti- CD20 treatment (c) and ibrutinib (d). The ex vivo drug effect size is defined as 1-viability(AUC). Each bar represents one patient. The color of the bar represents in vivo response. Source data
Extended Data Fig. 8
Extended Data Fig. 8. Significantly different ex vivo drug responses between responders and non-responders.
(a) Boxplots showing viability (AUC in single-drug conditions and VUC in daunorubicin + cytarabine combination) after ex vivo drug treatment for drugs with significantly different responses in responders and non-responders. P-values from two-sided Students t-tests. Responder: n = 47, Non-responder: n = 48. Center, hinges and whiskers of the boxplots signify median, quartiles and 1.5x IQR, respectively. (b) Dose response curves for corresponding single drug conditions. Dose-response curves were built by fitting a 5-parameter logistic model for each clinical response group using ex vivo viability measurements across five drug concentrations. Individual patient observations are displayed by circles. Error bars represent mean and 95% CI. Responder: n = 47, Non-responder: n = 48. Source data
Extended Data Fig. 9
Extended Data Fig. 9. Significantly different ex vivo drug responses between responders and non-responders in ELN-22 risk groups.
(a) Heatmap of p-values from two-sided Student’s t-tests between ex vivo drug response and in vivo therapy response. BH-adjusted p-values below 0.1 are marked with an asterisk. (b) Boxplots showing viability (AUC) after ex vivo drug treatment for drugs with significantly different responses in responders and non-responders in ELN-22 risk subgroups. Corresponding to Fig. 4c. P-values from two-sided Students t-tests. Responder: n = 47, Non-responder: n = 48. Center, hinges and whiskers of the boxplots signify median, quartiles and 1.5x IQR, respectively. Source data
Extended Data Fig. 10
Extended Data Fig. 10. Significant associations of ex vivo drug responses and event free survival in ELN-22 risk groups.
Kaplan-Meier plots for event-free survival stratified by ex vivo drug response to cladribine, fludarabine, vincristine and daunorubicin + cytarabine and faceted by ELN-22 risk groups. Patient groups of ex vivo responders and weak responders were defined by ex vivo drug responses dichotomized using maximally selected log rank statistics to visualize effects. Absolute numbers per groups are shown in tables below the plots. P-values are from two-sided Wald tests on Cox regression models using drug responses as continuous variables. Source data

References

    1. Mikhael JR, et al. Management of newly diagnosed symptomatic multiple myeloma: updated Mayo Stratification of Myeloma and Risk-Adapted Therapy (mSMART) consensus guidelines 2013. Mayo Clin. Proc. 2013;88:360–376. doi: 10.1016/j.mayocp.2013.01.019. - DOI - PubMed
    1. Hoelzer D, et al. Acute lymphoblastic leukaemia in adult patients: ESMO clinical practice guidelines for diagnosis, treatment and follow-up. Ann. Oncol. 2016;27:v69–v82. doi: 10.1093/annonc/mdw025. - DOI - PubMed
    1. Alaggio R, et al. The 5th edition of the World Health Organization Classification of Haematolymphoid Tumours: lymphoid neoplasms. Leukemia. 2022;36:1720–1748. doi: 10.1038/s41375-022-01620-2. - DOI - PMC - PubMed
    1. Dohner H, et al. Diagnosis and management of AML in adults: 2022 recommendations from an international expert panel on behalf of the ELN. Blood. 2022;140:1345–1377. doi: 10.1182/blood.2022016867. - DOI - PubMed
    1. Khoury JD, et al. The 5th edition of the World Health Organization Classification of Haematolymphoid Tumours: myeloid and histiocytic/dendritic neoplasms. Leukemia. 2022;36:1703–1719. doi: 10.1038/s41375-022-01613-1. - DOI - PMC - PubMed

Publication types

MeSH terms

Associated data