. 2023 Oct;4(10):1474-1490.
doi: 10.1038/s43018-023-00642-8. Epub 2023 Oct 2.

A T cell receptor targeting a recurrent driver mutation in FLT3 mediates elimination of primary human acute myeloid leukemia in vivo

Affiliations

A T cell receptor targeting a recurrent driver mutation in FLT3 mediates elimination of primary human acute myeloid leukemia in vivo

Eirini Giannakopoulou et al. Nat Cancer. 2023 Oct.

Abstract

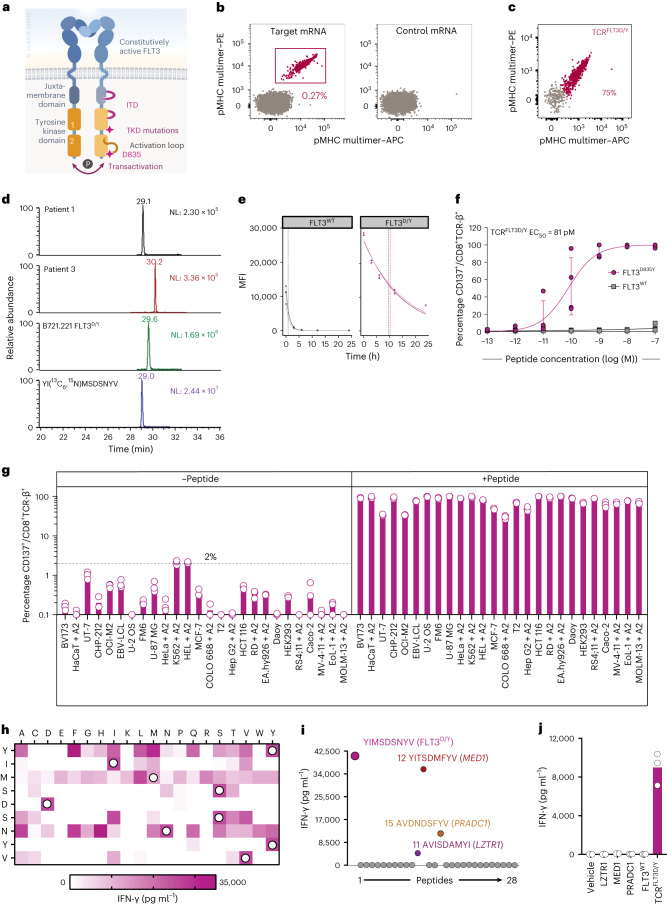
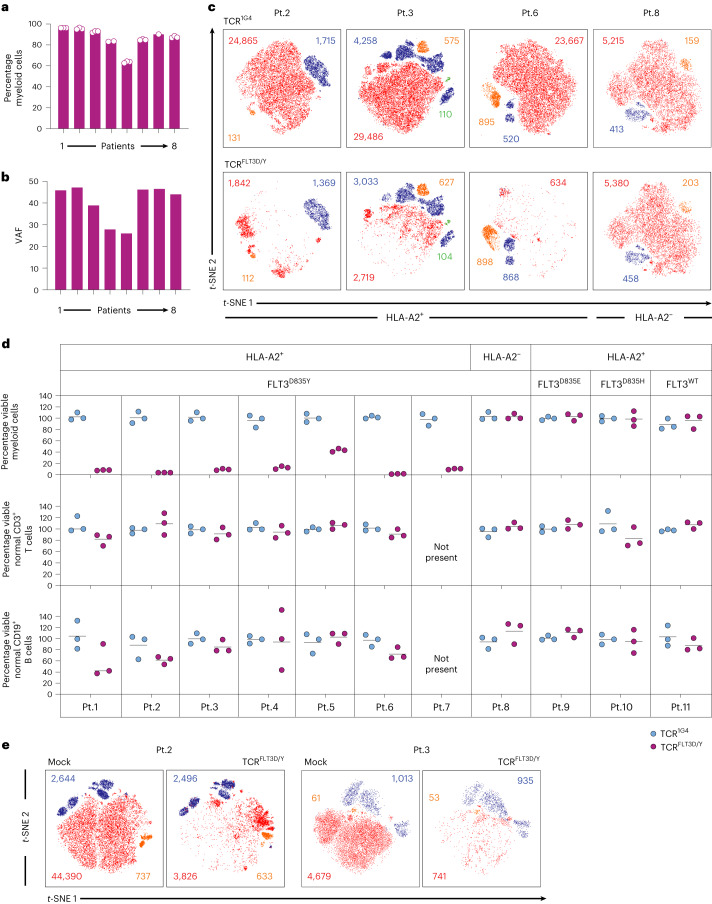
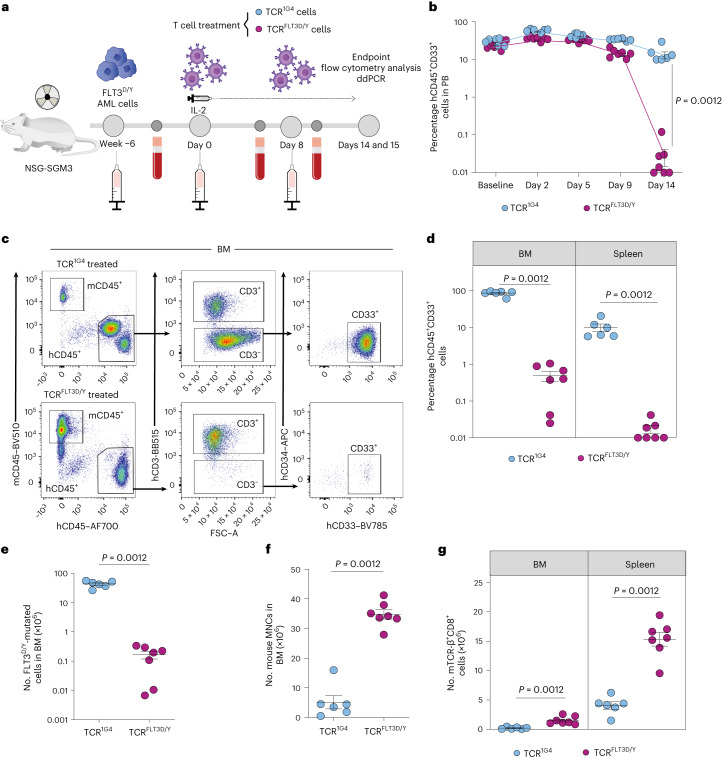
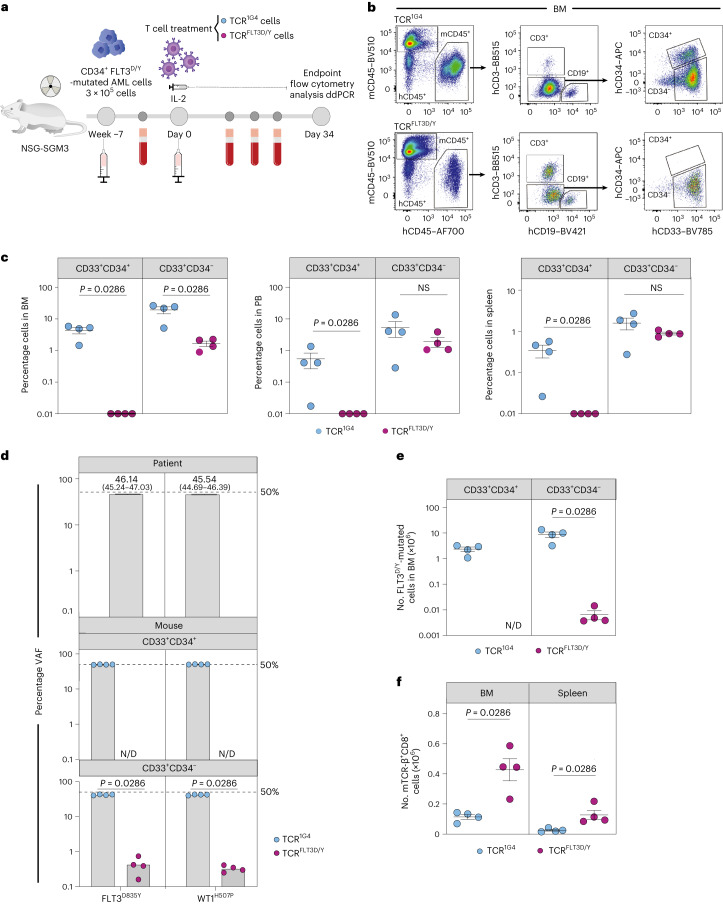
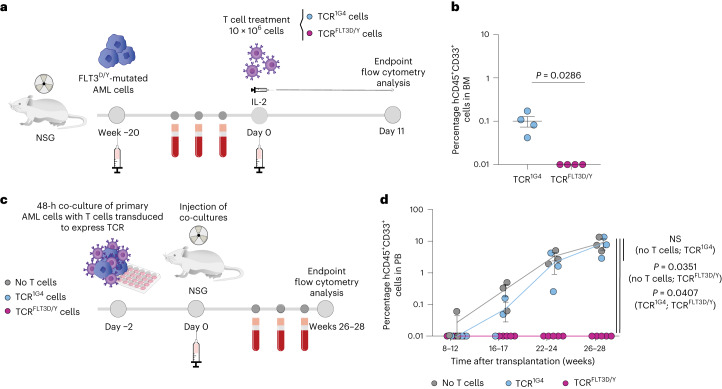
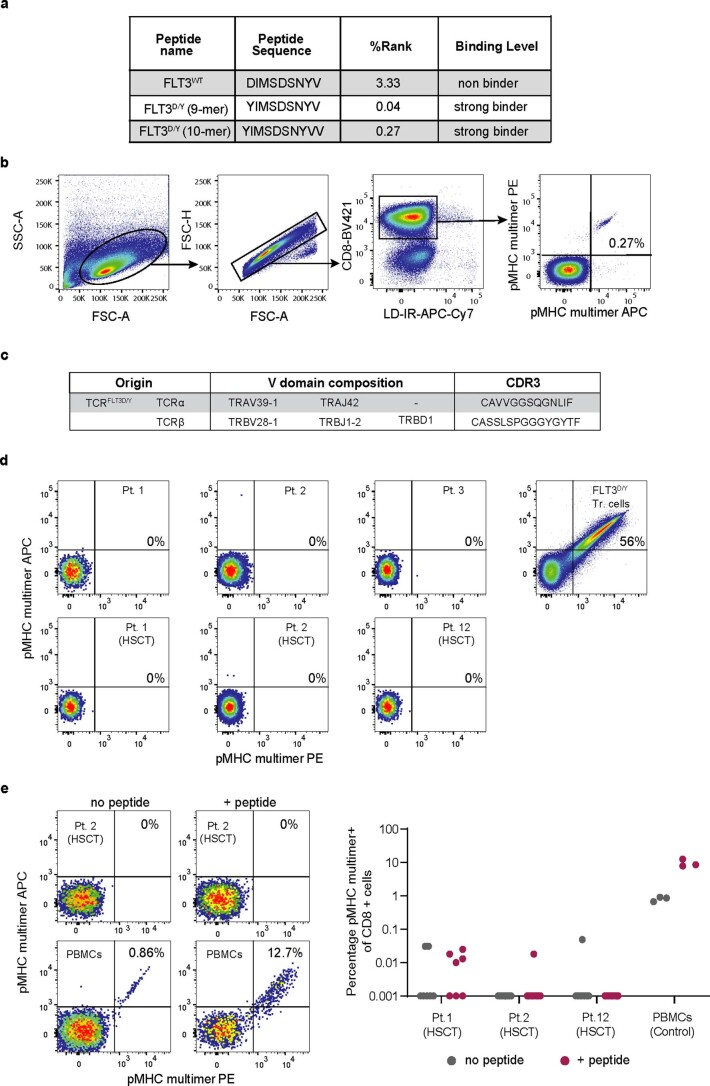
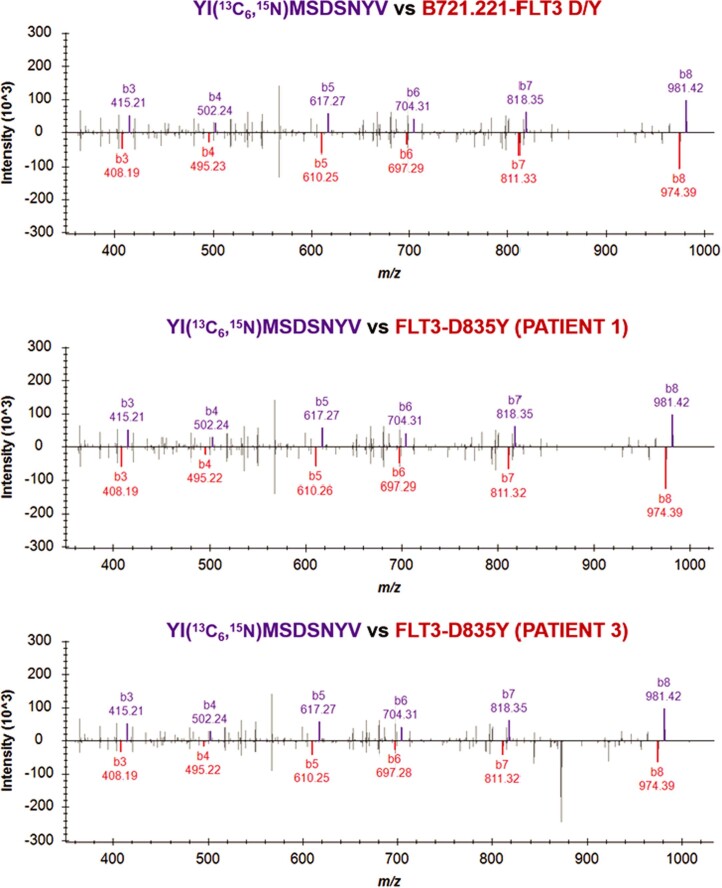
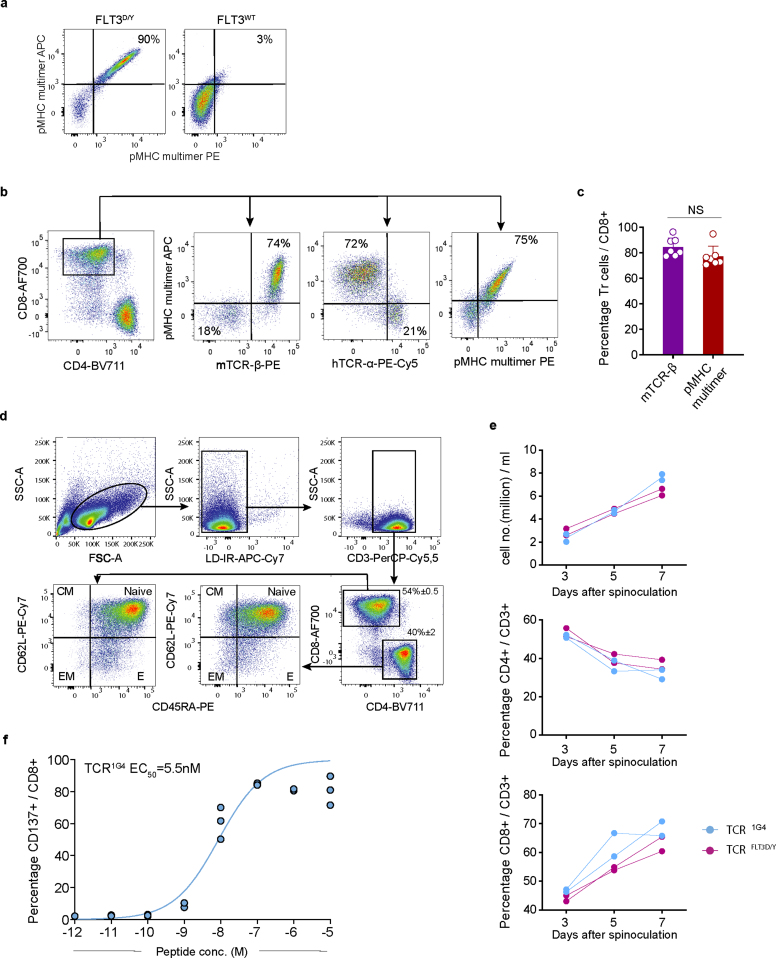
Acute myeloid leukemia (AML), the most frequent leukemia in adults, is driven by recurrent somatically acquired genetic lesions in a restricted number of genes. Treatment with tyrosine kinase inhibitors has demonstrated that targeting of prevalent FMS-related receptor tyrosine kinase 3 (FLT3) gain-of-function mutations can provide significant survival benefits for patients, although the efficacy of FLT3 inhibitors in eliminating FLT3-mutated clones is variable. We identified a T cell receptor (TCR) reactive to the recurrent D835Y driver mutation in the FLT3 tyrosine kinase domain (TCRFLT3D/Y). TCRFLT3D/Y-redirected T cells selectively eliminated primary human AML cells harboring the FLT3D835Y mutation in vitro and in vivo. TCRFLT3D/Y cells rejected both CD34+ and CD34- AML in mice engrafted with primary leukemia from patients, reaching minimal residual disease-negative levels, and eliminated primary CD34+ AML leukemia-propagating cells in vivo. Thus, T cells targeting a single shared mutation can provide efficient immunotherapy toward selective elimination of clonally involved primary AML cells in vivo.


Conflict of interest statement

A patent application has been filed by the Oslo University Hospital institutional technology transfer office Inven2 protecting the TCR sequence (J.O. and E.G. are inventors). J.O. is on the scientific advisory board of Asgard Therapeutics and is a cofounder of T-Rx therapeutics, a company that aims to develop TCR T cell therapies. The other co-authors declare no competing interests.

Figures

Fig. 1
Fig. 1. TCRFLT3D/Y cells specifically recognize mutated peptide with high sensitivity in an HLA-A2-restricted manner and do not show off-target reactivity.
a, Schematic illustration of FLT3. TKD, tyrosine kinase domain. b, Naive CD8+ T cells co-cultured with autologous HLA-A2+ mRNA-transfected moDCs stained with FLT3D/Y pMHC multimers. c, CD8+ T cells transduced to express TCRFLT3D/Y stained with FLT3D/Y pMHC multimers (Gating strategy in Extended Data Fig. 3b). d, Parallel reaction-monitoring analysis, targeting the FLT3D835Y peptide (m/z = 1,091.43891+) in primary AML cells from two patient samples and the B721.221 cell line transduced to express FLT3D835Y and HLA-A2. NL = normalization level. e, Off-rates for FLT3WT or FLT3D/Y peptide binding to HLA-A2 measured by flow cytometry. Vertical lines indicate calculated half-lives in each experiment. Dots represent mean fluorescence intensity (MFI) values of intact pMHC complexes on fluorescent particles at the indicated time points (h) (one replicate per experiment, n = 3 independent experiments). f, Activation of TCRFLT3D/Y cells (CD137+) co-incubated with peptide-pulsed K562 cells. Data points are from n = 4 donors transduced to express TCR in n = 3 independent experiments, with each circle representing the mean of three technical replicates per donor, shown as mean ± s.e.m. g, Activation of CD8+ TCRFLT3D/Y cells co-incubated with HLA-A2+ cell lines with or without FLT3D/Y peptide. Results are from one experiment representative of n = 4 (BV173, CHP-212, EBV-LCL, K562, Daoy, RS4;11), n = 3 (HaCaT, U-2 OS, FM6, U-87 MG, HeLa, MV-4-11, EoL-1, MOLM-13) or, for the remaining cell lines, n = 2 independent experiments using different T cell donors; data points represent n = 3 technical replicates. The suffix + A2 denotes that cell lines were transduced with HLA-A*02:01, whereas remaining cell lines naturally express it. Connecting lines in f and bars in g show mean. The dashed line in g shows the highest level of activation by cell lines alone. hj, IFN-γ produced by TCRFLT3D/Y cells co-incubated with K562 cells loaded with peptides from the mimotope library (h) or pulsed with the peptides that were predicted as potentially cross-reactive from the in silico search (i) or transfected with mRNA constructs encoding 30–32-mer peptides with the candidate cross-reactive peptide inducing reactivity (shown in i) in the middle, flanked by its naturally occurring sequence, or transfected with mRNA encoding the FLT3D/Y epitope or FLT3WT (j). White circles in h, amino acids of the FLT3D/Y peptide. Positive reaction for IFN-γ, 5,000–35,000 pg ml−1. LZTR1, leucine zipper-like post-translational regulator 1; MED1, mediator complex subunit 1; PRADC1, protease-associated domain-containing protein 1. Data in hj are from one of n = 2 independent experiments, and individual data points represent one (h,i) or three (j) technical replicates. Source data
Fig. 2
Fig. 2. TCRFLT3D/Y cells efficiently kill primary AML cells harboring the FLT3D835Y mutation in vitro but spare normal lymphoid cells.
a, Percentage myeloid cells of live leukocytes for patients (Pt.) 1–8 with AML; gating strategy is shown in Extended Data Fig. 6a. Dots represents technical replicates from one representative experiment as described in d. b, PB or BM FLT3D/Y VAF for patients 1–8 as determined by next-generation sequencing. c, Representative t-distributed stochastic neighbor embedding (t-SNE) plots showing live primary myeloid cells (CD3CD19CD20 events) in red, T cells (CD3+) in blue, B cells (CD19+CD20+) in orange and normal CD34+lin progenitor cells in green from n = 3 representative HLA-A2+ FLT3D/Y patients (patients 2, 3 and 6) with AML and one HLA-A2 FLT3D/Y patient (patient 8) following 72 h of co-culture with TCR1G4 (negative control, top) or TCRFLT3D/Y cells (E:T ratio, 1:2) as quantified by flow cytometry. Cells transduced to express TCR were excluded from analysis as CellTrace Violet (CTV)-positive events. d, Diagnostic samples from 11 patients with AML and the FLT3D/Y (patients 1–8), FLT3D/E (patient 9) or FLT3D/H (patient 10) mutation or FLT3WT (patient 11) (all HLA-A2+ except patient 8), analyzed as described in c. Each dot represents the fraction of live myeloid cells, B cells or T cells after co-culture with TCRFLT3D/Y cells (purple) in percent mean of the corresponding numbers in cultures treated with TCR1G4 cells (blue). Data points represent n = 3 technical replicates, and horizontal lines show means. Data shown are from one experiment representative of two to four experiments performed for each patient sample (n = 1 only for patient 7). e, t-SNE plots of PB diagnostic samples from patients 2 and 3 with AML showing live myeloid, T and B cells (color coded as in Fig. 2c) after 72 h of co-culture with autologous T cells transduced to express TCRFLT3D/Y or the mock control. Inset numbers in c,e denote absolute event counts of the indicated cell populations. The gating strategy is shown in Extended Data Fig. 6e. Source data
Fig. 3
Fig. 3. TCRFLT3D/Y cells efficiently target primary AML in mice with high leukemic burden.
a, Schematic overview of the PDX in vivo model with FLT3D835Y-mutated primary AML cells from patient 7. b, Percentage of human hCD45+CD33+ cells in PB at baseline (1 d before T cell infusion) and on the indicated days after infusion with TCR1G4 (n = 6 mice) or TCRFLT3D/Y (n = 7 mice) cells. Numbers were adjusted for hCD3+ T cells. c, Representative flow cytometry plots of viable single BM mononuclear cells (MNCs) from TCR1G4 (top) and TCRFLT3D/Y (bottom) cell-treated NSG-SGM3 mice stably engrafted with primary AML FLT3D/Y cells from patient 7. d, Percentage of hCD45+CD33+ cells in the BM and spleen at terminal analysis 15 d after T cell infusion. Numbers were adjusted for hCD3+ T cells. e, Number of FLT3D835Y-mutated BM hCD45+CD3 cells determined by ddPCR. f,g, Number of mouse (m)CD45+ cells in BM (f) and mTCR-β+CD8+ cells in the BM and spleen (g) at the endpoint. All data are presented as mean ± s.e.m. and were generated from one experiment including six mice treated with TCR1G4 cells and seven mice treated with TCRFLT3D/Y cells. Each dot represents one mouse, and statistical analysis was performed with two-tailed Mann–Whitney test. P values are shown, and P < 0.05 was considered statistically significant. Source data
Fig. 4
Fig. 4. TCRFLT3D/Y cells eliminate primary CD34+ AML in vivo.
a, Schematic overview of the PDX in vivo model with FLT3D835Y-mutated primary AML cells from patient 1. b, Representative flow cytometry plots of BM from TCR1G4 (top) and TCRFLT3D/Y (bottom) cell-treated NSG-SGM3 mice stably engrafted with primary AML FLT3D/Y cells from patient 1. Equivalent gating was also used for PB and the spleen. c, Percentage of hCD45+CD33+CD34+ and hCD45+CD33+CD34 cells in the BM, PB and spleen at the endpoint (day 34 after T cell infusion) of TCR1G4 (n = 4 mice) or TCRFLT3D/Y (n = 4 mice) cell-treated mice. Numbers were adjusted for hCD3+ T cells. NS, not significant. d, Percentage VAF determined by ddPCR of FLT3D835Y and WT1H507P driver mutations in primary BM cells from patient 1 (top) and hCD45+CD33+CD34+ (middle) and hCD45+CD33+CD34 (bottom) cells from TCR cell-treated mice. N/D, not analyzed due to insufficient hCD45+CD33+CD34+ cells. Numbers show VAF and 95% confidence intervals. The dashed line at 50% indicates 100% clonality unless loss of heterozygosity. No significant differences in VAFs of the FLT3D835Y and WT1H507P mutations were observed. e, Number of FLT3D835Y-mutated hCD45+CD33+CD34+ and hCD45+CD33+CD34 cells in the BM as determined by ddPCR. N/D, not detected due to lack of hCD45+CD33+CD34+ cells. f, Number of mTCR-β+CD8+ cells in the BM and spleen at the endpoint. All data are presented as mean ± s.e.m. from terminal analysis 34 d after T cell infusion from one experiment including four mice treated with TCR1G4 cells and another four mice treated with TCRFLT3D/Y cells. Each dot represents one mouse, and statistical analysis was performed with two-tailed Mann–Whitney test. P values are shown, and P < 0.05 was considered statistically significant. Source data
Fig. 5
Fig. 5. TCRFLT3D/Y cells efficiently kill primary AML in an MRD setting and eliminate leukemia-propagating cells.
a, Schematic overview of the MRD PDX in vivo model with FLT3D835Y-mutated primary AML cells from patient 1. b, Percentage of hCD45+CD33+ cells in the BM of NSG mice engrafted with low levels of AML after treatment with TCR1G4 (n = 4 mice) or TCRFLT3D/Y (n = 4 mice) cells 11 d after T cell infusion. Numbers were adjusted for hCD3+ T cells. Data are presented as mean ± s.e.m. and were generated from one experiment. Each dot represents one mouse, and statistical analysis was performed with two-tailed Mann–Whitney test. c, Schematic overview of the PDX in vivo model with FLT3D835Y-mutated primary AML cells from patient 1 after in vitro targeting with TCR1G4 or TCRFLT3D/Y cells. d, Percentage of hCD45+CD33+ cells in PB at the indicated time after transplantation of primary AML cells from patient 1 following 48 h of co-culture without T cells (n = 3 mice) or with TCR1G4 (n = 3 mice) or TCRFLT3D/Y (n = 5 mice) cells. Data are presented as mean ± s.e.m. and were generated from two independent experiments. Each dot represents one mouse, and statistical analysis was performed by multilevel linear regression using the R package ‘lmerTest’ (further described in the Methods). P values are shown, and P < 0.05 was considered statistically significant. Source data
Extended Data Fig. 1
Extended Data Fig. 1. T cells reactive to FLT3D/Y HLA-A2 can be induced by culture of naïve healthy donor T cells but are not identified among memory T cells from AML patients in diagnostic samples or following HSCT.
(a) Predicted binding affinity of FLT3D/Y and FLT3WT peptides using the NetMHC-4.0 algorithm. Peptides with affinity <50 nM (EL%Rank <0.500) classify as strong binders, 50 nM<affinity<500 nM (EL%Rank <2.000) as weak binders and affinity >500 nM as non- binders. (b) Gating strategy to identify CD8+ T cells staining as double positive events for pMHC multimers (APC- and PE-conjugated) complexed with the FLT3D/Y peptide. The three left plots show gates used for FSC/SSC, singlets and Live/Dead Fixable Near- IRneg/CD8+ events. The plot to the right shows multimer positive events in co-culture of naïve healthy donor CD8+ T cells with autologous moDCs transfected with target mRNA. (c) The TCRFLT3D/Y sequence. (d) Staining of samples from AML patients taken at point of diagnosis (top row, left three panels) and post allo-HSCT (bottom row) with pMHC multimers. TCRFLT3D/Y transduced T cells were used as a positive control for multimer staining (top right). (e) Staining of samples obtained from patient 2 after allo-HSCT following 5 days of in vitro expansion in absence (left) and presence (right) of the FLT3D/Y peptide (top panels). As positive control for in vitro expansion of memory T cells, TCRFLT3D/Y T cells were spiked into autologous healthy PBMCs under the same conditions (bottom panels). Inset numbers represent the percentage of pMHC multimer+ cells out of CD8+ cells. The graph to the right shows data for all three patients and positive controls. Data shown are from one experiment with each dot representing a technical replicate (n = 7 for pt 1, n = 12 for pt 2, n = 8 for pt 12 and n = 3 for PBMC healthy donor). Source data
Extended Data Fig. 2
Extended Data Fig. 2. Tandem mass spectra of endogenous vs isotopically labelled peptide.
Mirror image plots comparing the fragmentation spectra of endogenous FLT3D/Y peptide to its isotopically labelled counterpart YI(13C6,15 N)MSDSNYV. Spectra obtained from immunoprecipitated HLA derived from the B721.221 cell line retrovirally transduced with a minigene encoding the D835Y mutation, and from patient 1 and patient 3, are displayed.
Extended Data Fig. 3
Extended Data Fig. 3. TCRFLT3D/Y cells maintain a predominantly naïve phenotype following expansion.
(a) Staining of TCRFLT3D/Y cells with pMHC multimers complexed with either the FLT3D/Y or the FLT3WT peptide (each multimer conjugated to both APC and PE, gating strategy shown in Extended Data Fig. 1b. Data shown is from one representative donor out of two stained in one experiment. (b) Gating strategy for TCRFLT3D/Y cells. Panels show gating on: CD8+ cells labeled with the APC pMHC multimer and antibodies reactive to mouse TCR-β or human TCR-α (middle panels), and CD8+ cells staining positively for APC and PE-labeled pMHC multimers complexed with the FLT3D/Y peptide (right plot). (c) Percentage of mTCR-β+ cells or pMHC multimer+ cells among CD8+ cells following transduction with the TCRFLT3D/Y. Each data point represents a different HLA-A2pos donor (n = 7 donors from 3 independent experiments). Data are analyzed by unpaired, two-tailed Student’s t-test and p < 0.05 was considered statistically significant. (d) Gating strategy to identify differentiation stages of TCR-transduced T cells three days after spinoculation. Top panels show gating on FSC/SSChi, Live/Dead Fixable Near-IRneg, CD3+ events. Bottom panels show gating on CD4+ or CD8+ populations and subsequent identification of naïve, central memory (CM), effector (E) and effector memory (EM) cells as defined by expression of CD45RA and CD62L analyzed in two donors in one experiment. (e) Expansion of HLA-A2pos PB T cells from two donors transduced in parallel with the TCRFLT3D/Y or TCR1G4 following indicated days after retroviral transduction. Data are from one experiment and dots represent one technical replicate for each HLA-A2pos PB T cell donor. (f) Activation of TCR1G4 cells measured as upregulation of CD137 after co-incubation with peptide-pulsed (NY-ESO-1 peptide SLLMWITQC) BV173 cells (K562 cells were not used, in contrast to Fig. 1f, as they express NY-ESO-1). EC50 = half maximal effective concentration (linear curve fitting). Data shown are from one experiment with one (out of two) T cell donors with individual data points representing technical replicates (n = 3). Source data
Extended Data Fig. 4
Extended Data Fig. 4. Mapping of peptide specificity does not reveal unintended targets to which the TCRFLT3D/Y cells cross-react.
(a) Graphs depicting IFN-γ response of TCRFLT3D/Y cells to K562 cells loaded with individual peptides from mimotope library containing a total of 161 nine-mers for the FLT3D/Y peptide, at a concentration of 10−8 M. Purple dots in each graph represent response to the FLT3D/Y peptide. Substituted amino acid in the original peptide is highlighted. IFN-γ concentration range for positive reactions was 5000–35000 pg/mL (cut-off indicated by horizontal lines). Graphs show results from two independent experiments that were performed, one technical replicate (dot) per peptide and experiment. (b) Peptide reactivity motifs for FLT3D/Y that were queried in the ScanProsite search tool against human proteome databases. Amino acids in square brackets [] indicate alternatives that are allowed for the given position in the peptide motifs. (c) mRNA-encoded amino acid sequences(30-32mers) derived from the sequence of the human proteins LZTR1, MED1 and PRADC1, with the candidate cross-reactive peptide identified in the ScanProsite database underlined. (d) Expression of mRNA encoding LZTR1, MED1 and PRADC1 sequences following electroporation of HLA-A2pos K562 cells as measured by GFP-reporter fluorescence using flow cytometry. Source data
Extended Data Fig. 5
Extended Data Fig. 5. Re-analysis of published mutation data for 58 FLT3 D835Y positive AML patient samples shows high VAF for FLT3 D835Y in a large fraction of patients.
(a) Mutation data (SNVs and indels) from AML patients reported in Papaemmanuil et al, 2016 NEJM were downloaded from https://www.cbioportal.org/. VAF was estimated from reported alternative allele reads divided by sequencing depth for the position. Patients harboring a FLT3 D835Y mutation were selected for in-depth analysis and displayed here. Patients are sorted from right to left within each subsection in descending order of FLT3 D835Y VAF. The following genes were considered as initiating events in clonal hematopoiesis (CH): DNMT3A, TET2, ASXL1, PPM1D, JAK2, SF3B1, SRSF2, TP53, GNAS and GNB1. (b) Mutation data from FLT3 D835Y positive AML patients (n = 9) reported in Morita et al, 2020 Nat Com were downloaded. The fraction of cells with mutations (mutant cell fraction) in each AML patient with mutations are plotted in indicated colors. Patients were categorized into 3 groups; FLT3 D835Y largest, only preceded by mutations in DNMT3A, TET2, and/or ASXL1 (DTA) and/or splicing factor mutations (SF3B1, SRAF2, and U2AF1) which are closely related with clonal hematopoiesis ‘CH’, and the rest of cases with FLT3 D835Y mutation according to the cell fraction of mutations. Interquartile range (IQR) and median values are shown. The dashed lines indicate 1.5xIQR and the dots indicate outliers.
Extended Data Fig. 6
Extended Data Fig. 6. TCRFLT3D/Y cells are activated by, and efficiently kill, primary AML cells expressing FLT3D/Y.
(a) Flow cytometry plots showing gating strategy to identify cell subsets in AML patient samples from PB (patient 2-6) or BM (patient 1). Cells are gated on FSC/SSChi, single, Live/Dead Fixable Near-IR events (top row), showing the fractions of CD3+ T cells, CD19+CD20+ B cells and myeloid cells, defined as CD3CD19CD20 events in the bottom row. (b) Populations were overlaid on a t- SNE plot (patient 1) with designated colors as indicated. Inset numbers show event counts for myeloid cells after co-culture with TCR1G4 or TCRFLT3D/Y cells, quantified as shown in e. (c) Quantification of normal CD19+ B cells isolated from n = 3 healthy blood donors (Buffy coat (BC) 1 - BC 3) and tumor cells from patient 1 (positive control) after performing the flow cytometry-based cytotoxicity assay for 72 h. Data points represent n = 3 technical replicates from one experiment and horizontal lines show mean. (d) Bar graph showing IFN-γ response of Mock (gray) and TCRFLT3D/Y cells (purple) after 24 h co-culture with HLA-A2pos patient cells expressing the FLT3 D835Y (Pt.1-6), FLT3 D835E (Pt.9) or FLT3 D835H (Pt. 10), or Pt.8 cells expressing FLT3 D835Y but being HLA-A2neg. Data points represent n = 3 technical replicates and bars show mean. Data shown are from one experiment representative of at least two performed for each patient sample. (e) Gating strategy for flow cytometry cytotoxicity assay to quantify viable cells in subpopulations from AML patients 1-3 after 72 h of co-culture with autologous T cells either expressing TCRFLT3D/Y (bottom row) or mock-transduced. Transduced T cells were labeled with cell-trace violet (shown in upper right plot) prior to co-culture with AML cells to distinguish them from T cells in the AML samples. Patient cell subsets are gated on FSC/SSC, singlets, Live/Dead Fixable Near-IRneg, CTVneg events. Numbers indicate absolute counts for CD3+, CD19+/CD20+ and myeloid cells after co-culture, as determined by addition of fluorescent beads (10,000) into each well and where 3,500 beads were acquired for flow cytometry analysis (shown in upper left plot). Source data
Extended Data Fig. 7
Extended Data Fig. 7. TCRFLT3D/Y cells efficiently target leukemia in a xenograft mouse model.
(a) Flow cytometry histograms showing expression of FLT3D/Y as measured by GFP- reporter fluorescence in transduced AML and B-ALL cell lines. Negative control (non-transduced BV173 cells) in top histogram. (b) Remaining viable FLT3D/Y-transduced, HLA-A2+ cells (purple dots) after 24 h co-culture with TCRFLT3D/Y cells (E:T ratio of 1:2), in percent of corresponding numbers following treatment with mock-transduced T cells (grey dots), quantified by flow cytometry. +A2 denotes that HLA-A2 was introduced by transduction. Data points are from n = 3 independent experiments with each dot representing the mean of n = 3 technical replicates in each experiment and are shown as mean ± s.e.m. Gating strategy and quantification as shown in Extended Data Fig. 6e. (c) Schematic overview of the BV173D835Y in vivo model. (d) Bioluminescence imaging (BLI) analysis of NSG mice day 13 after BV173D835Y cell injection, one day prior to T-cell therapy. Data shown are from one experiment, with mice grouped into untreated (n = 3 mice), TCR1G4 (n = 3 mice) and TCRFLT3D/Y (n = 4 mice) cell treated. (e) BLI of BV173D835Y engrafted leukemic cells in mice on indicated days relative to treatment with TCR1G4 or TCRFLT3D/Y cells, or no treatment. (f) Quantification of BV173D835Y engrafted leukemic cells in mice, 21 days after treatment with TCR1G4 or TCRFLT3D/Y cells or left untreated. (g) Flow cytometry plots showing BM tumor burden in two untreated and two TCR1G4 cell-treated mice at time of sacrifice (d 21), as well as two TCRFLT3D/Y cell treated mice sacrificed at end of experiment (d 53). (h) Percentage of bone marrow BV173D835Y leukemic cells in mice treated with TCR1G4 or TCRFLT3D/Y cells, or left untreated, out of total mouse and human CD45+ cells (21-53 days after treatment start). (i) Percentage of TCR-β+ cells out of human CD8+ cells in the BM of mice analyzed at point of sacrifice. Data in d, f, h, i are presented as mean ± s.e.m, are from one experiment with each dot representing an individual mouse, and are analyzed by unpaired, two-tailed Student’s t-test. P values are shown and p < 0.05 was considered statistically significant. Source data
Extended Data Fig. 8
Extended Data Fig. 8. TCRFLT3D/Y cells persist in vivo and mediate recovery of mouse hematopoiesis in patient 7 PDX model.
(a) Representative FACS plots of viable single PB MNCs from TCR1G4 (top) and TCRFLT3D/Y (bottom) T cell-treated NSG-SGM3 mice stably engrafted with primary AML FLT3 D835Y cells from patient 7 at 14 days post T cell infusion. Equivalent gating as shown was also used for spleen. (b) Number of total MNCs in BM and spleen of TCR T cell treated mice. (c) Number of mouse MNCs (mCD45+ cells) in spleen. (d) Number of total hCD3+ cells in BM and spleen. (e-f) Percentage of mTCR-β+CD8+ cells of hCD3+ cells (e) and percentage of mTCR-β+ cells of hCD8+ cells (f) in T cell samples used for injection and at indicated days after T cell injection, in PB. (g) Distribution (%) of CD4 and CD8 cells within the human CD3+ T cell samples used for injection, and in PB, BM and spleen 14-15 days after injection into mice. All data are from terminal analysis 15 days post T-cell infusion if not otherwise stated. The data are presented as mean ± s.e.m. of n = 6 individual mice treated with TCR1G4 cells and of n = 7 individual mice treated with TCRFLT3D/Y cells, measured in one experiment. Each dot represents one mouse and statistical analysis was performed with two-tailed Mann-Whitney test. P values are shown and p < 0.05 was considered statistically significant. Source data
Extended Data Fig. 9
Extended Data Fig. 9. TCRFLT3D/Y cells eliminate FLT3D835Y leukemia cells and persist in vivo in patient 1 PDX model.
(a) Percentage of CD33+ cells in BM and PB at endpoint (day 34 post T cell infusion) of TCR1G4 cell (n = 4) or TCRFLT3D/Y cell (n = 4) treated mice. Numbers adjusted for hCD3+ T cells. (b) Number of total MNCs in BM and spleen of TCR T cell treated mice. (c) Representative ddPCR plots of BM from TCR cell-treated mice. Numbers in quadrants represent %VAF (mean ± s.e.m.) of the FLT3D/Y in BM among hCD45+CD33+CD34+, hCD45+CD33+CD34 and hCD45+CD19+ cells from TCRFLT3D/Y cell-treated (left) and TCR1G4 cell-treated (right) mice. ‘No remaining cells’ due to elimination of hCD45+CD33+CD34+ cells in TCRFLT3D/Y cell-treated mice. (d) Number of total hCD3+ cells in BM and spleen. (e-g) Percentage of mTCR-β+CD8+ cells of hCD3+ cells (e) and percentage of mTCR-β+ cells of hCD8+ cells (f) in sample used for injection and at indicated days after T cell infusion in PB. (g) Distribution (%) of CD4 and CD8 cells within the human CD3+ T cell samples analyzed prior to injection, and in PB, BM and spleen of individual mice at endpoint. All data are from terminal analysis 34 days post T-cell infusion unless otherwise stated. The data are presented as mean ± s.e.m. of n = 4 individual mice treated with TCR1G4 cells and of n = 4 mice treated with TCRFLT3D/Y cells, measured in one experiment. Each dot represents one mouse and statistical analysis was performed with two-tailed Mann-Whitney test. P values are shown and p < 0.05 was considered statistically significant. Source data
Extended Data Fig. 10
Extended Data Fig. 10. Lack of in vivo T-cell expansion upon transplantation of primary AML cells co-cultured with TCR1G4 or TCRFLT3D/Y T cells.
Representative FACS profiles of engrafted human CD45+ cells in the PB of mice analyzed at indicated weeks after transplantation of all cells remaining after 48 hours in vitro culture of AML cells without T cells (left), AML cells co-cultured with TCR1G4 cells (middle) or AML cells co-cultured with TCRFLT3D/Y cells (right). Profiles are from one mouse per treatment group from one experiment out of two performed.

References

    1. Coulie PG, et al. A mutated intron sequence codes for an antigenic peptide recognized by cytolytic T lymphocytes on a human melanoma. Proc. Natl Acad. Sci. USA. 1995;92:7976–7980. doi: 10.1073/pnas.92.17.7976. - DOI - PMC - PubMed
    1. Wolfel T, et al. A p16INK4a-insensitive CDK4 mutant targeted by cytolytic T lymphocytes in a human melanoma. Science. 1995;269:1281–1284. doi: 10.1126/science.7652577. - DOI - PubMed
    1. Matsushita H, et al. Cancer exome analysis reveals a T-cell-dependent mechanism of cancer immunoediting. Nature. 2012;482:400–404. doi: 10.1038/nature10755. - DOI - PMC - PubMed
    1. Castle JC, et al. Exploiting the mutanome for tumor vaccination. Cancer Res. 2012;72:1081–1091. doi: 10.1158/0008-5472.CAN-11-3722. - DOI - PubMed
    1. van Rooij N, et al. Tumor exome analysis reveals neoantigen-specific T-cell reactivity in an ipilimumab-responsive melanoma. J. Clin. Oncol. 2013;31:e439–e442. doi: 10.1200/JCO.2012.47.7521. - DOI - PMC - PubMed

Publication types

Substances