. 2023 Nov;20(11):1704-1715.
doi: 10.1038/s41592-023-02028-1. Epub 2023 Oct 2.

Streamlined and sensitive mono- and di-ribosome profiling in yeast and human cells

Affiliations

Streamlined and sensitive mono- and di-ribosome profiling in yeast and human cells

Lucas Ferguson et al. Nat Methods. 2023 Nov.

Abstract

Ribosome profiling has unveiled diverse regulation and perturbations of translation through a transcriptome-wide survey of ribosome occupancy, read out by sequencing of ribosome-protected messenger RNA fragments. Generation of ribosome footprints and their conversion into sequencing libraries is technically demanding and sensitive to biases that distort the representation of physiological ribosome occupancy. We address these challenges by producing ribosome footprints with P1 nuclease rather than RNase I and replacing RNA ligation with ordered two-template relay, a single-tube protocol for sequencing library preparation that incorporates adaptors by reverse transcription. Our streamlined approach reduced sequence bias and enhanced enrichment of ribosome footprints relative to ribosomal RNA. Furthermore, P1 nuclease preserved distinct juxtaposed ribosome complexes informative about yeast and human ribosome fates during translation initiation, stalling and termination. Our optimized methods for mRNA footprint generation and capture provide a richer translatome profile with low input and fewer technical challenges.


Conflict of interest statement

Competing Interests

L.F, H.E.U., S.C.P, and K.C. are named inventors on patent applications filed by the University of California describing biochemical activities of RTs used for OTTR. H.E.U. and K.C. have equity in Karnateq, Inc., which licensed the technology and is producing kits for OTTR cDNA library preparation. N.T.I. declares equity in Tevard Biosciences and Velia Therapeutics.

Figures
Extended Data Figure 1:
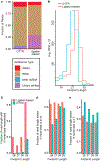
Extended Data Figure 1:. Additional comparison of RNase I RPF libraries by ligation-based or OTTR protocol.
a, Fraction of RNase I RPF cDNA library sequencing reads mapped to each transcript class. Library generation artifacts included sequences that were adapter-only, shorter than 15 bases, or unmapped. b, Read length distribution of OTTR (blue) and ligation-based (red) RNase I RPFs from the CDS, excluding those RPFs that are aligned to the first 15 and last 10 codons. Counts were represented in RPM and averaged across replicates c, For each read length from 26 to 29 nt, the fraction of RPF alignments with mismatches at the 5′-most base of the alignment. For this analysis, alignments were permitted to only have a single mismatch to the reference. d, For each read length from 26 to 29 nt, the fraction of RPF alignments with an adenosine (A) at the 3′-most base of the alignment. For this analysis, alignments were permitted to only have a single mismatch to the reference. e, For each read length from 26 to 29 nt, the fraction of RPF alignments with a thymine (T) at the 3′-most base of the alignment. For this analysis, alignments were permitted to only have a single mismatch to the reference.
Extended Data Figure 2:
Extended Data Figure 2:. Optimization of P1 nuclease digestion and cell lysis conditions.
a, Polysome collapse efficiency analysis comparing lysis with either pH 6.5 or pH 7.5 polysome lysis buffer and addition of a range of P1 nuclease U/μg. All assays were carried out with lysate measuring 30 μg of total RNA quantum satis to 200 μL with either pH 6.5 or pH 7.5 polysome buffer. At the point of nuclease digestion, pH 7.5 lysate was adjusted to ~pH 6.5 with 14 μL of 300 mM Bis-Tris (pH 6.0), and pH 6.5 lysate was supplemented with an additional 14 μL of pH 6.5 polysome buffer. Collapse efficiency was calculated as the ratio of the integrated monosome peak absorbance relative to the integrated polysome region absorbance, normalized by the undigested control (n=1 for each condition, except n=2 for pH 6.5 with 3.33 U/μg or 20 U/μg and pH 7.5 with 0 U/μg or 10 U/μg). b, Comparison of polysome collapse efficiency by P1 nuclease digestion at either 30 °C or 37 °C using Calu-3 human cell lysate. Briefly, lysate measuring 15 μg of total RNA was quantum satis to 200 μL in pH 7.5 polysome buffer and pH adjusted with 14 μL of 300 mM Bis-Tris (pH 6.0) before supplemented with P1 nuclease and digestion at 30 °C or 37 °C. Undigested control incubated at 4 °C for an hour without nuclease (n=2 for 4 °C no-nuclease controls, n=2 or 3 for 15 U/μg as shown, and n=1 for 20 U/μg). c, Representative polysome profile from P1 nuclease digestion of Calu-3 human cell lysate at 30 °C or 37 °C with nuclease at 15 U/μg total RNA. Undigested control incubated at 4 °C for an hour without nuclease.
Extended Data Figure 3:
Extended Data Figure 3:. OTTR library production and ribosome profiles
a, Size-selection of P1 nuclease RPF cDNA from OTTR by direct imaging of Cy5, the dye covalently linked to the 5′ end of the +1dY DNA/RNA adapter duplex primer (see Fig. 1a). The 30 nt and 40 nt RNA oligonucleotides used for RPF size selection (not shown) were also used in OTTR reactions parallel to those using input RPFs, to generate cDNA size-selection markers. Bromophenol blue formamide loading dye was used to resuspend OTTR cDNA for size selection to avoid xylene cyanol interference during Cy5 imagining. A 0.6X TBE 8% urea-PAGE was chosen for cDNA size selection since xylene cyanol and the no-insert OTTR adapter-dimer cDNA (~75 nt) co-migrate. For these reasons, xylene cyanol was included only in the peripheral lanes. Horizontal black lines indicate the boundaries for cDNA gel slice excision to remove adapter-dimer from desired cDNA library. All lanes are from the same gel. P1 RPF were either from sucrose cushion purified human 293T or sucrose cushion purified S288C yeast material after nuclease digestion. A 30 nt and 40 nt template control OTTR reaction was used to synthesize OTTR cDNA to enable cDNA size selection equivalent to RNA size selection. b, Read length distribution of yeast RNase I (blue) and P1 nuclease (red) RPFs from the CDS, excluding those sucrose cushion purified RPFs that are aligned to the first 15 and last 10 codons, as in Extended Data Fig. 1b. Counts were represented in RPM and averaged across replicates. c, Read length distribution of human RNase I (blue) and P1 nuclease (red) RPFs from the CDS, excluding those sucrose cushion purified RPFs that are aligned to the first 15 and last 10 codons, as in Extended Data Fig. 1b. Counts were represented in RPM and averaged across replicates d, Fraction of sucrose cushion purified RNase I RPF cDNA library sequencing reads mapped to each transcript class for yeast libraries generated by P1 nuclease or RNase I digestion. e, Fraction of sucrose cushion purified RNase I RPF cDNA library sequencing reads mapped to each transcript class for human libraries generated by P1 nuclease or RNase I digestion. f, Average per-base read coverage of cytosolic 18S and 25S or 28S rRNA from yeast (left) or human (right) ribosome profiles with P1 nuclease (red) or RNase I (blue). Coverage was represented in reads per million total reads, including reads mapping to rRNA, tRNA, ncRNA, mRNA, and other genomic loci) to emphasize relative proportion from the entire library. Material was purified from a sucrose cushion. g, As in (f) but for 5.8S and 5S rRNA coverage. h, As in (f) for mitochondrial rRNA coverage.
Extended Data Figure 4:
Extended Data Figure 4:. Abundance and properties of monosome, sub-disome, and true disome RPFs from yeast cells with or without histidine starvation.
a, Ratio of sucrose density gradient disome to monosome peak area from polysome profiles after P1 nuclease digestion of yeast lysates from cells with or without HTS1 knockdown. b, Fraction of sequencing reads mapped to each transcript class for sucrose density gradient light monosome, heavy monosome, and disome profiling from P1 nuclease digestion and OTTR library cDNA synthesis. c, Average profile of footprints around isolated histidine codons after HTS1 depletion, as in Fig. 4g but for sucrose density gradient light monosome RPFs. d, Average profile of footprints around isolated histidine codons after HTS1 depletion, as in Fig. 4g but for sucrose density gradient heavy monosome RPFs. e, Average profile of footprints for sucrose density gradient light monosome RPFs at start codons after HTS1 depletion f, Average profile of footprints for sucrose density gradient heavy monosome RPFs at start codons after HTS1 depletion
Extended Data Figure 5:
Extended Data Figure 5:. Complete GCN4 uORF1 and uORF2 profiles for monosome, sub-disome, and true disome footprints with and without HTS1 knock-down.
a, Extended representation from Figure 5c. Rescaled counts of 5′ and 3′ ends of aligned true disome (top), sub-disome (middle), and monosome (bottom) footprints for GCN4 uORF1 without HTS1 knock-down. Results from replicates were summed together from sucrose density gradient purified material. b, Footprint length 5′ and 3′ profile of (a). c, Rescaled counts of 5′ and 3′ ends of aligned true disome (top), sub-disome (middle), and monosome (bottom) footprints for GCN4 uORF1 after HTS1 knock-down. Results from replicates were summed together. d, Footprint length 5′ and 3′ profile of (c). e, Extended representation from Figure 5d. Rescaled counts of 5′ and 3′ ends of aligned true disome (top), sub-disome (middle), and monosome (bottom) footprints for GCN4 uORF2 without HTS1 knock-down. Results from replicates were summed together. f, Footprint length 5′ and 3′ profile of (e). g, Rescaled counts of 5′ and 3′ ends of aligned true disome (top), sub-disome (middle), and monosome (bottom) footprints for GCN4 uORF2 after HTS1 knock-down. Results from replicates were summed together. h, Footprint length 5′ and 3′ profile of (g).
Extended Data Figure 6:
Extended Data Figure 6:. Complete CPA1 uORF profiles for monosome, sub-disome, and true disome footprints with and without HTS1 knock-down.
a, Extended representation from Figure 6a. Rescaled counts of 5′ and 3′ ends of aligned sucrose density gradient purified true disome (top), sub-disome (middle), and monosome (bottom) footprints for CPA1 uORF without HTS1 knock-down. Results from replicates were summed together. b, Extended representation from Figure 6b. Rescaled counts of 5′ and 3′ ends of aligned sucrose density gradient purified true disome (top), sub-disome (middle), and monosome (bottom) footprints for CPA1 uORF after HTS1 knock-down. Results from replicates were summed together.
Extended Data Figure 7:
Extended Data Figure 7:. Additional comparisons of libraries made from mirRICH, total RNA, or gel-base size-selected RPFs.
a, Denaturing urea-PAGE analysis of yeast RNA fragments purified from either Direct-Zol Total RNA extraction or mirRICH small RNA enrichment following purification by sucrose cushion. Roughly 5% of the Direct-Zol extract and 25% of the mirRICH extract was analyzed in this gel. The migration of the 30 nt (light blue) and 40 nt (dark blue) size-selection RNA oligos are demarcated (left). The gel was a 12% urea-PAGE with 0.6X TBE, and SYBR gold was used for staining. Both lanes are from the same gel. b, Denaturing urea-PAGE analysis of cDNA produced from OTTR using 40 ng of mirRICH small RNA from (a). Parallel positive control OTTR libraries were synthesized from either the 30 nt or 40 nt RNA size-selection RNA oligos to aid in cDNA size-selection. The single light-blue and dark-blue dots (left) demarcate the cDNA with inserts derived from the 30 nt and 40 nt RNA oligos, respectively. cDNA concatemers in OTTR can form if excess template is included in the reaction, such as the 60 nt and 80 nt sized-inserts demarcated by two light blue and two dark blue dots, respectively. The approximate area for monsome cDNA size selection was demarcated by the bottom two black lines (right), and the disome cDNA was size selected from the top two black lines. The gel was an 8% urea-PAGE with 0.6X TBE, and cDNA was directly imaged by Cy5. Both lanes are from the same gel. c, Gene-level estimates for CDS occupancy, but here for mirRICH or Direct-Zol P1 RPF from the yeast lysate without HTS1 knock-down, purified by sucrose cushion. Both libraries relied on cDNA size-selection rather than RNA size-selection. The counts were deduplicated before analysis, and a gene’s CDS needed at least one alignment from one replicate in order to be retained for analysis. Read counts for each gene were normalized by DESeq2. d, Distribution of the log2 ratio of PCR deduplicated counts (corrected) versus uncorrected counts for each CDS from the libraries generated from the no HTS1 knockdown lysate, purified by sucrose cushion. The number of necessary PCR cycles used for library multiplexing is defined above. Two technical replicates per library condition were analyzed. e, Read length distribution represented as a fraction of mRNA mapping reads for the sucrose cushion purified mirRICH monosome and disome reads bifurcated by cDNA size-selected libraries from the HTS1 knock-down lysate. Two technical replicates per library condition were analyzed. Monosome replicates are in light blue and purple; disome replicates are in red and green. f, Read length distribution represented as a fraction of mRNA mapping reads for the sucrose cushion purified mirRICH monosome and disome reads bifurcated by cDNA size-selected libraries from the 293T lysate. Two technical replicates per library condition were analyzed. Monosome replicates are in light blue and purple; disome replicates are in red and green. g, 5′ aligned ends and footprint length profile at initiating codons for P1 sub-disome (red line) and true disome (blue line) RPFs captured by mirRICH from human 293T cell lysates. Material was purified by a sucrose cushion. The summed 5′ end profile is depicted at top and the contributions from each footprint length at each 5′ end are shown at bottom. Sub-disome and true disome sized reads were analyzed separately.
Figure 1:
Figure 1:. Highly correlated ribosome profiles derived from ligation-based or OTTR library generation.
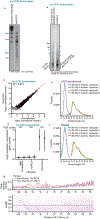
a, Schematic of library generation by OTTR or ligation-based protocols from a single pool of RNase I derived RPFs (green) from a sucrose cushion. The pool of RPFs were split unevenly after T4 PNK treatment with only 1:10th of the RPFs used in OTTR. In OTTR, each step before cDNA size selection occurs in 4 hours in a single tube. First, input RPF RNA was labeled by either ddA or ddG on the 3′ end before unincorporated ddRTPs were inactivated by rSAP. Lastly, two ordered jumps, the first initiated from the +1Y DNA/RNA primer duplex and the second initiated from a non-templated dG addition to the RPF cDNA to jump to the 3’C adapter template, yields a cDNA molecule with a 5’ and 3’ adapter flanking the complement of the RPF input. In ligation-based, the 3’ adapter is first adenylated on its 5’ end. THen, 3’ adapter ligation is carried out, followed by gel-based size selection and overnight elution. THe next day, material is precipitated and primer hybridization for reverse transcription occurs. Following reverse transcription, cDNA is purified by gel-base size-selection. After elution, cDNA is circularized. In these illustrations green/light green denoted the RPF sequence, orange/light orange denoted the R1 adapter sequence, blue/light blue denoted the R2 adapter sequence, gray/dark gray denoted the unique molecular identifier sequence, brown/light brown denoted the barcode sequence, red octagon denoted polymerase blocking groups, magenta triangle denoted a 3’ddR, and a magenta square denoted the dG non-templated addition. b, Comparison of gene-level ribosome occupancy estimates from libraries generated in (a). Read counts are for RPFs aligned to verified CDSs excluding those RPFs that are aligned to the first 15 and last 10 codons. Read counts for each gene were normalized by DESeq2. c, Comparison of mean codon-level occupancy estimates from libraries generated in (a). Aligned RPFs were assigned to an A-site codon and counted. These counts were then rescaled by the mean codon count for the gene, excluding those RPFs that are aligned to the first 15 and last 10 codons, and averaged across the translatome. d-e, Metagene averages around the start (left) and stop (right) codons for either (d) OTTR or (e) ligation-based libraries. Aligned RPFs for each CDS were first rescaled by the mean codon count for the gene, excluding those RPFs that are aligned to the first 15 and last 10 codons, and then averaged across the translatome. Footprints were tabulated according to either the 5′ aligned position alone (shown at top as a black line), or both 5′ aligned position and read length (shown at bottom as a matrix of distinct RPF lengths and positions). f, Per-codon contributions to iχnos machine learning models of RPF occupancy profiles. A model based on a widow of 13 codons (−7 to +5) around the A-site was compared with thirteen additional models, each omitting one codon from the model. The contribution of a codon position to RPF occupancy profile was inferred from the change in Pearson’s correlation coefficient between the predicted ribosome occupancy versus actual ribosome occupancy changed when the codon was omitted (Y-axis).
Figure 2:
Figure 2:. P1 nuclease collapse of polysomes into monosomes while limiting rRNA degradation.
a, Sucrose density gradient polysome profiles of nuclease-treated yeast lysate, along with an undigested control. Each sample contained 30 μg of total RNA in 200 μL prior to nuclease digestion with the units (U) of enzyme indicated. P1 nuclease samples were adjusted to pH 6.5 prior to digestion and digested at 30°C for 1 hour. RNase I digestion was at room temperature for 45 min. b, As in (a), for human-derived Calu-3 cell lysate containing 15 μg of total RNA. c, Integrated monosome peak area from yeast lysate digested with various concentrations of P1 nuclease at 30 °C or RNase I at room temperature for an hour. Dark fill indicates undigested control, which was incubated without nuclease at 4 °C for an hour (n=1 for each condition, except n=2 for 10 U/μg). d, As in (c) for human Calu-3 cell lysate, but with P1 nuclease digestion at 37 °C. Dark fill indicates undigested control, which was incubated without nuclease at 4 °C for an hour (n=1 for each condition). e, Denaturing PAGE analysis of RNA extracted from sucrose cushioned pellets after digestion with P1 nuclease or RNase I, as in (a), and stained with SYBR Gold.
Figure 3:
Figure 3:. Highly similar ribosome profiling data from P1 nuclease or RNase I digestion.
a, Metagene average profiles around the start (left) and stop (right) codons from sucrose cushion purified yeast RPFs generated by P1 nuclease (top, red) or RNase I (bottom, blue) digestion. The 5′ ends of aligned reads were counted, and counts for each gene were rescaled by the mean codon count for the gene, excluding those RPFs that are aligned to the first 15 and last 10 codons, prior to averaging. b, As in (a), for sucrose cushion purified human 293T cell RPFs generated by P1 nuclease (top, red) or RNase I (bottom, blue) digestion. c, Gene-level ribosome occupancy estimates from sucrose cushion purified yeast RPFs generated by P1 nuclease and RNase I digestion. Read counts for each gene were normalized by DESeq2. d, Gene-level estimates from sucrose cushion purified human 293T cell RPFs generated by P1 nuclease and RNase I digestion. Read counts for each gene were normalized by DESeq2. e, Average profile of yeast footprints at start codons for P1 nuclease (red, 30 – 40 nt) and RNase I (blue, 25 – 29 nt) libraries. Footprint alignments were counted separately for each gene monitoring read length as well as 5′ end position (left) and 3′ end position (right), then averaged as in (a). A heatmap shows footprint abundance according to length and end position (below), and the end position average summed across all lengths is shown (above each heatmap matrix. The 5′ and 3′ end averages are shown to the left and to the right, respectively, of a black vertical bar. A diagram of a translating ribosome footprint (top) indicates mRNA cleavage positions of P1 nuclease (red triangle) and RNase I (blue triangle). f, Average profile of human cell footprints at start codons for P1 nuclease (red, 33 – 40 nt) and RNase I (blue, 27 – 32 nt) libraries, as in (e). g-h, Comparison codon-level ribosome occupancy estimates from (g) yeast or (h) human cell RPFs generated by P1 nuclease and RNase I digestion, as in Fig. 1c. In (h), arginine codons are shown in red. i, Schematic of proposed P1 nuclease and RNase I cleavage sites around an mRNA-engaged ribosome. Increased frequency of an RPF terminal position is indicated by increasing color saturation.
Figure 4:
Figure 4:. P1 nuclease disome and sub-disome footprints.
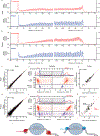
a, Schematic of inducible, translatome-wide histidine codon stalling in yeast by depletion of histidyl-tRNA synthetase Hts1. b, Sucrose density gradient polysome profile of P1 nuclease digested yeast lysates with (purple) or without (teal) HTS1 depletion. The yellow shaded box indicates the disome velocity sedimentation fraction collected. c, Read length distribution of RPF libraries from the monosome and disome sucrose density gradient peaks. The light monosome library (left) was generated from 30 – 40 nt RNA from the sucrose density gradient monosome fraction and the heavy monosome library was generated from 30 – 40 nt RNA in the sucrose density gradient disome fraction. The overall sucrose density gradient disome library was generated from 45 – 80 nt RNA in the disome fraction and computationally separated into sub-disome and true disome samples at the RPF length indicated by dashed line. The y-axis was represented in reads per million and averaged across the two replicates. d, Negative stain electron microscopy from a representative sucrose density gradient disome fraction from yeast lysate digested with P1 nuclease. Scale bar: 100 nm. e, Relative ribosome occupancy of genes comparing sucrose density gradient derived light and heavy monosome pools. Genes were stratified by the number of transmembrane domains (TMD) they encode and cumulative distributions of occupancy between the heavy- and light-monosome libraries are plotted for each stratum. f, Comparison of codon-level ribosome occupancies between sucrose density gradient monosome samples with or without HTS1 depletion. Histidine codons are shown in red, and Pearson’s R2 is reported for all codons including histidine. g, Average profile of yeast footprints in the sucrose density gradient true disome (top, 60 – 75 nt, purple line) and sub-disome (bottom, 40 – 59 nt, pink line) libraries around isolated histidine codons after HTS1 depletion. The top schematic represents a ribosome-ribosome collision with the leading ribosome stalled at a histidine codon. The bottom schematic represents a similar ribosome collision, with the trailing ribosome undergoing RQC. The schematic 60S (top) and 40S (bottom) subunits with P- and A-site tRNAs are shown enclosing an mRNA (circles are nucleotides), with the E-, P-, and A-site nucleotides darkened. The A-site of the stalled ribosome was denoted with an exclamation point to symbolize the depletion of charged histidyl tRNA. Positions of P1 cleavage are denoted by red triangles. h, Average profile of yeast sucrose density gradient sub-disome footprints around start codons, as in (g). The overall occupancy of true disome footprints is also shown (dark purple histogram line). The schematic shows an 80S ribosome at initiation and an adjacent, upstream scanning pre-initiation complex (top) and an 80S ribosome at initiation and a downstream 40S subunit (bottom). i, Average profile of yeast sucrose density gradient true disome footprints around stop codons, for yeast without Hts1 knock-down. The schematic shows a trailing ribosome decoding the 11 codons upstream of the terminating (leading) ribosome, with a single-codon gap in between.
Figure 5:
Figure 5:. Monosome, sub-disome, and true disome occupancy profiles for GCN4 uORF1 and uORF2
a, Differential expression analysis of sucrose density gradient monosome footprint occupancy across yeast genes, with versus without HTS1 knock-down. HTS1 and GCN4 are shown in red. b, Average fraction of aligned footprints to uORF1 and uORF2 of GCN4 from sucrose density gradient purified light monosomes, sub-disome, and true disomes. Counted alignments represented as fractions for each library before replicate libraries were averaged. Alignments were assigned to their respective ORF if both the 5′ and 3′ ends flanked the start and stop codons of the uORF but did not overlap another uORF. c, Sucrose density gradient monosome 5′ and 3′ profile of ribosomes at GCN4 uORF1. Alignments were rescaled by the mean CDS codon occupancy of GCN4 before replicates were summed together. d, Sucrose density gradient disome 5′ and 3′ profile of ribosomes at GCN4 uORF2. Disome and sub-disome rescaled counts were normalized separately. Alignments for disome and sub-disome RPFs were rescaled by the respective mean codon count of GCN4’s CDS, excluding those RPFs that are aligned to the first 15 and last 10 codons, before replicates were combined by summing together.
Figure 6:
Figure 6:. P1 nuclease captures nearly-collided pairs of ribosomes in both normal and Hts1-depleted conditions.
a, Rescaled counts of sucrose density gradient purified disome (top) and light-monosome (bottom) 5′ and 3′ footprint ends with respect to the stop codon of the CPA1 uORF in yeast without HTS1 knock-down. Both a terminating ribosome (leading) and elongating ribosome (trailing) at various codon positions are schematized. b, As in (a) in yeast with HTS1 knock-down. Both an elongating ribosome stalled at the penultimate histidine codon (leading) and an elongating ribosome (trailing) are schematized. c, Average rescaled counts of sucrose density gradient purified true disome footprints from HTS1 knock-down yeast at CDS positions where pairs of histidine codons occur with 10 – 13 intervening non-histidine codons. The trailing ribosome A-site position is represented with respect to the leading ribosome stall at a histidine codon.
Figure 7:
Figure 7:. mirRICH and cDNA size-selection as alternatives to gel-based size selection of P1 nuclease RPFs.
a, Gene-level estimates for CDS occupancy comparing sucrose cushioned and mirRICH purified RPFs to sucrose density gradient and gel-based size selected light-monosome RPF from yeast lysate without HTS1 knock-down. mirRICH relied on cDNA size-selection whereas light-monosome relied on polysome fractionation followed by both RNA size-selection and cDNA size-selection. Read counts for each gene were normalized by DESeq2. b, c, Footprint 5′ ends and length profile at initiation codons for (b) P1 sub-disome RPFs and (c) P1 true disome RPFs, captured by sucrose cushioned and mirRICH from HTS1 knock-down yeast lysate. The summed 5′ end profile is depicted at top and the contributions from each footprint length at each 5′ end are shown in the matrix at bottom. d, Gene-level estimates for CDS occupancy comparing mirRICH purified RPFs to gel-based size selection for human 293T P1 RPFs. Material was purified by a sucrose cushion. Read counts for each gene were normalized by DESeq2. e, Footprint 5′ ends and length profile at termination codons for P1 true disome RPFs captured by mirRICH from human 293T cell sucrose cushion purified material. The summed 5′ end profile is depicted at top and the contributions from each footprint length at each 5′ end are shown in the matrix at bottom. f, Occupancy profile for sucrose cushion purified monosomes (red) and trailing ribosome of the disome (blue) across the human TUB1A1 ORF. The region in gray is expanded in g-h. g, h, Profile of A-site positions of sucrose cushion purified (g) trailing ribosomes from true disome footprints and (h) monosome footprints, with length and position grouped by codon, from the gray region in (f). Monosomes (h) and disomes (g) are schematized above to emphasize differences in leading and trailing ribosome dwell time.

References

    1. Ingolia NT, Ghaemmaghami S, Newman JR & Weissman JS Genome-wide analysis in vivo of translation with nucleotide resolution using ribosome profiling. Science 324, 218–223 (2009). - PMC - PubMed
    1. Gao X et al. Quantitative profiling of initiating ribosomes in vivo. Nat. Methods 12, 147–153 (2015). - PMC - PubMed
    1. Irigoyen N et al. High-Resolution Analysis of Coronavirus Gene Expression by RNA Sequencing and Ribosome Profiling. PLoS. Pathog 12, e1005473 (2016). - PMC - PubMed
    1. Napthine S et al. Protein-directed ribosomal frameshifting temporally regulates gene expression. Nat. Commun 8, 15582 (2017). - PMC - PubMed
    1. Irigoyen N, Dinan AM, Brierley I & Firth AE Ribosome profiling of the retrovirus murine leukemia virus. Retrovirology 15, 10 (2018). - PMC - PubMed