. 2023 Oct;20(10):1530-1536.
doi: 10.1038/s41592-023-02007-6. Epub 2023 Oct 2.

Spatial single-cell mass spectrometry defines zonation of the hepatocyte proteome

Affiliations

Spatial single-cell mass spectrometry defines zonation of the hepatocyte proteome

Florian A Rosenberger et al. Nat Methods. 2023 Oct.

Abstract

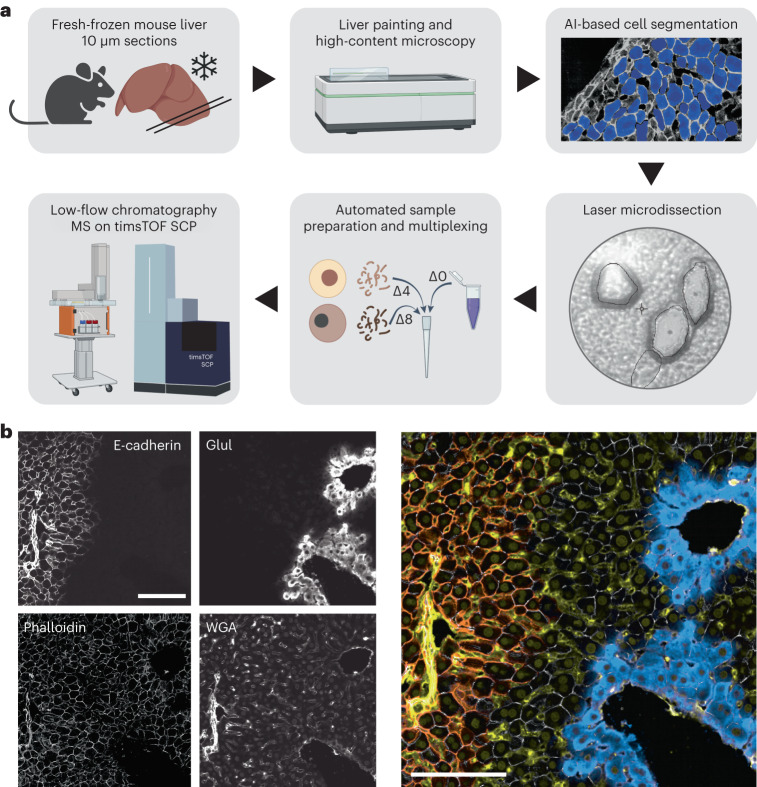
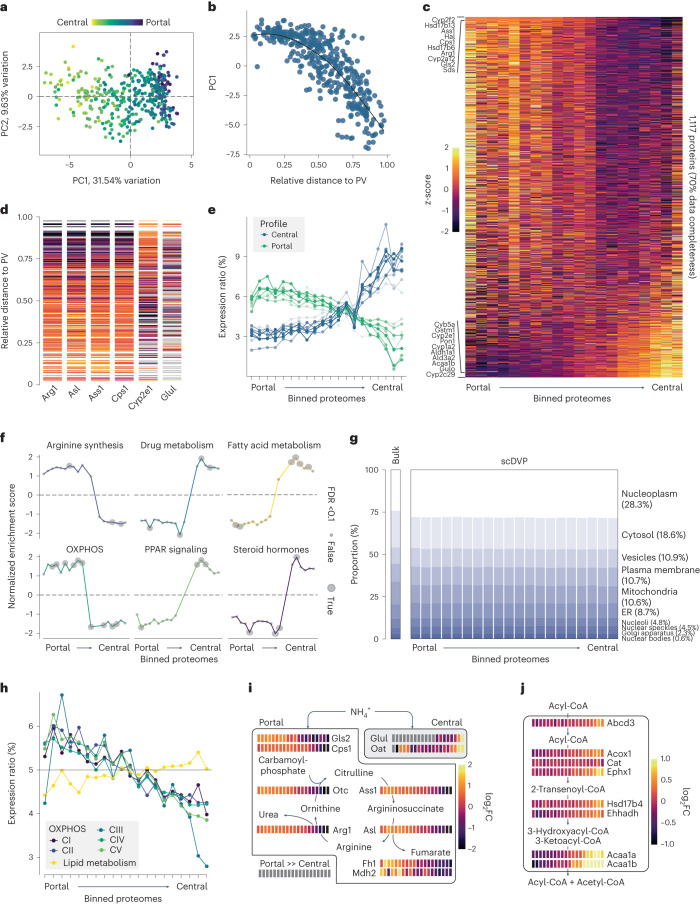
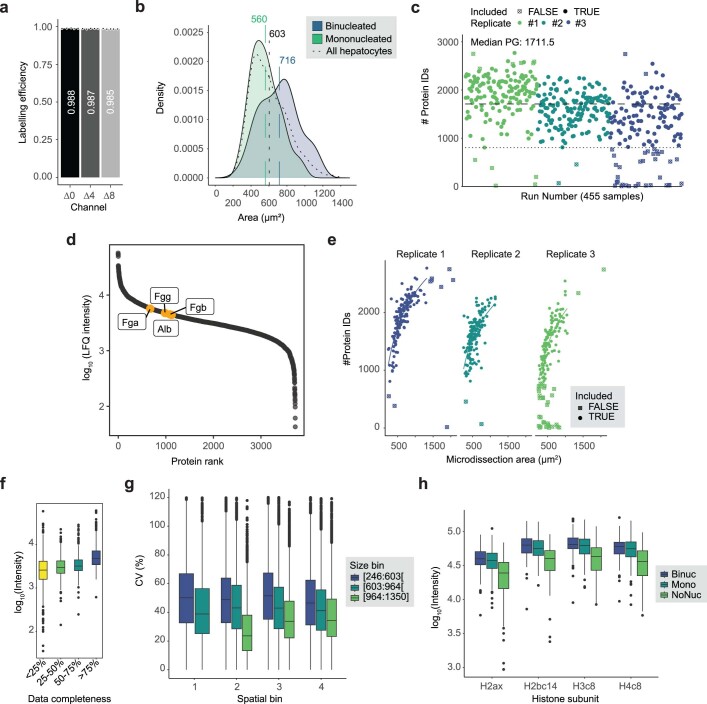
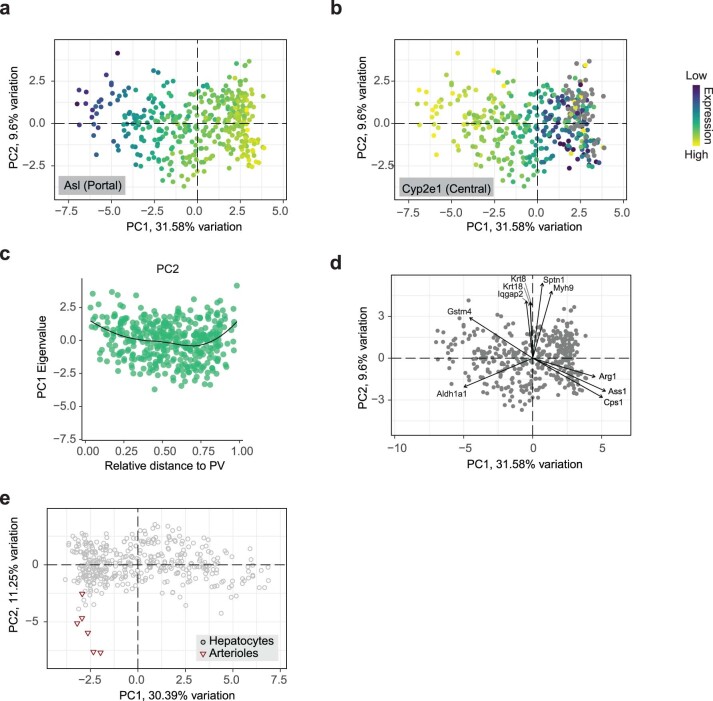
Single-cell proteomics by mass spectrometry is emerging as a powerful and unbiased method for the characterization of biological heterogeneity. So far, it has been limited to cultured cells, whereas an expansion of the method to complex tissues would greatly enhance biological insights. Here we describe single-cell Deep Visual Proteomics (scDVP), a technology that integrates high-content imaging, laser microdissection and multiplexed mass spectrometry. scDVP resolves the context-dependent, spatial proteome of murine hepatocytes at a current depth of 1,700 proteins from a cell slice. Half of the proteome was differentially regulated in a spatial manner, with protein levels changing dramatically in proximity to the central vein. We applied machine learning to proteome classes and images, which subsequently inferred the spatial proteome from imaging data alone. scDVP is applicable to healthy and diseased tissues and complements other spatial proteomics and spatial omics technologies.


Conflict of interest statement

M.M. is an indirect investor in Evosep. All other authors declare no competing interests.

Figures

Fig. 1
Fig. 1. Isolation and characterization of individual hepatocyte shapes in situ.
a, The scDVP workflow comprised embedding of fresh mouse liver tissue, staining and high-content microscopy, AI-guided hepatocyte segmentation, cutting and sorting of cells on a laser microdissection microscope, and peptide preparation with or without dimethyl labeling. The Δ0 channel contains the reference proteome and Δ4 and Δ8 contain two individual samples, which are all analyzed by ultra-high-sensitivity mass spectrometry. Created with BioRender.com. b, Liver painting with four stains. Left: E-cadherin marks PV regions, glutamate-ammonia ligase (Glul) surrounds the CV, the cell segmentation marker phalloidin, and the sinusoidal and nuclear counterstain WGA. Right: false color overlay of all channels: orange, E-cadherin; yellow, WGA, gray, phalloidin; turquoise, Glul. Scale bars, 100 μm.
Fig. 2
Fig. 2. Depth of single-shape proteomes and estimation of the nuclear compartment.
a, Unique proteins quantified in our scDVP workflow with mDIA ranked by signal intensity (two single-shape and a reference proteome channels, 31 min Evosep gradient, 15 cm column at 100 nl min−1, dia-PASEF with optimized window design, library-dependent search in DIA-NN). Names of highest- and lowest-ranking proteins, as well as transcription factors, are indicated. b, Left: intensity of the top four histone proteins across all samples, including hepatocytes and quality control arteriole structures. Colors are specific for the indicated histone subunit. Right: WGA stain of cells corresponding to marked data points in the scatter plot. The color scale is signal intensity. Scale bar, 10 μm. Data from three mice were pooled.
Fig. 3
Fig. 3. Single-shape proteomes are accurate descriptors of zonated hepatocytes.
a, PCA of all hepatocytes. The color overlay corresponds to the ratio of measured distance PV over CV in the microscopy image. b, Measured distance ratio versus PC1. Relative distance of 0 is at the PV and of 1 is at the CV. Black: smoothing curve. c, Heat map of protein expression as z-score per protein across all samples. Proteins are ordered according to ANOVA fold change (FC) across 20 spatial equidistant bins, summarizing samples with a similar distance ratio to PV and CV. The ten top and bottom proteins are given. Only proteins that were detected in 70% of all samples are included. d, Protein expression as z-score of selected marker proteins, ordered by relative distance to PV and CV. One line is one shape measurement. Gray: protein not detected. e, Expression of the top 20 significant proteins in 20 spatial bins, relative to total expression from portal to central. Zonation peak at PV: positive ANOVA fold change (n = 10), and vice versa (n = 10). f, Selected gene sets in individual spatial bins versus all others bins, depicting normalized enrichment score after gene set enrichment analysis. Dot size: significance after multiple testing adjustment. g, The proportion of protein signal stratified by subcellular compartment in a bulk mouse liver proteome and the scDVP dataset. Percentages refer to mean across spatial bins in the scDVP data. h, Relative expression in 20 bins from PV to CV of proteins constituting mitochondrial OXPHOS components (C) I–V, and mitochondrial lipid metabolism. i, Levels of urea cycle and connected enzymes from portal (left) to central (right) bins as log2FC relative to median expression in the two center bins. Portal box: active in portal regions. Central box: active in central region. j, Levels of peroxisomal enzymes related to very-long chain fatty acid degradation, spatially resolved as in g. Data from three mice were pooled.
Fig. 4
Fig. 4. Combining imaging and proteome data for a ML model.
a, Fluorescence intensities of Alexa568 (PV marker E-cadherin) and Alexa647 (CV marker Glul), with percentages in indicated bins. Each dot represents one shape. b, Intensities of the spatial markers as in a across eight spatial bins. The boxes are first and third quartiles, the thick line is the median, whiskers are ±1.5 interquartile range and outliers are indicated as individual points. c, Confusion matrix of a ML model with five classes, informed by microscopy and proteomics data. Colors scale with counts in each box. d, Predicted classes of segmented hepatocytes. The hue is the maximum class probability. e, Density plot of predicted versus measured intensities of a section excluded from machine learning (R = 0.78). f, Spatial depiction of one biological replicate with microscopy ground truth on top right, and three predictions. Orange, E-cadherin; red: Glul; green: WGA. *Sectioning artifact. Scale bar, 150 μm.
Extended Data Fig. 1
Extended Data Fig. 1. Five shape proteomes resolve liver zonation.
a, Titration of number of shapes (10 µm thick) versus proteome depth achieved (n = 3), and measured with the original protocol (single shape, 44 min Evosep gradient, 15 cm column at 500 nL/min, dia-PASEF 27 without optimized windows, library-dependent search in DIA-NN 30). Boxes are first and third quartile, the thick line is median, whiskers are ± 1.5 interquartile range, and outliers are indicated as individual points. b, Protein numbers per five shapes across 230 samples. Line is a smoothing curve. c, Principal component analyses with a color overlay of two indicated zonation markers; n.q. not quantified. d, Unbiased k means clustering of all samples into four bins. Labeled arrows are the top driver proteins of separation. e, Marker expression sorted by central (top) or portal (bottom) markers in the indicated k means clusters in d, expressed as z-score of log2 transformed protein abundances, and sorted according to summed zonal probability across all markers.
Extended Data Fig. 2
Extended Data Fig. 2. Statistical analysis of five-shape proteomes.
a, Volcano plot after an ANOVA over four sorted k means clusters (see Extended Date Fig. 1d). Statistically significant proteins (FDR < 0.05, n = 333 of 1652) with an absolute fold change of more than 0.5 are labeled. Colors indicate upregulation towards portal, or central zones. b, Heatmapping of statistically significant proteins in a. The blocks are separate by negative, or positive fold change. Protein expression as z-score of log2 transformed protein abundances. c,d, Five top significant terms (FDR < 0.05) after over-representation analysis enriched in peri-portal (c) or peri-central regions (d). See Supplementary table S2 for further reference.
Extended Data Fig. 3
Extended Data Fig. 3. Performance overview of single-shape proteomes.
a, Labeling efficiency of 10 ng mouse liver peptide samples. Mean efficiency by intensity is stated in the bar (n = 5, mean and individual measurements). b, Density distribution of shape areas across all measured and included hepatocytes, split by visually distinguished mono- (N = 191) and binucleated (N = 99) hepatocytes. Vertical lines and numbers above are mean sizes in the respective group. c, Number of proteins per sample (N = 455). The dotted line is the median, the fine pricked line is the sample exclusion cutoff of median minus 1.5 standard deviations. Samples were measured from left to right. Shape type indicates whether the samples was included for the final analysis. d, Levels of plasma proteins in the scDVP dataset. Hba, Hbb and Hbd were not detected. e, Association between the area of the cut shape, and number of proteins. Line is a log10 regression curve. Symbols indicate whether sample was included or discarded for analysis, for exclusion criteria see Methods section. f, Percentage of proteins quantified, binned into four groups, versus log10 transformed median intensities in the respective bin. Data completeness is defined as percentage of samples across all samples in which a particular protein was quantified in. g, Coefficient of variation (CV) in bins of similarly sized shapes (color coded), and spatial bins with similar distance ratio to portal and central vein, that is similar zonation profile. h, Levels of four histone proteins shown in Fig. 2b by number of nuclei in the isolated shapes. Binuc: binucleated (N = 99); Mono: mononucleated (N = 191); NoNuc: no nucleus (N = 101). Boxes are first and third quartile, the thick line is median, whiskers are ± 1.5 interquartile range, and outliers are indicated as individual points.
Extended Data Fig. 4
Extended Data Fig. 4. Dimensionality reduction of single shape data.
a, Color overlay is expression level of the portal marker Asl, or b, the central marker Cyp2e1. c, PC2 versus measured distance ratio portal over central vein for all shapes. d, Top 10-leading edges as Eigenvectors (arrows) with proteins. e, Arterioles were cut as quality controls (see Methods section), and separate from hepatocytes on PC2 (n = 6).
Extended Data Fig. 5
Extended Data Fig. 5. Information aggregation from single shapes.
a, Principal component analysis after averaging of close-by cells, as measured by relative position along the portal to central vein zonation axis. Ratios over every sub-plot indicate concatenation ratio (1:x averages x cells). b, Interquartile range (IQR) of principal components 1 – 5 at given concatenation ratio. c, Variance explained by the indicated principal component at given concatenation ratio.
Extended Data Fig. 6
Extended Data Fig. 6. Functional analysis of single shape data.
a, Volcano plot after ANOVA across 20 spatially guided bins. Color overlay specifies adjusted p value, the top 40 significant proteins are labeled. b, Score and multiple testing-adjusted p value of a Shapiro-Wilk normality test. Lowest proteins are labeled. c, Relative expression normalized to 1 for each contributing protein (n = 10) of the least significant Shapiro-Wilk hits in b, from portal to central distance-guided bins.
Extended Data Fig. 7
Extended Data Fig. 7. Comparison of scDVP to existing scRNAseq data (a-c) and FACS-based proteomics data (d-g).
a, Abundance normalized to 1 across 9 bins in Halpern et al. 6 (marker expression-guided bins), and this scDVP data (spatial bins). b, Intensity correlation of all hits (opaque dots, color according to cluster) and markers (black dots). Linear regression as dashed line, with Pearson correlation coefficient given over the figure. Grey line is the 45 degree line. c, Correlation coefficient for targets across all bins, with multiple testing adjusted p value. Top hits on either side are labeled in dark red, and marker proteins in orange. d, Abundance normalized to 1 across 8 bins in Ben-Moshe et al. 8 (marker expression-guided bins), and this scDVP data (spatial bins). e, Intensity correlation of all hits (opaque dots, color according to cluster) and markers (black dots). Linear regression as dashed line, with Pearson correlation coefficient given over the figure. Grey line is the 45 degree line. f, Correlation coefficient for targets across all bins, with multiple testing adjusted p value. Top hits on either side are labeled in dark red, and marker proteins in orange. g, A significant hit after gene set enrichment analysis on Pearson correlation coefficients, with normalized abundance of protein levels as heatmap colors.
Extended Data Fig. 8
Extended Data Fig. 8. Changes in subcellular compartment composition across space.
Spatial bins are mean single shape data in 20 equidistant bins from portal to central vein. Ordinate values are z-transformed proportions of summed signal intensities per compartment. Pearson’s R was calculated on z scores from a linear model. Blue line is the linear regression line with the 95% confidence interval in grey.
Extended Data Fig. 9
Extended Data Fig. 9. Machine learning (ML) accurately predicts proteome class.
a, k means clustering, dividing all samples into five classes that inform the ML. b, Feature importance of the ML model, relative to the highest contributor. c, Receiver-Operating-Characteristics for each class. The individual Area Under the Curve (AUC) is given in the graph. d, Precision-recall-curve for the five classes.

References

    1. Kelly RT. Single-cell proteomics: progress and prospects. Mol. Cell Proteomics. 2020;19:1739–1748. doi: 10.1074/mcp.R120.002234. - DOI - PMC - PubMed
    1. Brunner A-D, et al. Ultra-high sensitivity mass spectrometry quantifies single-cell proteome changes upon perturbation. Mol. Syst. Biol. 2022;18:e10798. doi: 10.15252/msb.202110798. - DOI - PMC - PubMed
    1. Derks, J. et al. Increasing the throughput of sensitive proteomics by plexDIA. Nat. Biotechnol. 10.1038/s41587-022-01389-w (2022). - PMC - PubMed
    1. Mund A, et al. Deep visual proteomics defines single-cell identity and heterogeneity. Nat. Biotechnol. 2022;40:1231–1240. doi: 10.1038/s41587-022-01302-5. - DOI - PMC - PubMed
    1. Cunningham, R. P. & Porat-Shliom, N. Liver zonation—revisiting old questions with new technologies. Front. Physiol.12, 732929 (2021). - PMC - PubMed

Publication types