. 2023 Nov;26(11):1894-1905.
doi: 10.1038/s41593-023-01443-z. Epub 2023 Oct 2.

Multilevel visual motion opponency in Drosophila

Affiliations

Multilevel visual motion opponency in Drosophila

Georg Ammer et al. Nat Neurosci. 2023 Nov.

Abstract

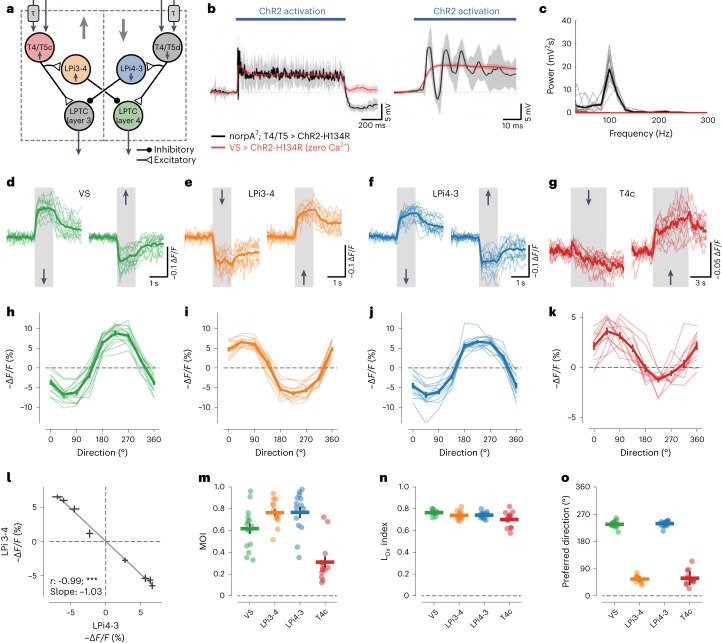
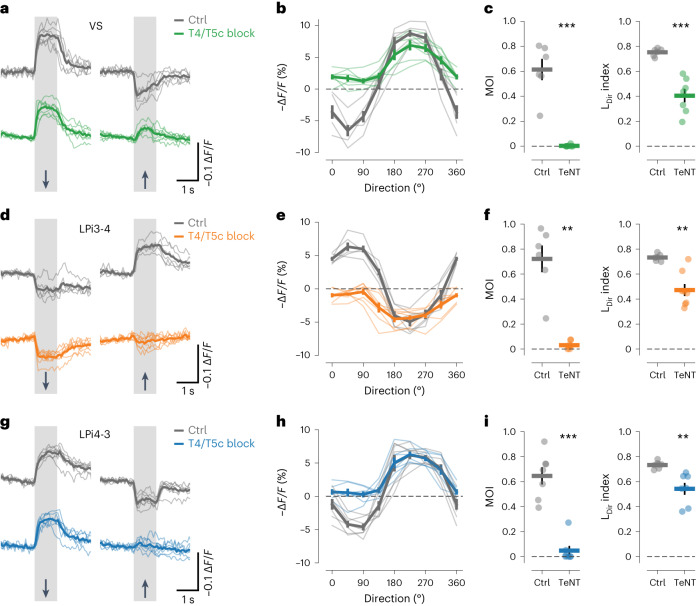
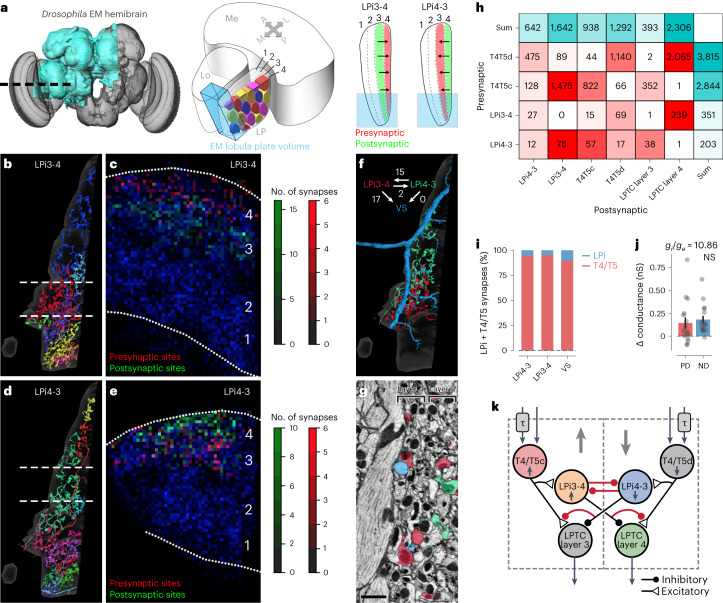
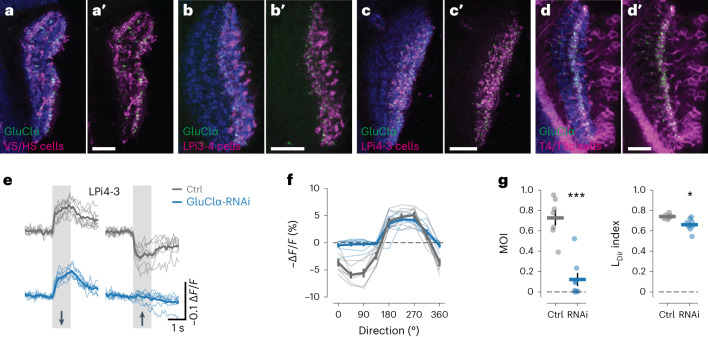
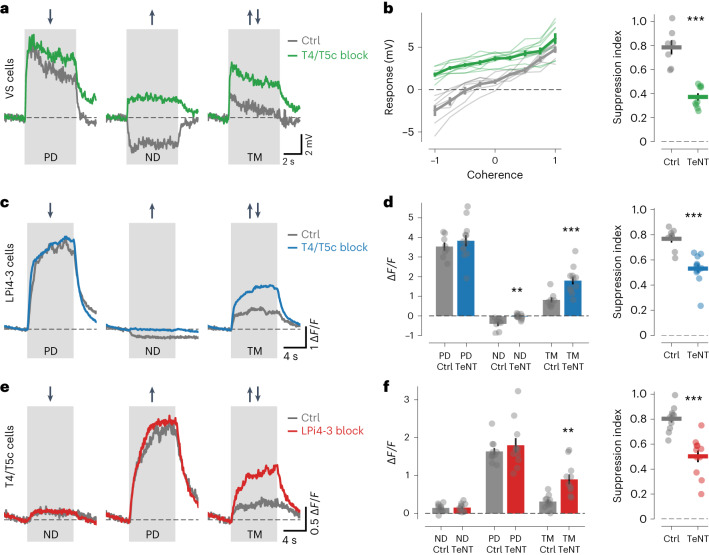
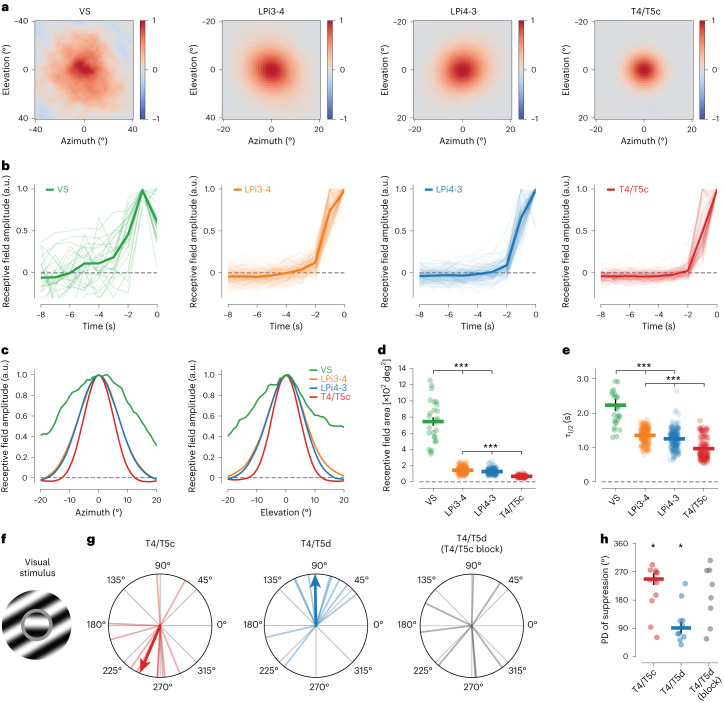
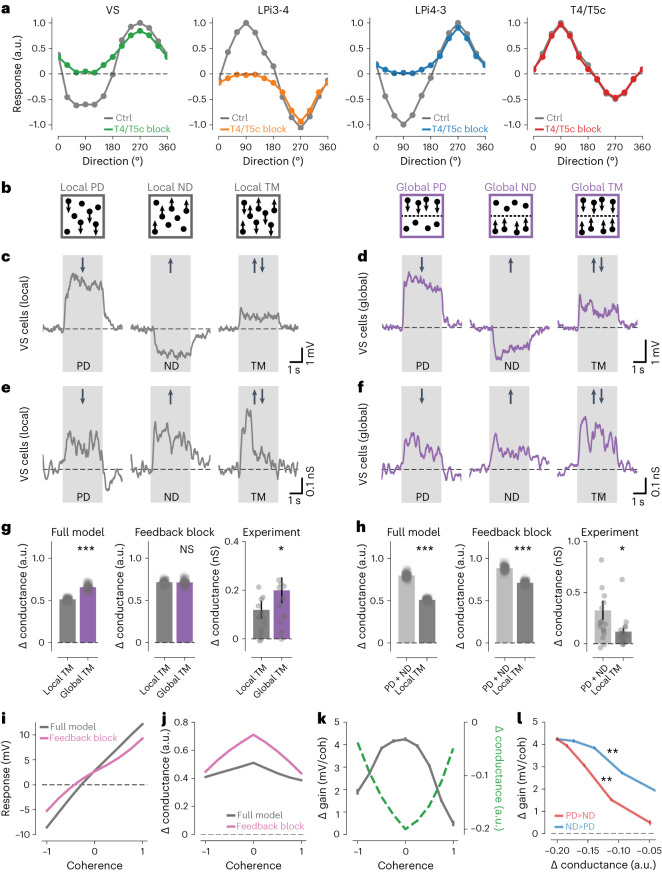
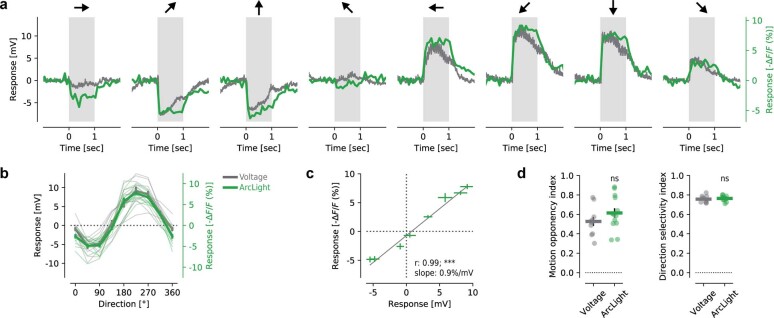
Inhibitory interactions between opponent neuronal pathways constitute a common circuit motif across brain areas and species. However, in most cases, synaptic wiring and biophysical, cellular and network mechanisms generating opponency are unknown. Here, we combine optogenetics, voltage and calcium imaging, connectomics, electrophysiology and modeling to reveal multilevel opponent inhibition in the fly visual system. We uncover a circuit architecture in which a single cell type implements direction-selective, motion-opponent inhibition at all three network levels. This inhibition, mediated by GluClα receptors, is balanced with excitation in strength, despite tenfold fewer synapses. The different opponent network levels constitute a nested, hierarchical structure operating at increasing spatiotemporal scales. Electrophysiology and modeling suggest that distributing this computation over consecutive network levels counteracts a reduction in gain, which would result from integrating large opposing conductances at a single instance. We propose that this neural architecture provides resilience to noise while enabling high selectivity for relevant sensory information.


Conflict of interest statement

The authors declare no competing interests.

Figures

Fig. 1
Fig. 1. Motion-opponent voltage responses in the lobula plate motion vision circuitry.
a, Neural circuit architecture of the core lobula plate circuitry. Differential temporal filtering of inputs to T4/T5 cells is indicated by the symbol τ. Of the four lobula plate layers, only layers 3 and 4 are shown for simplicity. b, Membrane potential responses of VS cells to optogenetic stimulation of either T4/T5 (black trace) or VS cells (red trace). Note that synaptic transmission was silenced by using Ca2+-free external saline when stimulating VS cells. The full response trace (left) and zoom-in (right) are shown. ChR2, channelrhodopsin-2. c, Power spectra of optogenetically induced responses from b. dg, Voltage response traces of VS (d), LPi3-4 (e), LPi4-3 (f) and T4c cells (g) to gratings (df) or dots (g) moving in the PD or ND. hk, Directional tuning curves for VS (h), LPi3-4 (i), LPi4-3 (j) and T4c cells (k). l, Linear regression between LPi3-4 and LPi4-3 cell voltage responses to the same stimulus directions. ***P  < 0.001. mo, MOIs (m), LDir indices (n) and preferred tuning directions (o) of all imaged cell types. The data in b,c are from n = 3 flies per genotype. The data in do are from VS (n = 15), LPi3-4 (n = 13), LPi4-3 (n = 15) and T4c cells (n = 13 flies). The thin lines and dots represent individual flies. The thick lines and error bars indicate the mean ± s.e.m. In l, a Wald test was used. See also Extended Data Figs. 1 and 2. Source data
Fig. 2
Fig. 2. Direction-selective input from the oppositely tuned lobula plate layer generates motion opponency.
ac, Voltage response traces to PD and ND motion (a), directional tuning curves (b) and motion opponency (left) and LDir indices (right) (c) of VS cells from control (gray) and T4/T5c block flies (color). df, Same as ac but for LPi3-4 cells. gi, Same as ac but for LPi4-3 cells. The data in ac are from T4/T5c block (n = 7) and Ctrls (n = 6 flies). The data in df are from T4/T5c block (n = 7) and Ctrls (n = 6 flies). The data in gi are from T4/T5c block (n = 7) and Ctrls (n = 7 flies). The thin lines and dots represent individual flies. The thick lines and error bars indicate the mean ± s.e.m. In c,f,i, a two-sided Welch’s t-test was used. **P < 0.01, ***P < 0.001. Source data
Fig. 3
Fig. 3. Connectomic analysis of the lobula plate motion vision network.
a, Schematic of the Drosophila hemibrain volume (left). A part of the lobula plate is included in the reconstructed EM volume (middle, indicated in light blue). LPi3-4 cells are mainly presynaptic in layer 4 and postsynaptic in layer 3 of the lobula plate, while the opposite is true for LPi4-3 cells (right). b,c, Reconstructed LPi3-4 cells (partly fragmented) from the hemibrain dataset (b). Presynaptic (red) and postsynaptic (green) sites of LPi3-4 cells in relation to all synapses (blue) were detected in the corresponding EM volume (indicated with dashes in c). Relative positions of the lobula plate layers are indicated with numbers 1–4. d,e, Same as b,c but for LPi4-3 cells. f, Example of single LPi3-4, LPi4-3 and VS cells and their synaptic connections. g, Single EM section with cell profiles from cells in f highlighted in color. Scale bar, 2 µm. h, Connectivity matrix of the analyzed cell types. i, Percentage of synapses from T4/T5 and LPi cells onto other LPi or VS cells. j, VS cell conductance change to PD or ND visual stimulation (Extended Data Fig. 3). NS, not significant. k, Updated schematic of the lobula plate network. Newly identified synaptic connections are highlighted in red. Data in j: n = 16 VS cells. The dots indicate individual cells. The bars and error bars indicate the mean ± s.e.m. The statistical test used was a two-sided Wilcoxon signed-rank test. Source data
Fig. 4
Fig. 4. Motion-opponent inhibition is mediated by the glutamate-gated chloride channel GluClα.
a,a′, The inhibitory glutamate receptor GluClα localizes to VS and HS cell dendrites. b,b′, GluClα localizes mainly to lobula plate layer 3 in LPi3-4 cells. c,c′, GluClα localizes predominantly to lobula plate layer 4 in LPi4-3 cells. d,d′, GluClα localizes to the axon terminals of T4/T5c cells in lobula plate layer 3. nc82 staining is shown in blue in ad. eg, Voltage response traces to PD and ND motion (e), directional tuning curves (f) and MOIs (left) and LDir indices (right) (g) of LPi4-3 cells from control (gray) and GluClα-RNAi flies (blue). Scale bars in ad, 10 µm. Data in eg are from Ctrls (n = 7) and GluClα-RNAi (n = 7 flies). *P < 0.05, ***P < 0.001. The dots and thin lines represent individual flies. The thick lines and error bars indicate the mean ± s.e.m. In g, a two-sided Welch’s t-test was used. See also Extended Data Fig. 4. Source data
Fig. 5
Fig. 5. Voltage and calcium responses of VS, LPi4-3 and T4/T5c cells to TM.
a,b, Voltage responses of VS cells to PD, ND and TM from control (gray) or T4/T5c block flies (green). Response traces are shown in a. Mean responses for different ‘coherences’ of moving dots (left) and motion-opponent suppression indices (right) are shown in b. c,d, Calcium responses of LPi4-3 cells to PD, ND and TM from Ctrl (gray) or T4/T5c block flies (blue). Response traces are shown in c. Bar plots of mean responses (left) and motion-opponent suppression indices (right) are shown in d. e,f, Same as in c,d but for calcium responses of T4/T5c cells from Ctrl (gray) and LPi4-3 block flies (the data in a,b are from Ctrl (7 cells) and T4/T5c block (9 cells); the data in c,d are from Ctrl (8 flies) and T4/T5c block (12 flies); and the data in e,f from Ctrl (11 flies) and LPi4-3 block (11 flies)). The voltage or calcium traces in a,c,e indicate the mean responses. The thin lines or dots in b,d,f represent individual cells or flies. The thick lines or bars in b,d,f indicate the mean ± s.e.m. The statistical test used was a two-sided Welch’s t-test. See also Extended Data Fig. 5. **P < 0.01, ***P < 0.001. Source data
Fig. 6
Fig. 6. A gradient of spatiotemporal motion receptive fields in the lobula plate.
a, Average spatial receptive fields of VS, LPi3-4, LPi4-3 and T4/T5c cells measured with stochastic motion noise. Spatial receptive fields correspond to the time point of maximal responses in b. Note the different scale of the x and y axes for VS cells compared with the other cell types. b, Temporal receptive fields (calculated from the spatial receptive field centers) of all cell types. c, One-dimensional slices through the centers of the spatial receptive fields from a along the azimuth (left) and elevation (right). d, Comparison of spatial receptive field areas. e, Comparison of the decay times (τ1/2) of the temporal receptive fields. fh, Directional suppression of T4/T5 cells to an annulus motion stimulus. f, Schematic of the annulus motion stimulus (Methods). g, PD of suppression for T4/T5c (left) and T4/T5d (middle) cells, and T4/T5d cells with T4/T5c blocked (right). h, Comparison of PDs of suppression. Directional tuning of suppression is lost in T4/T5d cells on blocking T4/T5c cells. Data in ae are from VS (N = 10, n = 26), LPi3-4 (N = 10, n = 237), LPi4-3 (N = 11, n = 199) and T4/T5c (N = 9, n = 201, with N = flies and n = regions of interest (ROIs). Data in g,h are from T4/T5c (n = 12), T4/T5d (n = 10) and T4/T5d (T4/T5c-block) (n = 8 flies). The thick lines indicate mean data. The thin lines or dots indicate individual ROIs. The data in d,e,h indicate the mean ± s.e.m. In d,e, a two-sided Holm’s-corrected Mann–Whitney U-test was used. In h, a Rayleigh z-test was used. *P < 0.05, ***P < 0.001. Source data
Fig. 7
Fig. 7. Functional roles of motion-opponent levels in the lobula plate.
a, Directional tuning curves of model VS, LPi3-4, LPi4-3 and T4/T5c cells from lobula plate network simulations stimulated with moving gratings. The simulations were run with normal network connectivity (gray) or with T4/T5c cells blocked (colors). b, Cartoons illustrating the visual stimuli used below. c,d, Electrophysiologically measured voltage responses of VS cells to dots moving in PD, ND or to TM stimuli. ‘Local’ stimuli are shown in c (gray) and ‘global’ stimuli are shown in d (purple). e,f, Same as c,d but for electrophysiologically measured conductance changes instead of voltage responses. g, Conductance changes of full model (left) or when LPi-T4/T5 and LPi-LPi connections were blocked simultaneously (‘feedback block’, middle) and experimentally measured responses (right) for local (dark gray) and global (purple) TM stimuli. h, Like g but comparing the sum of local PD + ND (light gray) and local TM (dark gray). Note that, to facilitate comparison between experiment and model, 3 of 32 (g) and 1 of 32 (h) data points are beyond the arbitrarily set y axis limits. Plots with all individual data points are shown in Extended Data Fig. 8a–c. i,j, Voltage responses (i) and conductance changes (j) of VS cells from full network model (gray) or model without inhibitory feedback connections (pink) to local TM stimuli with different coherences (coh). k, Gain (gray) and conductance (green) differences between full model and feedback block for different motion coherences. l, Correlation between conductance difference and gain difference for PD-dominated (red, r = −0.99) or ND-dominated (blue, r = −0.98) motion. Data in ch: n = 16 VS cells. Response traces indicate mean responses. The dots indicate individual cells or model runs. The bars and error bars indicate the mean ± s.e.m. A two-sided paired Student’s t-test was used for the model data in g,h; a two-sided Wilcoxon signed-rank test was used for the experimental data in g,h; and in l, a Wald test was used. See also Extended Data Figs. 7 and 8. *P < 0.05, **P < 0.01, ***P < 0.001. Source data
Extended Data Fig. 1
Extended Data Fig. 1. Voltage imaging reliably reports motion-opponent visual responses in VS Cells.
a, Comparison of VS cell responses to gratings moving in eight different directions measured either electrophysiologically (grey) or with two-photon voltage imaging (green). b, Directional tuning curves of VS cell responses from data shown in (a). c, Linear regression between electrophysiological and voltage imaging responses of VS cells to same stimulus directions. d, Motion opponency index (left) and direction selectivity index (right) for data measured electrophysiologically or with voltage imaging. Data in (a-d) are from n = 5 flies, 10 cells (electrophysiology) and n = 7 flies, 13 cells (voltage imaging). Response traces: mean responses. Thin lines or dots: individual cells. Bars and error bars: mean ± s.e.m. Statistical tests: Wald test (c) and two-sided unpaired Student’s t-test (d). Source data
Extended Data Fig. 2
Extended Data Fig. 2. Motion-opponent calcium responses in the lobula plate motion vision circuitry.
a-e, Calcium responses of VS (a), LPi3-4 (b), LPi4-3 (c) and T4c cells (d,e) to gratings (a-d) or dots (e) moving in the preferred- or null-direction. f-j, Directional tuning curves for VS (f), LPi3-4 (g), LPi4-3 (h) and T4c cells (i,j). k-m, Motion opponency indices (k), direction selectivity indices (l) and preferred directions (m) calculated from voltage responses (ArcLight) or calcium responses (GCaMP). Voltage imaging data in (k-m) are replotted from Fig. 1m–o. n-q, Plotting calcium against voltage responses of VS (n), LPi3-4 (o), LPi4-3 (p) and T4c cells (q) reveals a rectifying transformation between these two signals. Calcium imaging data in (a-m) are from VS: n = 11, LPi3-4: n = 13, LPi4-3: n = 11, T4c (grat): n = 6 and T4c (dots): n = 10 flies. Data in (n-q) are same as in (f,g,h,j) for calcium response and Fig. 1h–k for voltage responses. Thick lines in (a-j): mean data, thin lines: individual flies. Data in (f-q): mean ± s.e.m. Dots in (k-m): individual flies. Statistical test in (k-m): two-sided unpaired Student’s t-test. Source data
Extended Data Fig. 3
Extended Data Fig. 3. Inhibitory synapses have a much higher unitary conductance than excitatory synapses.
a, Percentage of synapses from T4/T5 and LPi cells onto different other cell types. Data are from the present study (left) or a recent publication (right). VS (4) and VS (2) refers to dendritic branches of VS cells that arborize in lobula plate layer 2 or 4. b, Synaptic conductance ratio relative to total conductance ratio for different cell types, as calculated from a simple biophysical model. c, VS cell conductance change in response local (left) and global (right) transparent motion moving in the preferred- or null-direction (see also Fig. 7b–h). Synaptic conductance ratios (gi/ge) derived from the measurements are plotted above. Data in (c) is from n = 16 VS cells. Dots: individual cells. Bars and error bars: mean ± s.e.m. Statistical test in (c): two-sided Wilcoxon signed-rank test. Source data
Extended Data Fig. 4
Extended Data Fig. 4. Subcellular localization of nAChRα7 nicotinic acetylcholine receptors in LPi cells.
a-a’, nAChRα7 localizes mainly to lobula plate layer 3 in LPi3-4 cells. b-b’, nAChRα7 localizes predominantly to lobula plate layer 4 in LPi4-3 cells. Scale bars: 10 µm. Source data
Extended Data Fig. 5
Extended Data Fig. 5. Voltage and calcium responses of LPi4-3, T4/T5c and T4c cells to transparent motion.
a,b, Calcium responses of LPi4-3 cells to preferred-direction (PD), null-direction (ND) and transparent motion (TM). (a) Calcium response traces. (b) Bar plots (left panel) and motion-opponent suppression index (right panel). c,d, Similar to (a,b) but for T4/T5c cells instead of LPi4-3 cells. e,f, Similar to (a,b) but for T4c cells instead of LPi4-3 cells. g,h, Similar to (e,f) but for voltage responses of T4c cells instead of calcium responses. Data in (a,b) are from LPi4-3: 6 flies, in (c,d) from T4/T5c: 6 flies, in (e,f) from T4c: 14 flies, and in (g,h) from T4c: 17 flies. Thin lines or dots: individual flies. Thick lines: mean responses. Bars: mean ± s.e.m. Source data
Extended Data Fig. 6
Extended Data Fig. 6. Axonal and dendritic calcium responses in T4c cells.
a, Anatomy of a single T4 cell with dendrite, axon terminal and cell body indicated. b, Calcium responses of T4c cell dendrites (brown) and axons (violet) to sine-wave gratings moving in the null- (left) or preferred-direction (right). c, Directional tuning curves for T4c cell dendrites (brown) and axons (violet). d, Mean responses for preferred-direction (PD, 90°) and null-direction (ND, 270°) stimuli. e, Motion opponency (left), direction selectivity (middle) and preferred directions (right) of T4c cell dendrites and axons. f-i, Same as (b-e) but in response to dot motion stimuli. j-m, Same as (b-e) but in response to moving ON edges. Note that T4c cell dendrites and axons do not show differences in motion opponency and direction selectivity in response to moving ON edges. This is presumably because the blank arena screen before stimulus motion does not lead to elevated calcium levels (as for grating and dot stimuli), resulting in a floor effect. Data in (b-e) are from T4c dendrites: n = 9, T4c axons: n = 9 flies. Data in (f-i) are from T4c dendrites: n = 11, T4c axons: n = 11 flies. Data in (j-m) are from T4c dendrites: n = 5, T4c axons: n = 6 flies. Response traces in (b,f,j): mean responses. Thick lines and error bars: mean ± s.e.m. Dots: individual flies. Statistical tests: two-sided dependent t-test for paired samples (d,e) and (h,i) and two-sided unpaired Student’s t-test (l,m). Source data
Extended Data Fig. 7
Extended Data Fig. 7. Tuning indices, voltage responses and conductance changes of the network model.
a-c, Motion opponency indices (a), direction selectivity indices (b) and preferred directions (c), in response to sine-wave grating stimuli for different cell types of the full network model (Ctrl) and when blocking output from T4/T5c cells (Block, related to Fig. 7a). d, Response selectivity, as measured by motion-opponent suppression to the local (left) or global (right) transparent motion stimulus, for the full network model and when blocking the different motion-opponent levels. ‘Feedback block’ indicates that LPi-T4/T5 and LPi-LPi connections were blocked simultaneously. e, Voltage responses (upper panels) and conductance changes (lower panels) of model VS cells from the full network model to local transparent motion stimuli (local TM) with different coherences and to global transparent motion (global TM). f, Similar to (e) but when blocking inhibitory feedback-connections (‘feedback block’) in the network model. Data in (a-c) are from a single model run. Dots and thick lines in (d) represent individual model runs and mean values, respectively. Data in (e-f) represent mean values from 300 model runs. Source data
Extended Data Fig. 8
Extended Data Fig. 8. Additional results of the lobula plate network model.
a, Conductance changes of network models with (left) or without feedback connections (middle) and experimentally measured responses (right) for local (dark grey) and global (dark purple) transparent motion stimuli (same data as Fig. 7g). b, Similar to (a) but comparing sum of local PD + ND (light grey) and local TM (dark grey), (same data as Fig. 7h). c, Similar to (a) but comparing sum of global PD + ND (light purple) and global TM (dark purple). d, Differential voltage responses between full network model and model without inhibitory feedback connections to local transparent motion stimuli with different coherences. e, Response gain of VS cells from full model (grey) and with feedback connections blocked (pink) for different motion coherences. f,g, Voltage responses (f) and conductance changes (g) of VS cells from full network model (grey) or models in which different inhibitory connections (red, LPi-T4/T5 block; orange, LPi-LPi block; green, LPi-VS block) were blocked in response to different motion coherences. Data in (a-c): n = 16 VS cells. Response traces: mean responses. Dots: individual cells or model runs. Bars and error bars: mean ± s.e.m. Statistical tests: two-sided paired Student’s t-tests (model data) and two-sided Wilcoxon signed-rank tests (experimental data). Source data

References

    1. Luo L. Architectures of neuronal circuits. Science. 2021;373:eabg7285. doi: 10.1126/science.abg7285. - DOI - PMC - PubMed
    1. Carandini M, Heeger DJ. Normalization as a canonical neural computation. Nat. Rev. Neurosci. 2011;13:51–62. doi: 10.1038/nrn3136. - DOI - PMC - PubMed
    1. Milo R, et al. Network motifs: simple building blocks of complex networks. Science. 2002;298:824–827. doi: 10.1126/science.298.5594.824. - DOI - PubMed
    1. Shepherd, G. M. in The Synaptic Organization of the Brain (ed. Shepherd, G. M.) 1–38 (Oxford Univ. Press, 2004).
    1. Gegenfurtner KR, Kiper DC. Color vision. Annu. Rev. Neurosci. 2003;26:181–206. doi: 10.1146/annurev.neuro.26.041002.131116. - DOI - PubMed

LinkOut - more resources