. 2023 Oct;5(10):1691-1705.
doi: 10.1038/s42255-023-00893-w. Epub 2023 Oct 2.

A subpopulation of lipogenic brown adipocytes drives thermogenic memory

Affiliations

A subpopulation of lipogenic brown adipocytes drives thermogenic memory

Patrick Lundgren et al. Nat Metab. 2023 Oct.

Abstract

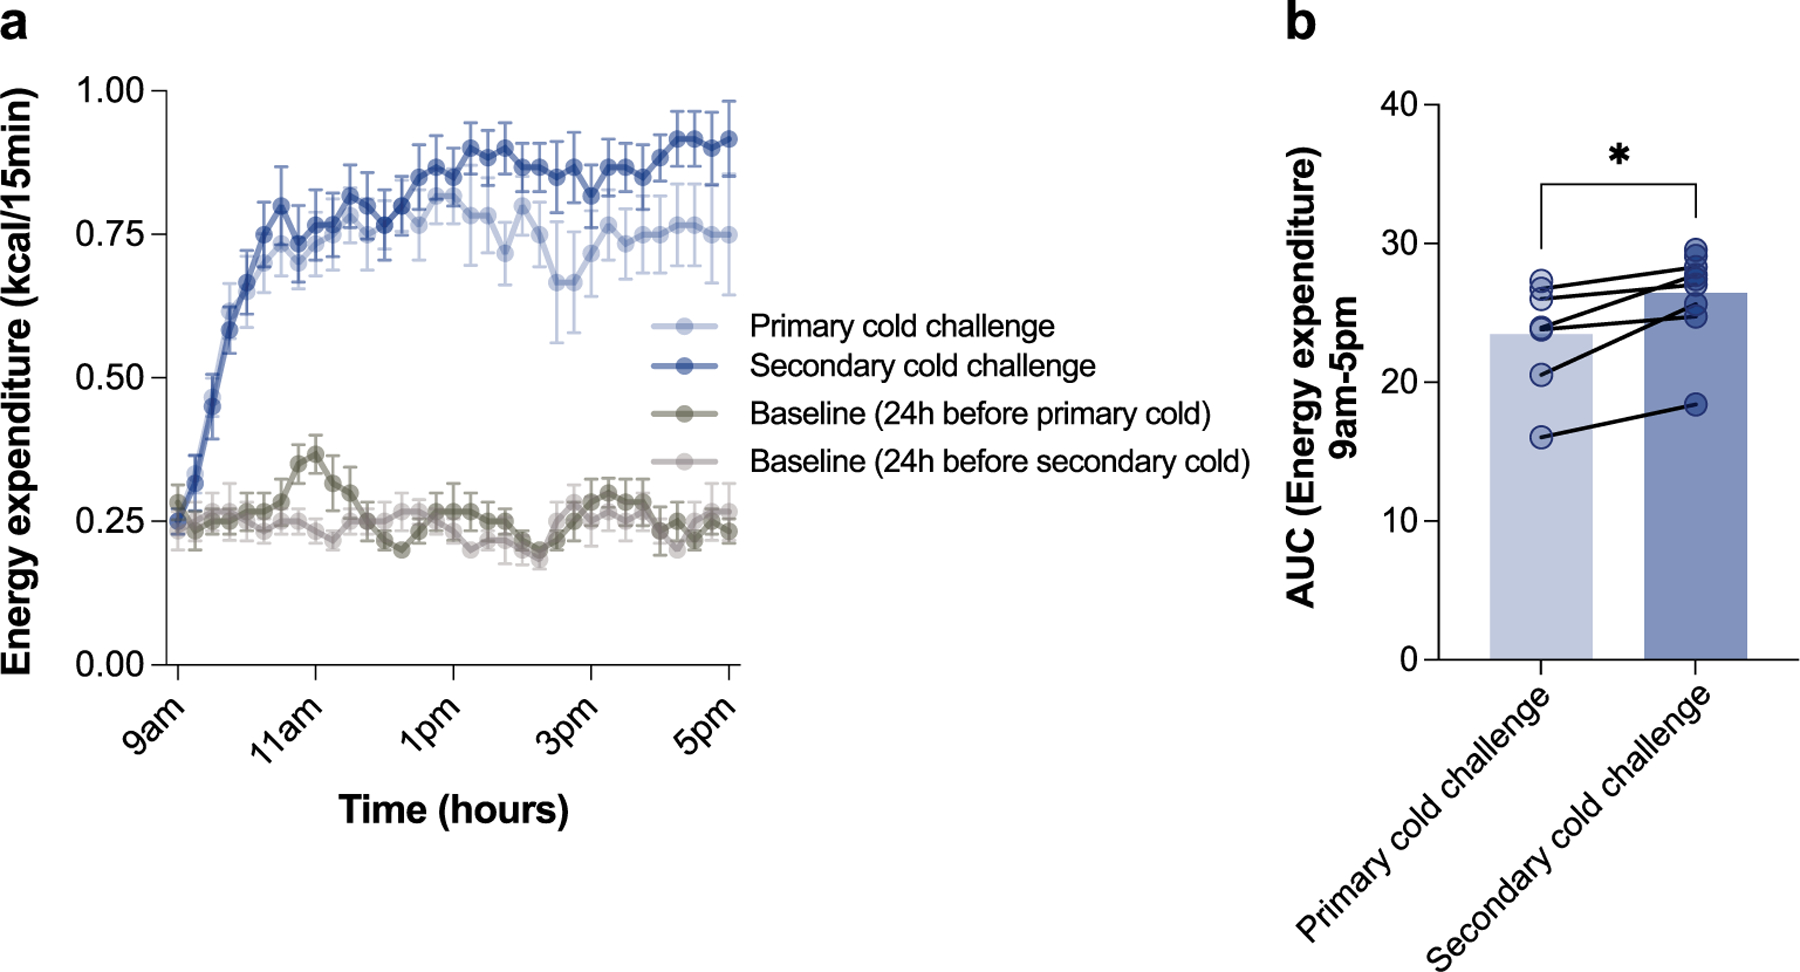
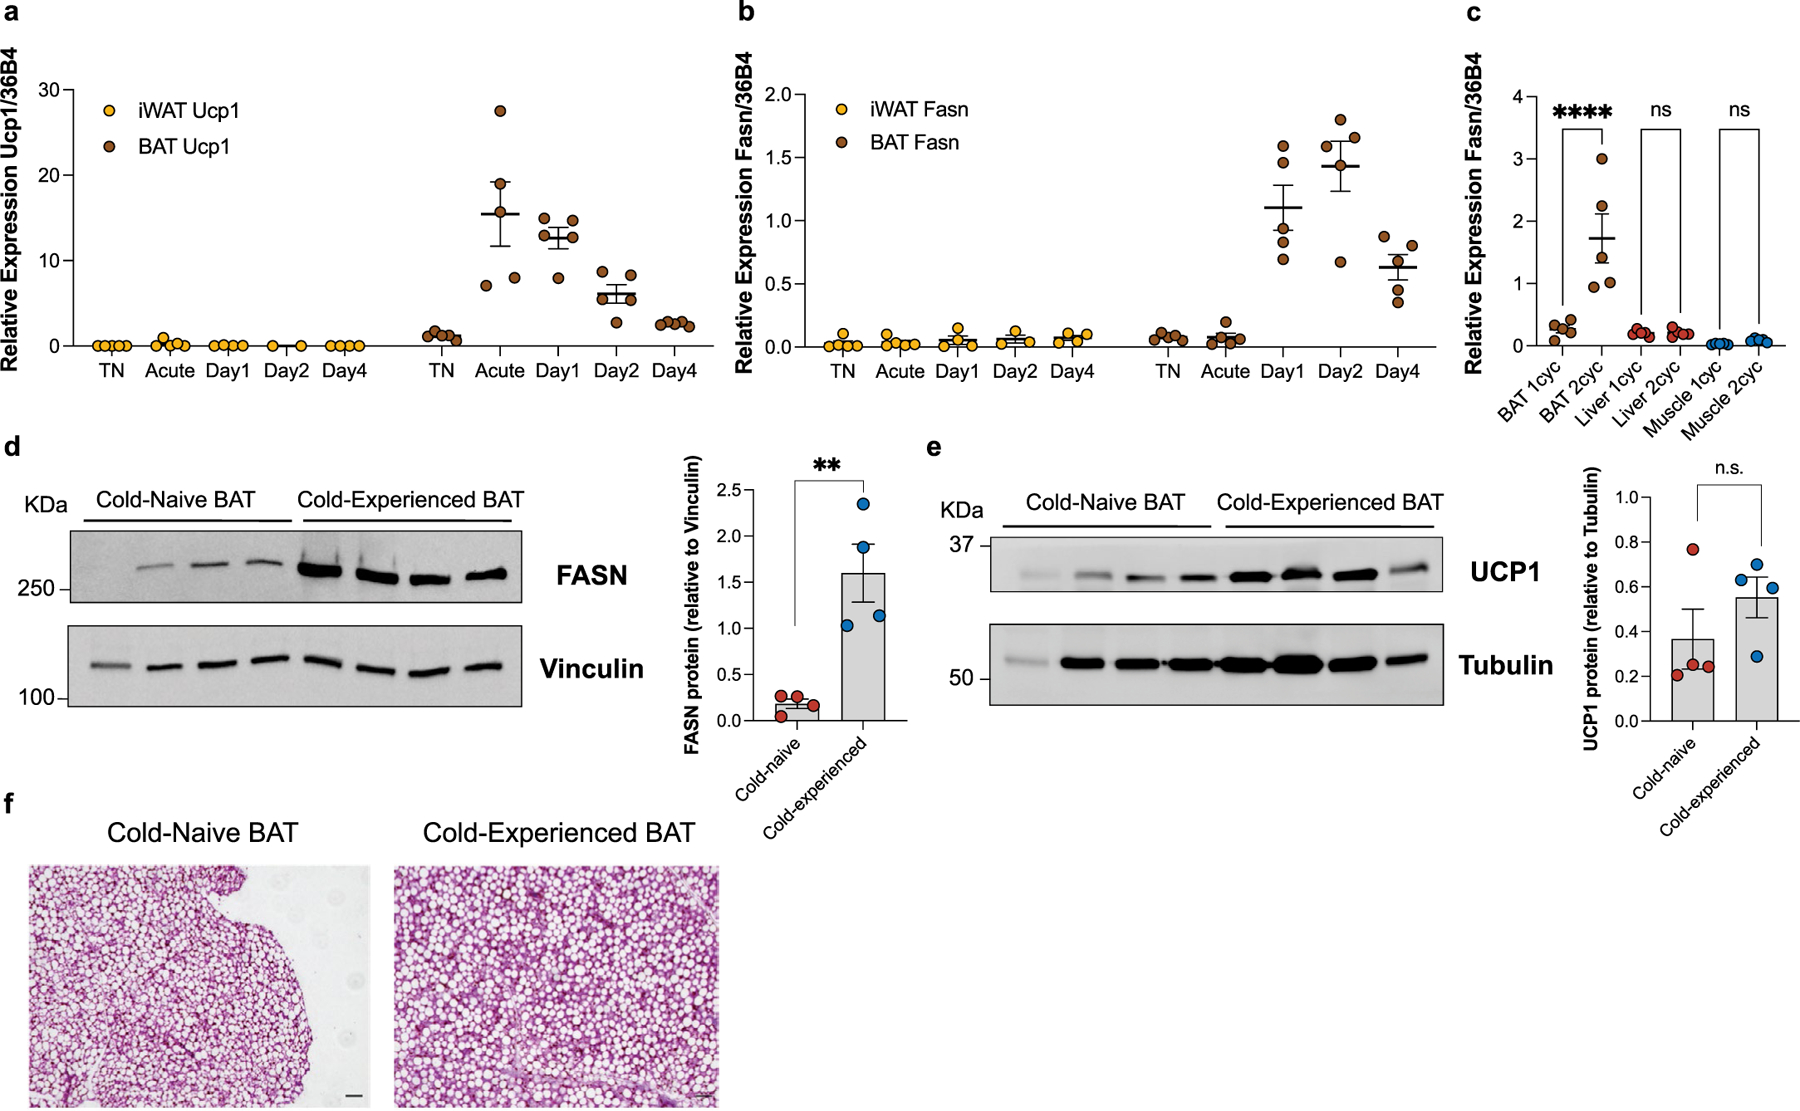
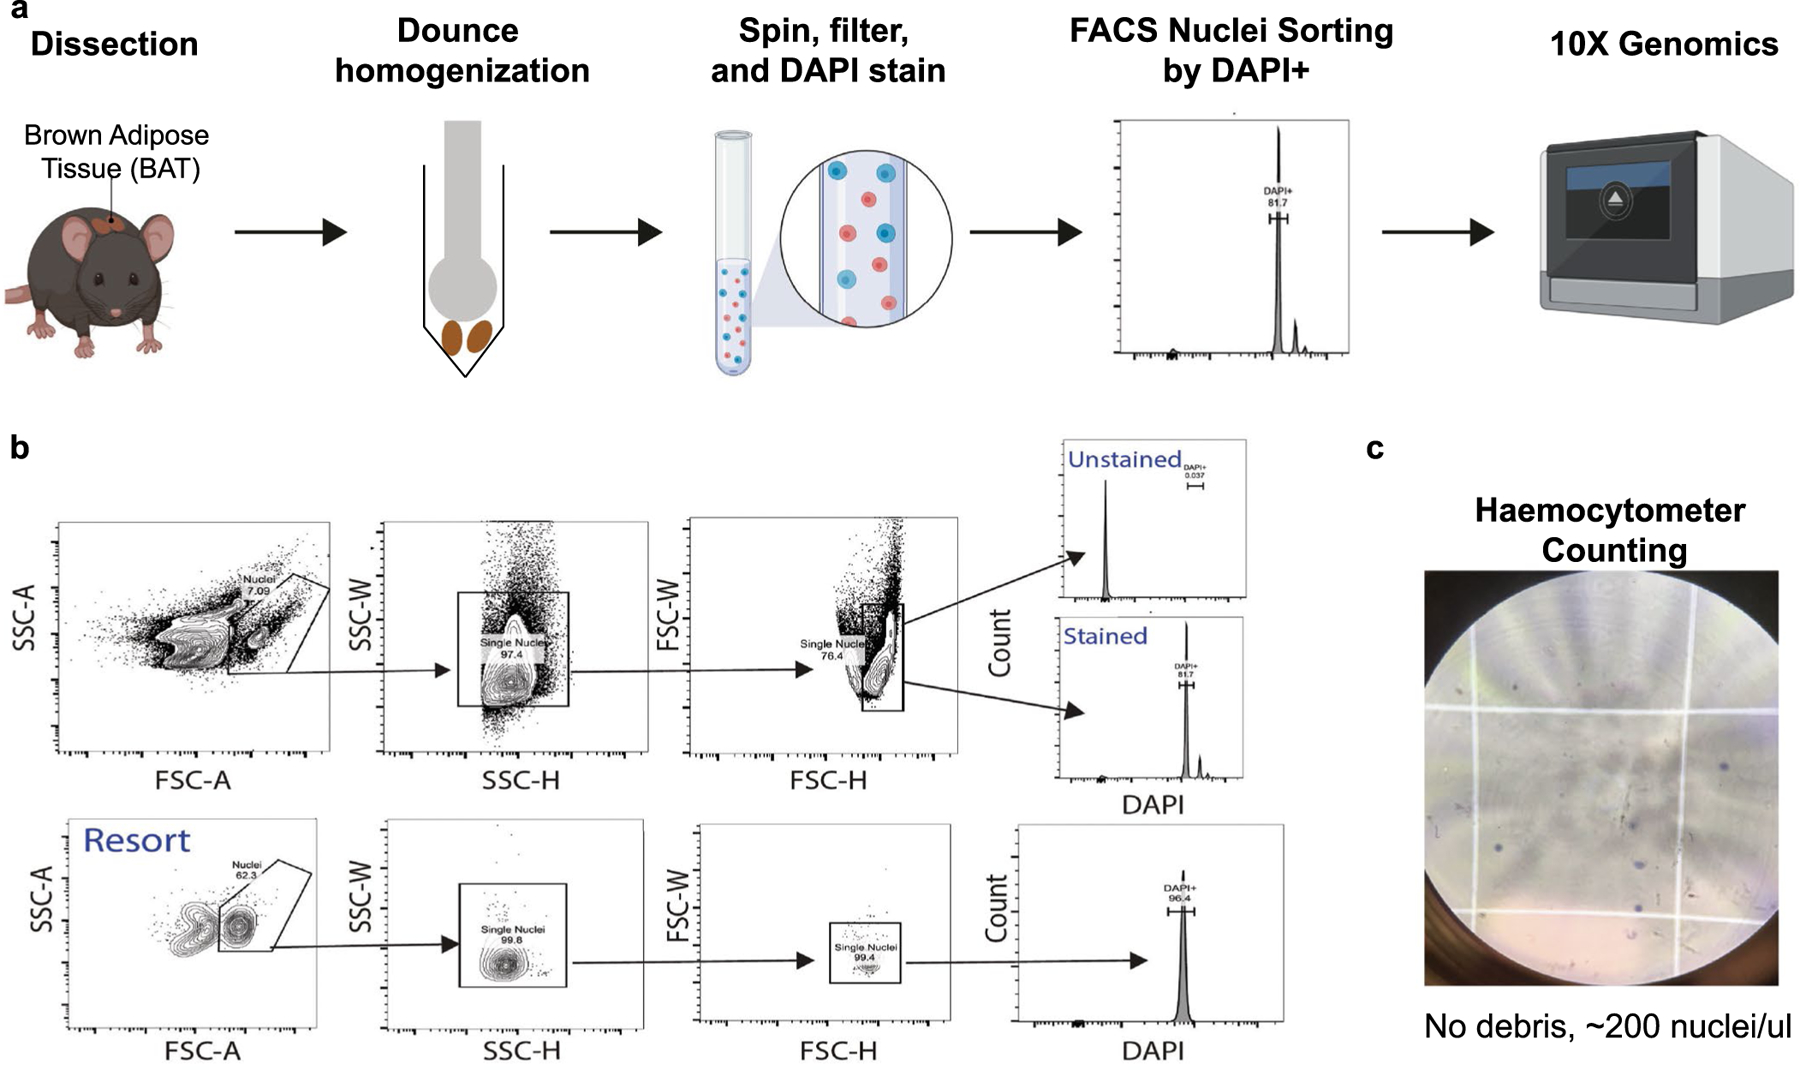
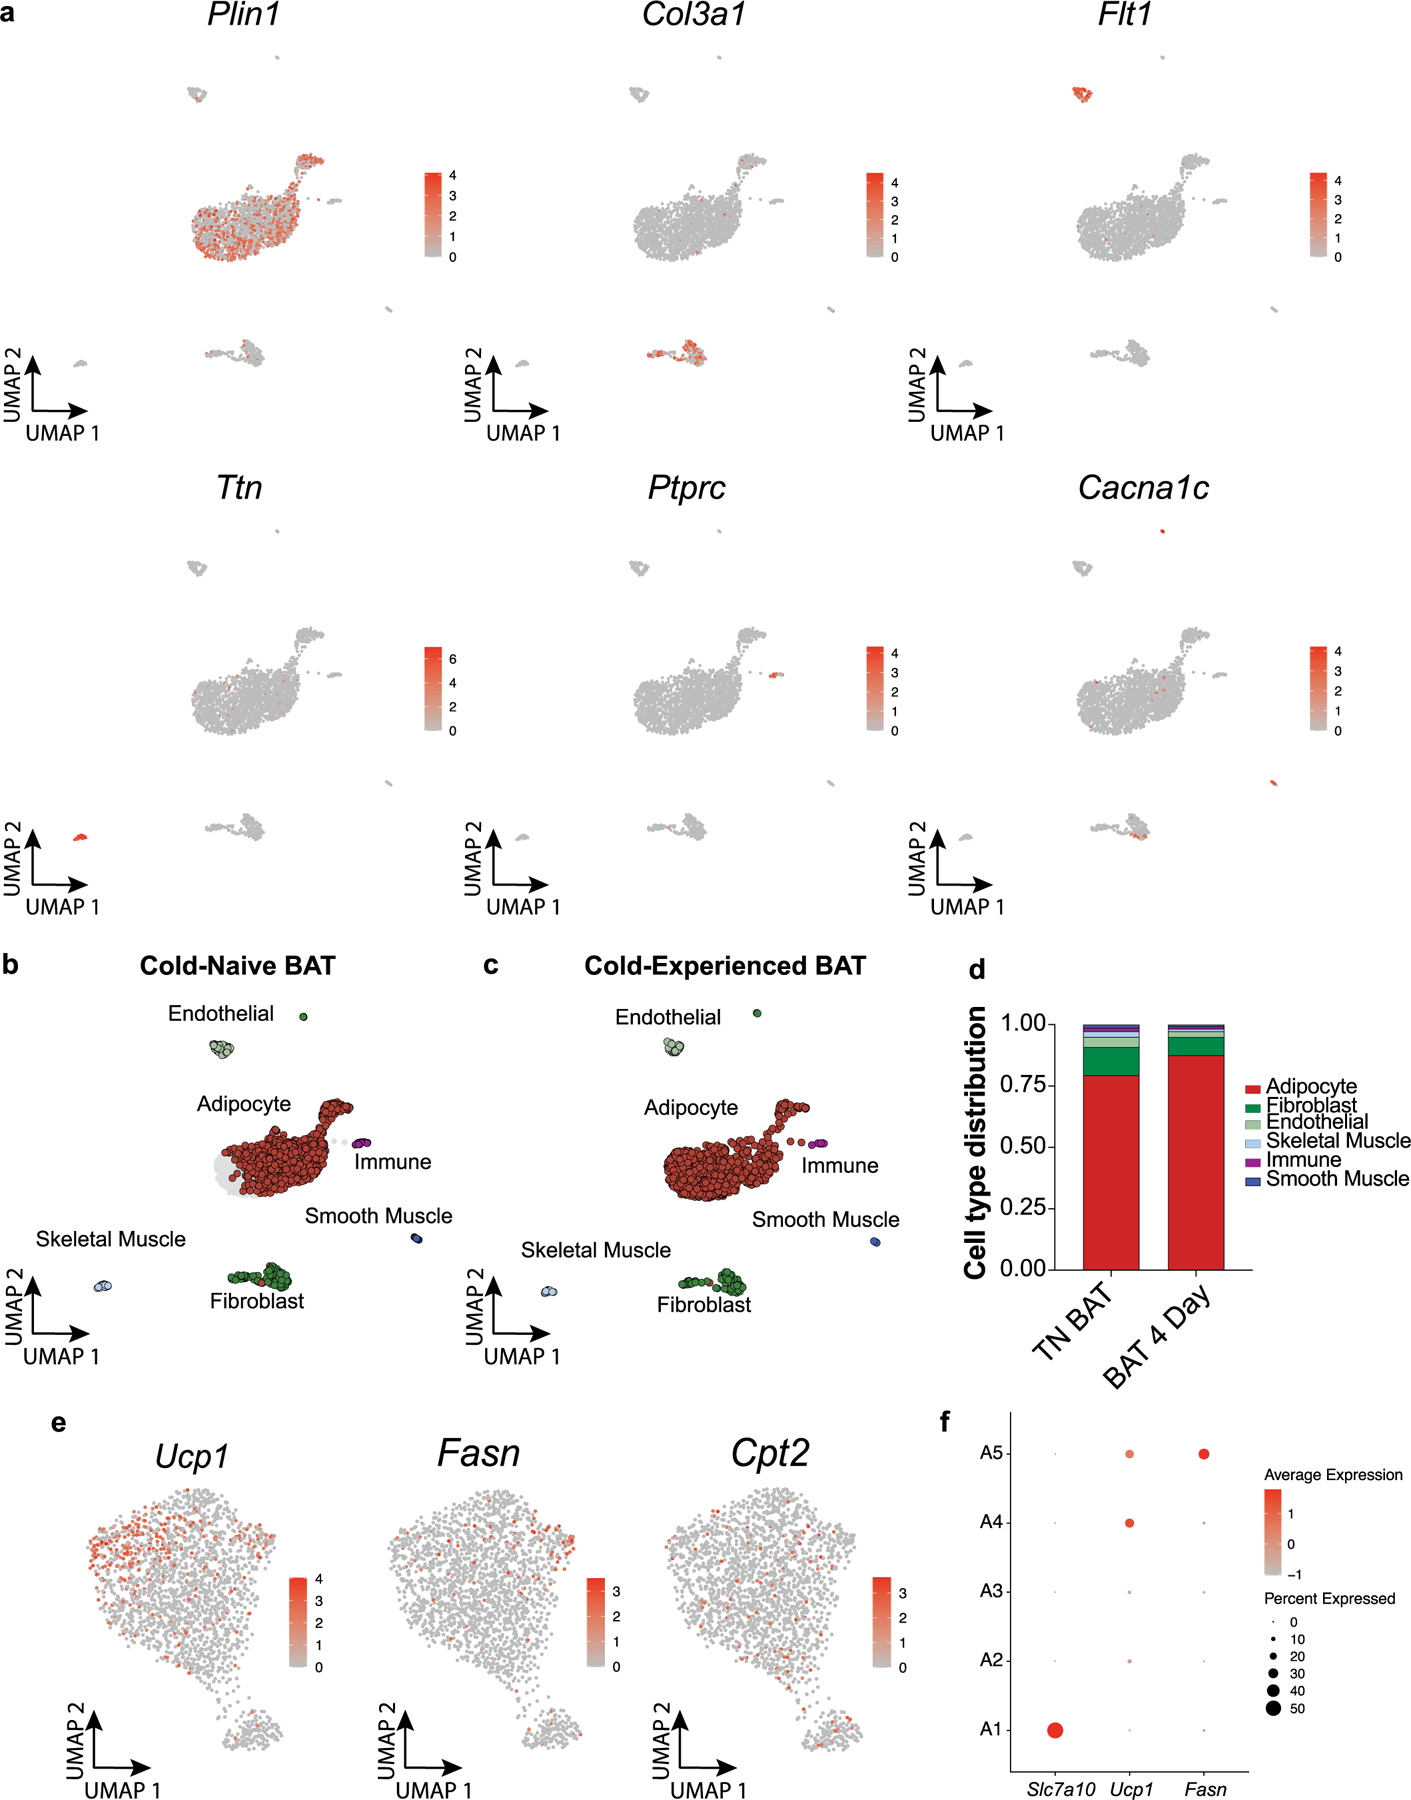
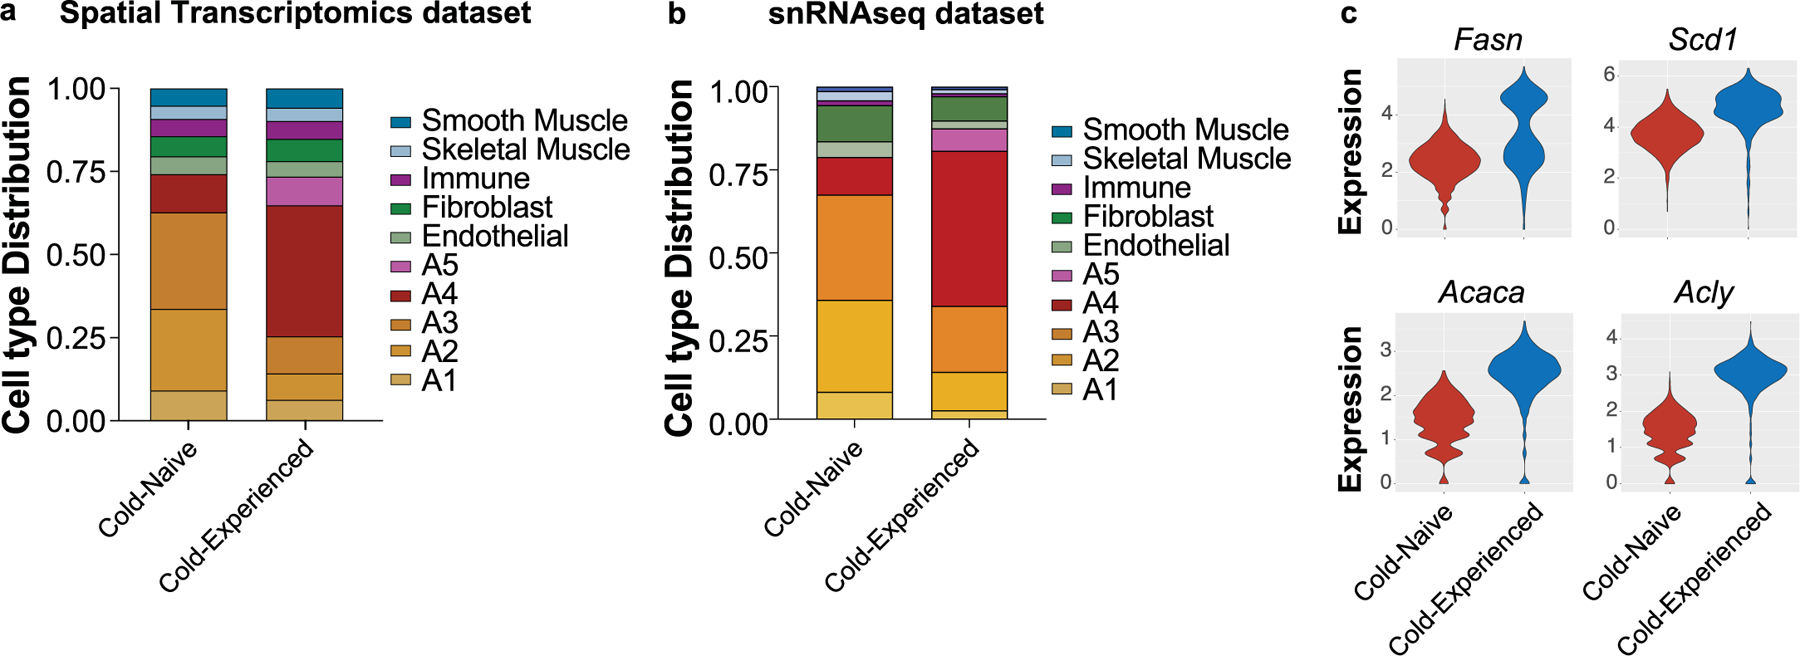
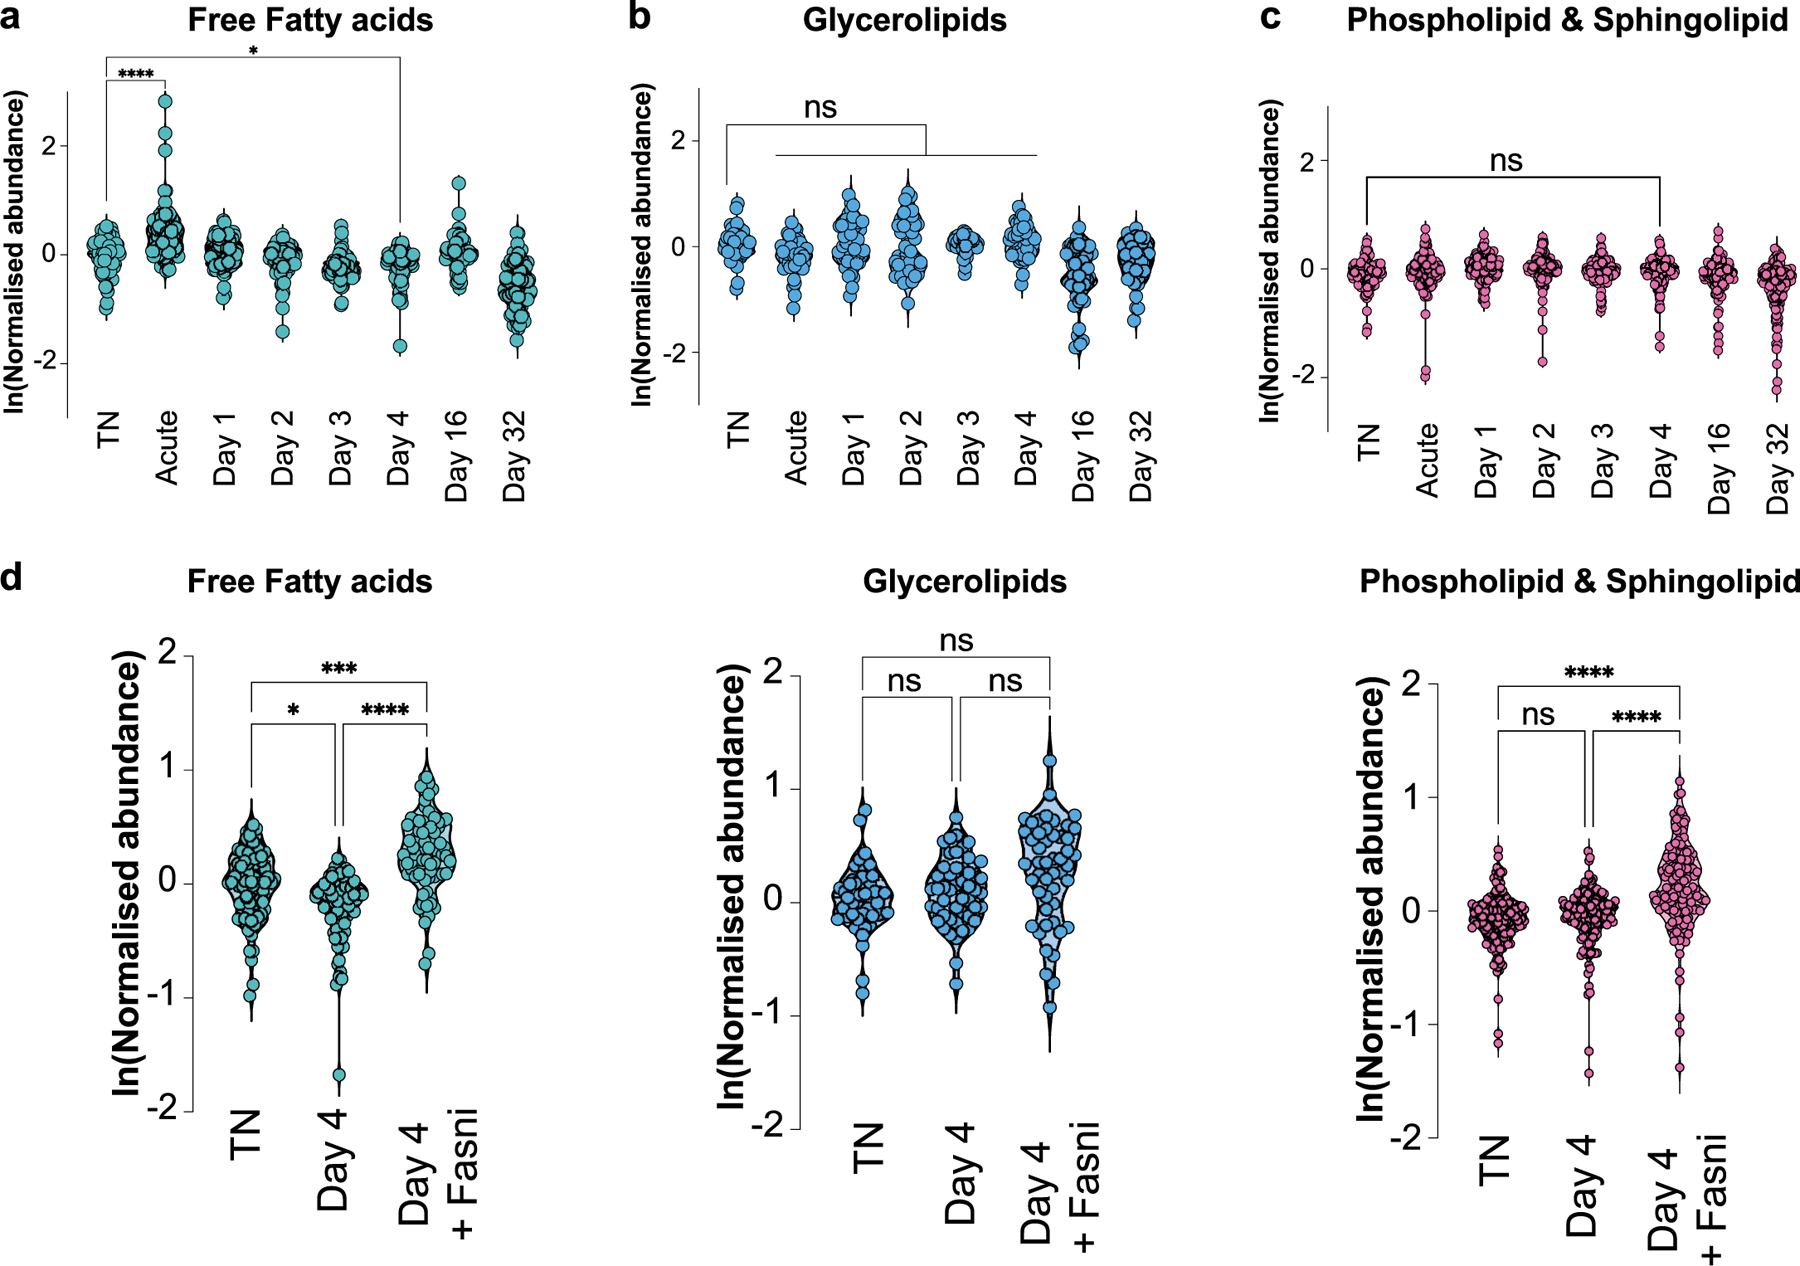
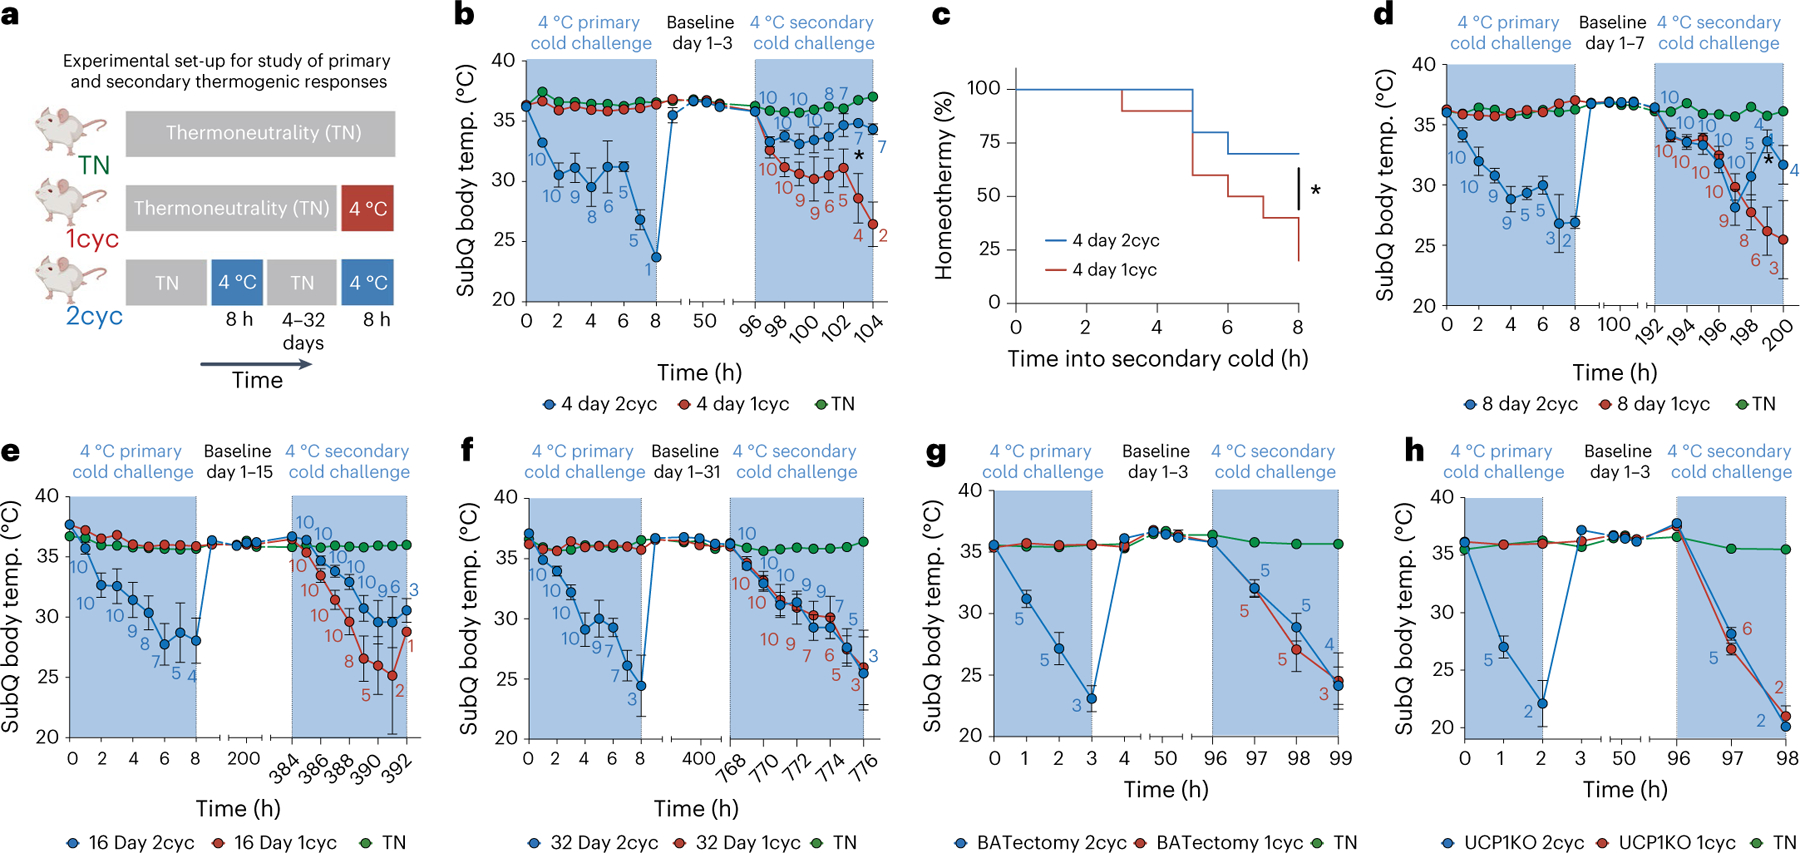
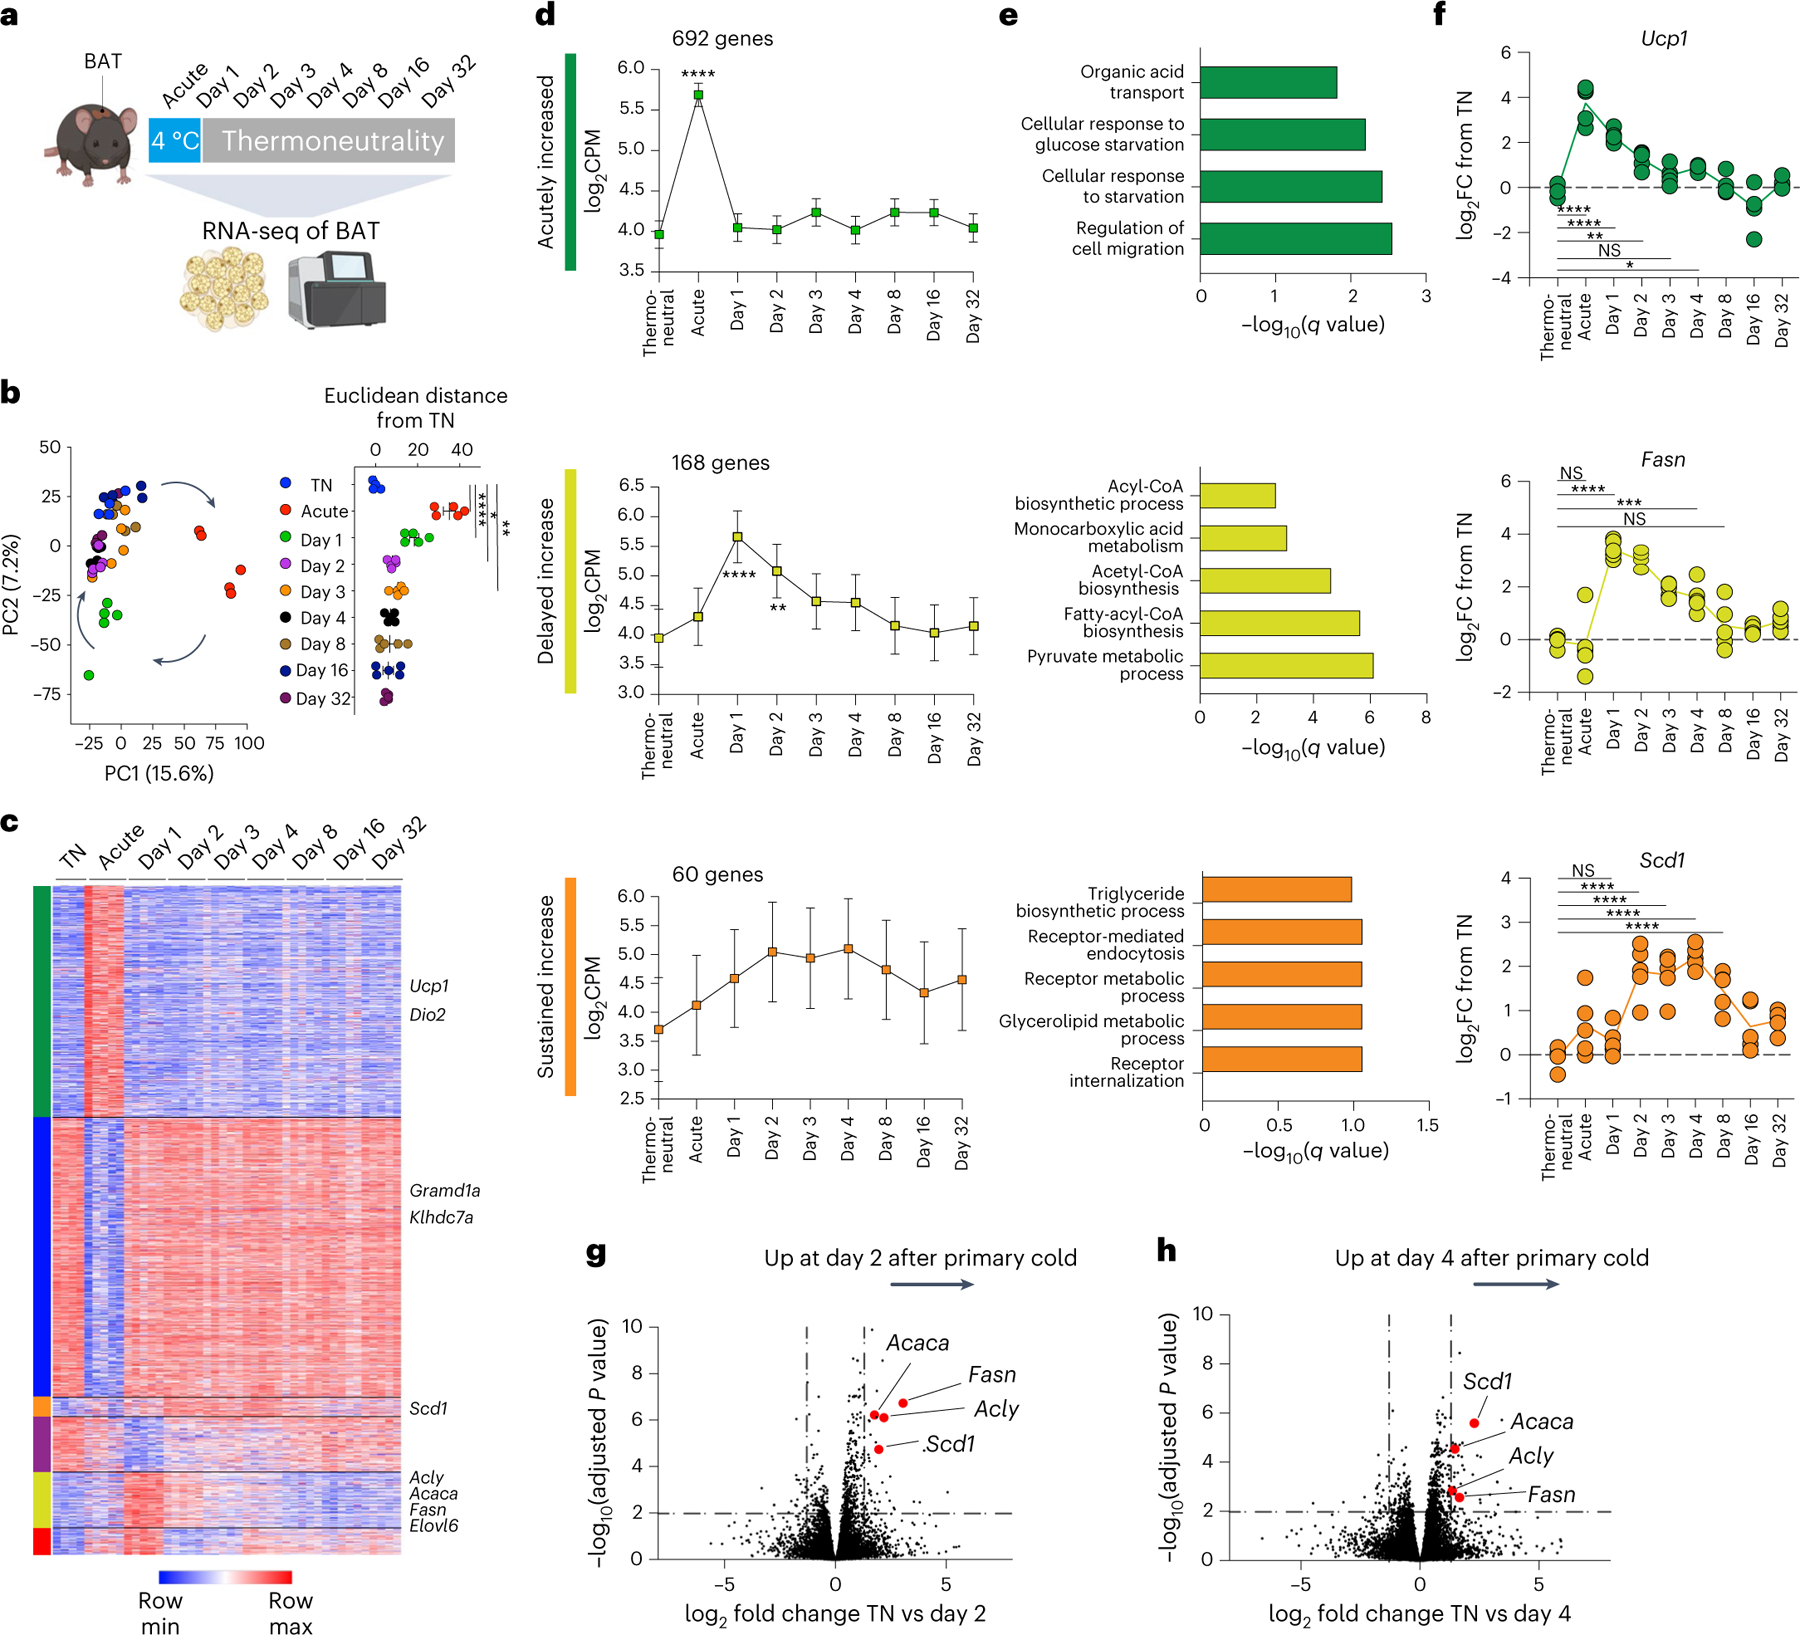
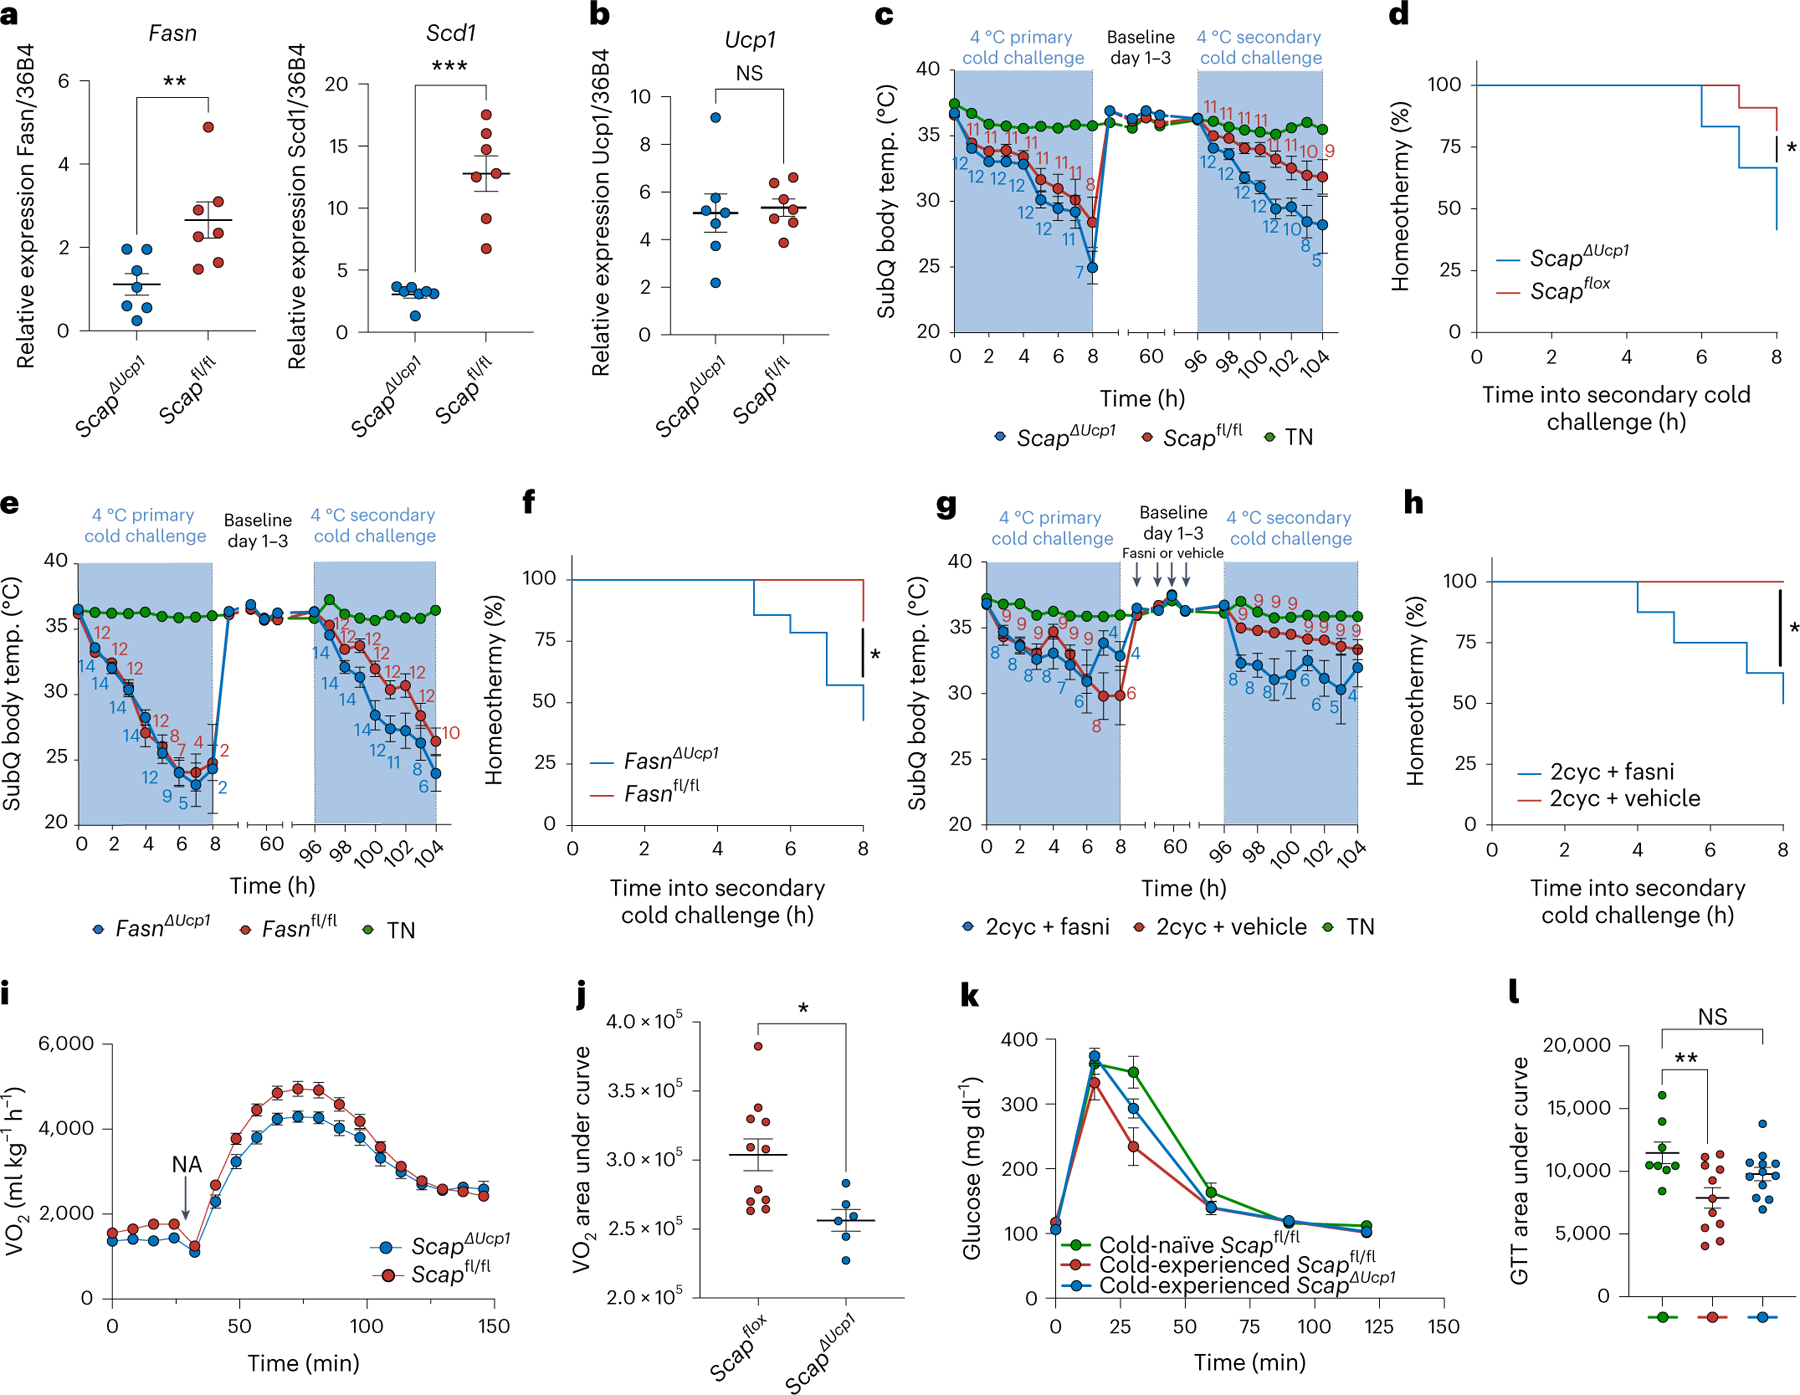
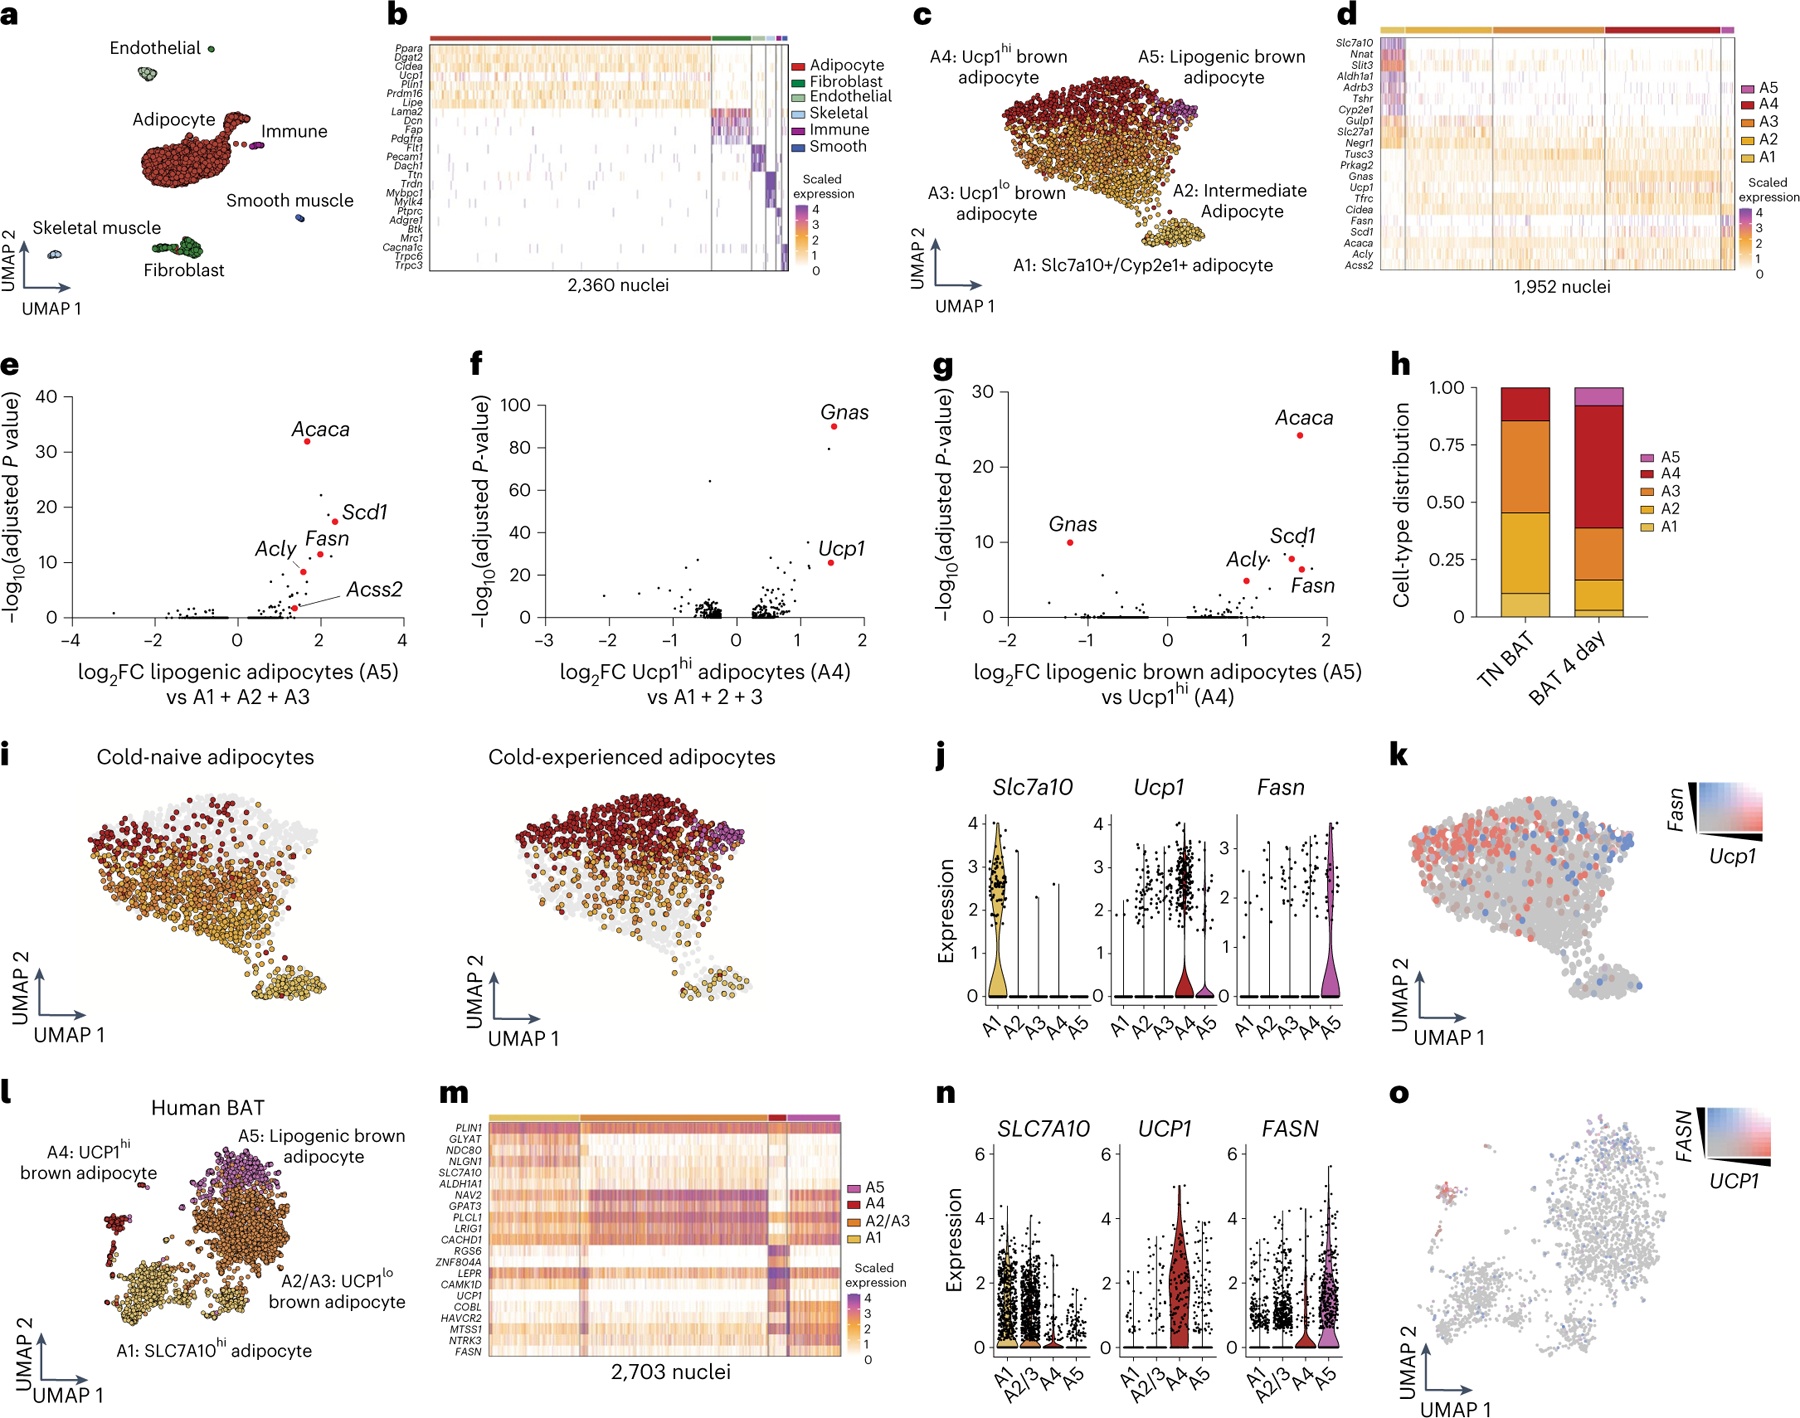
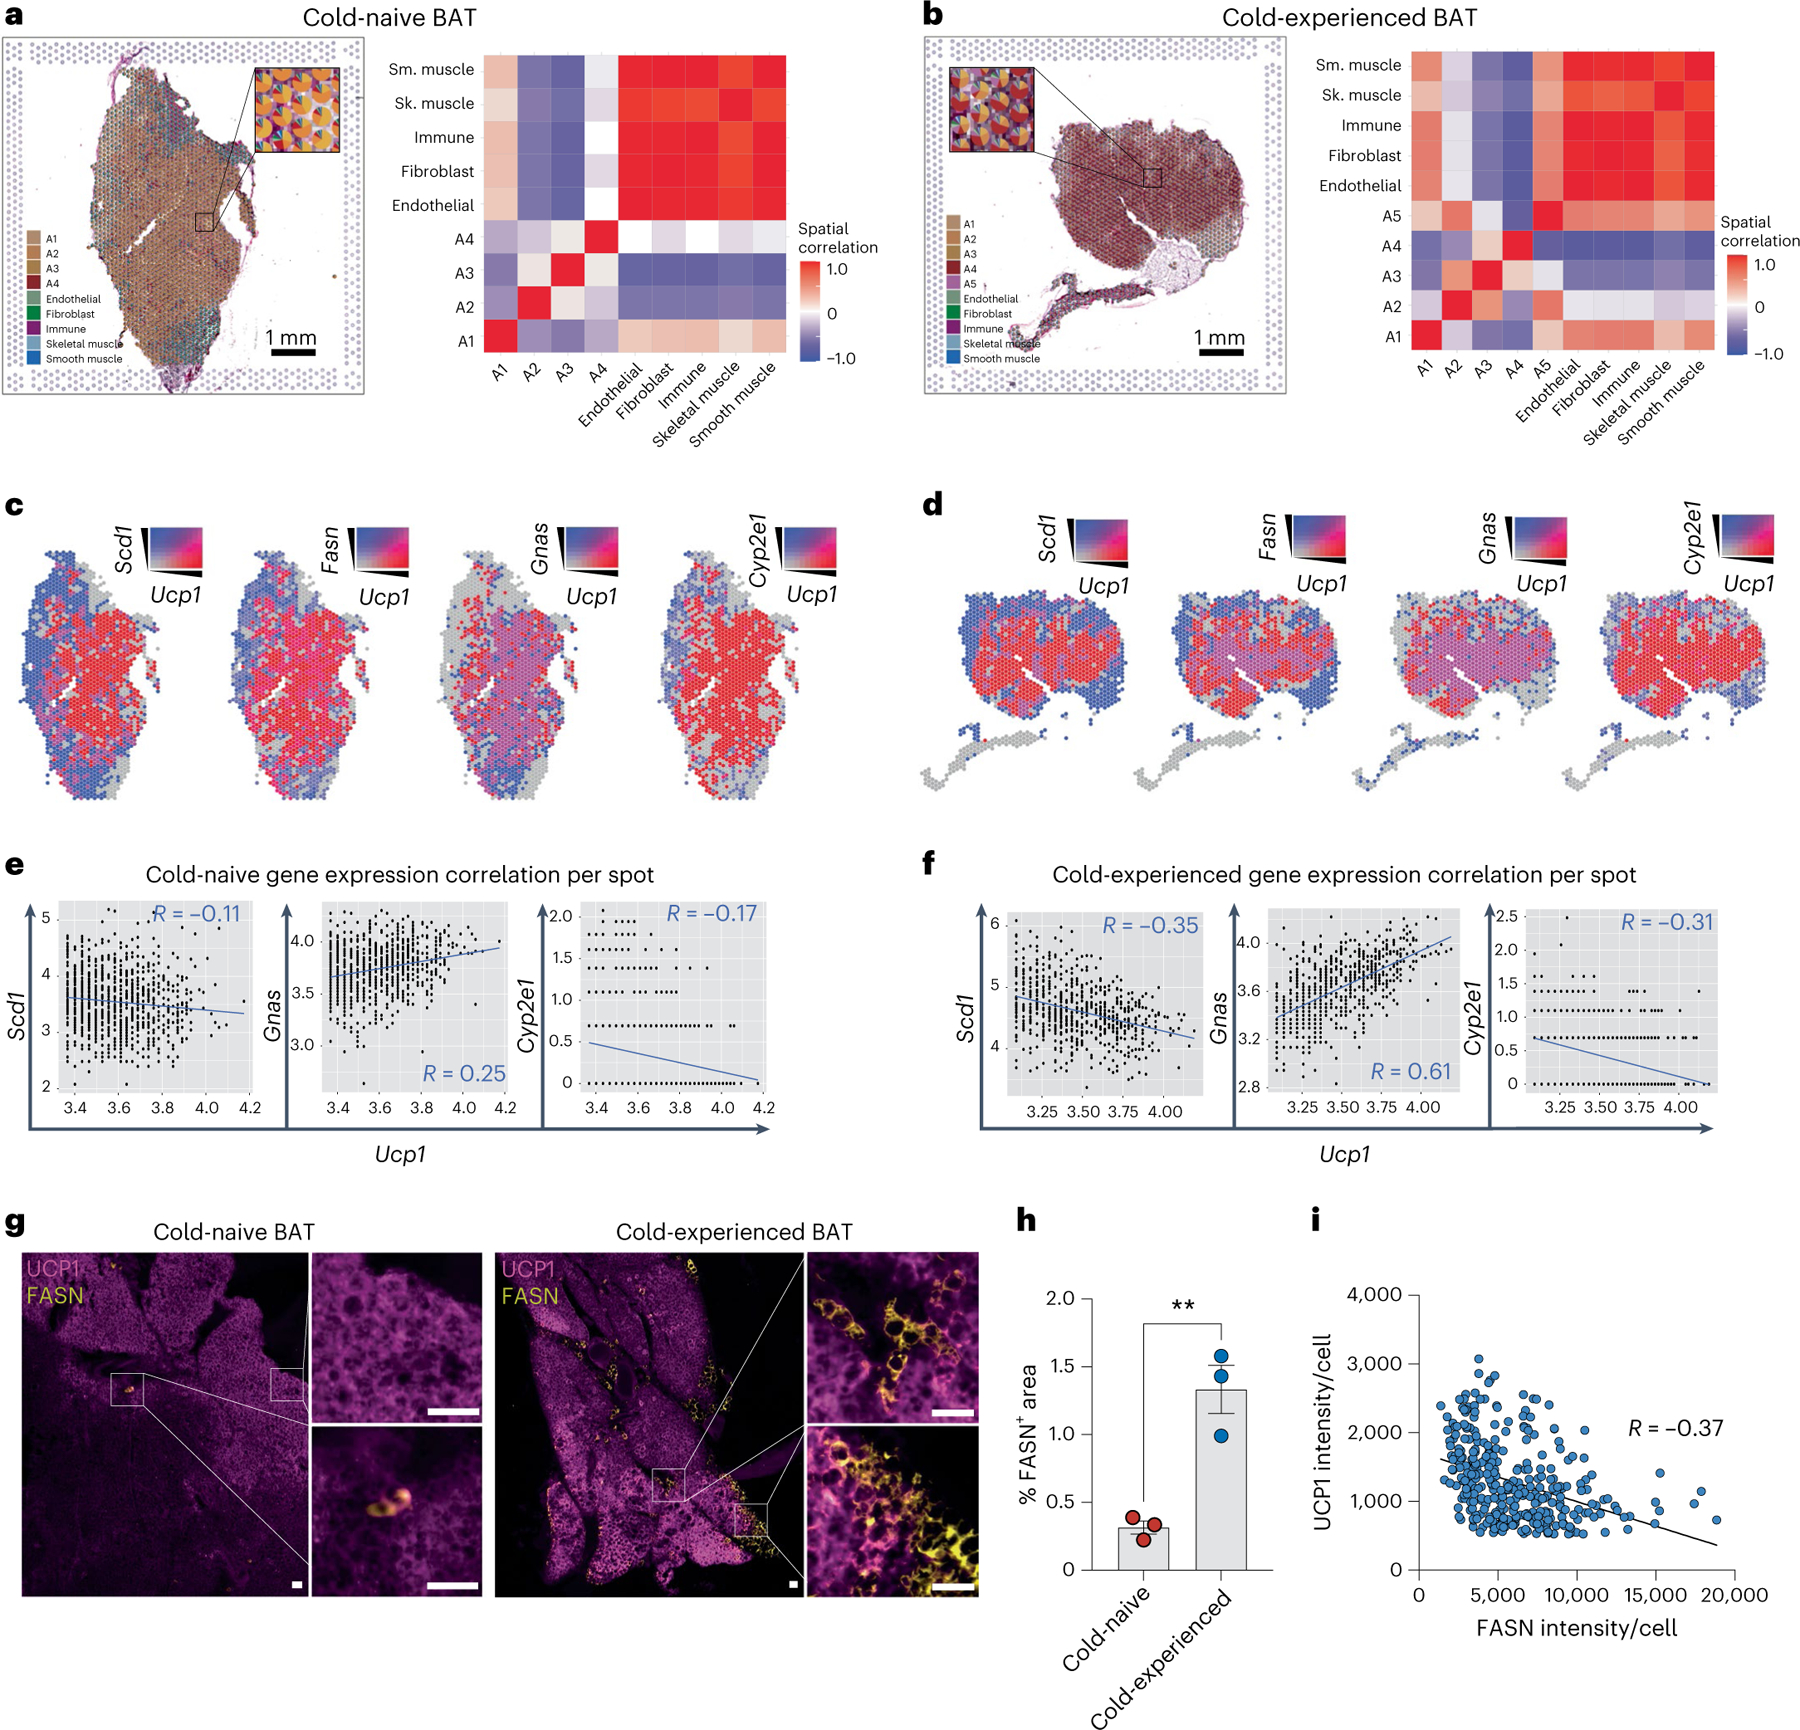
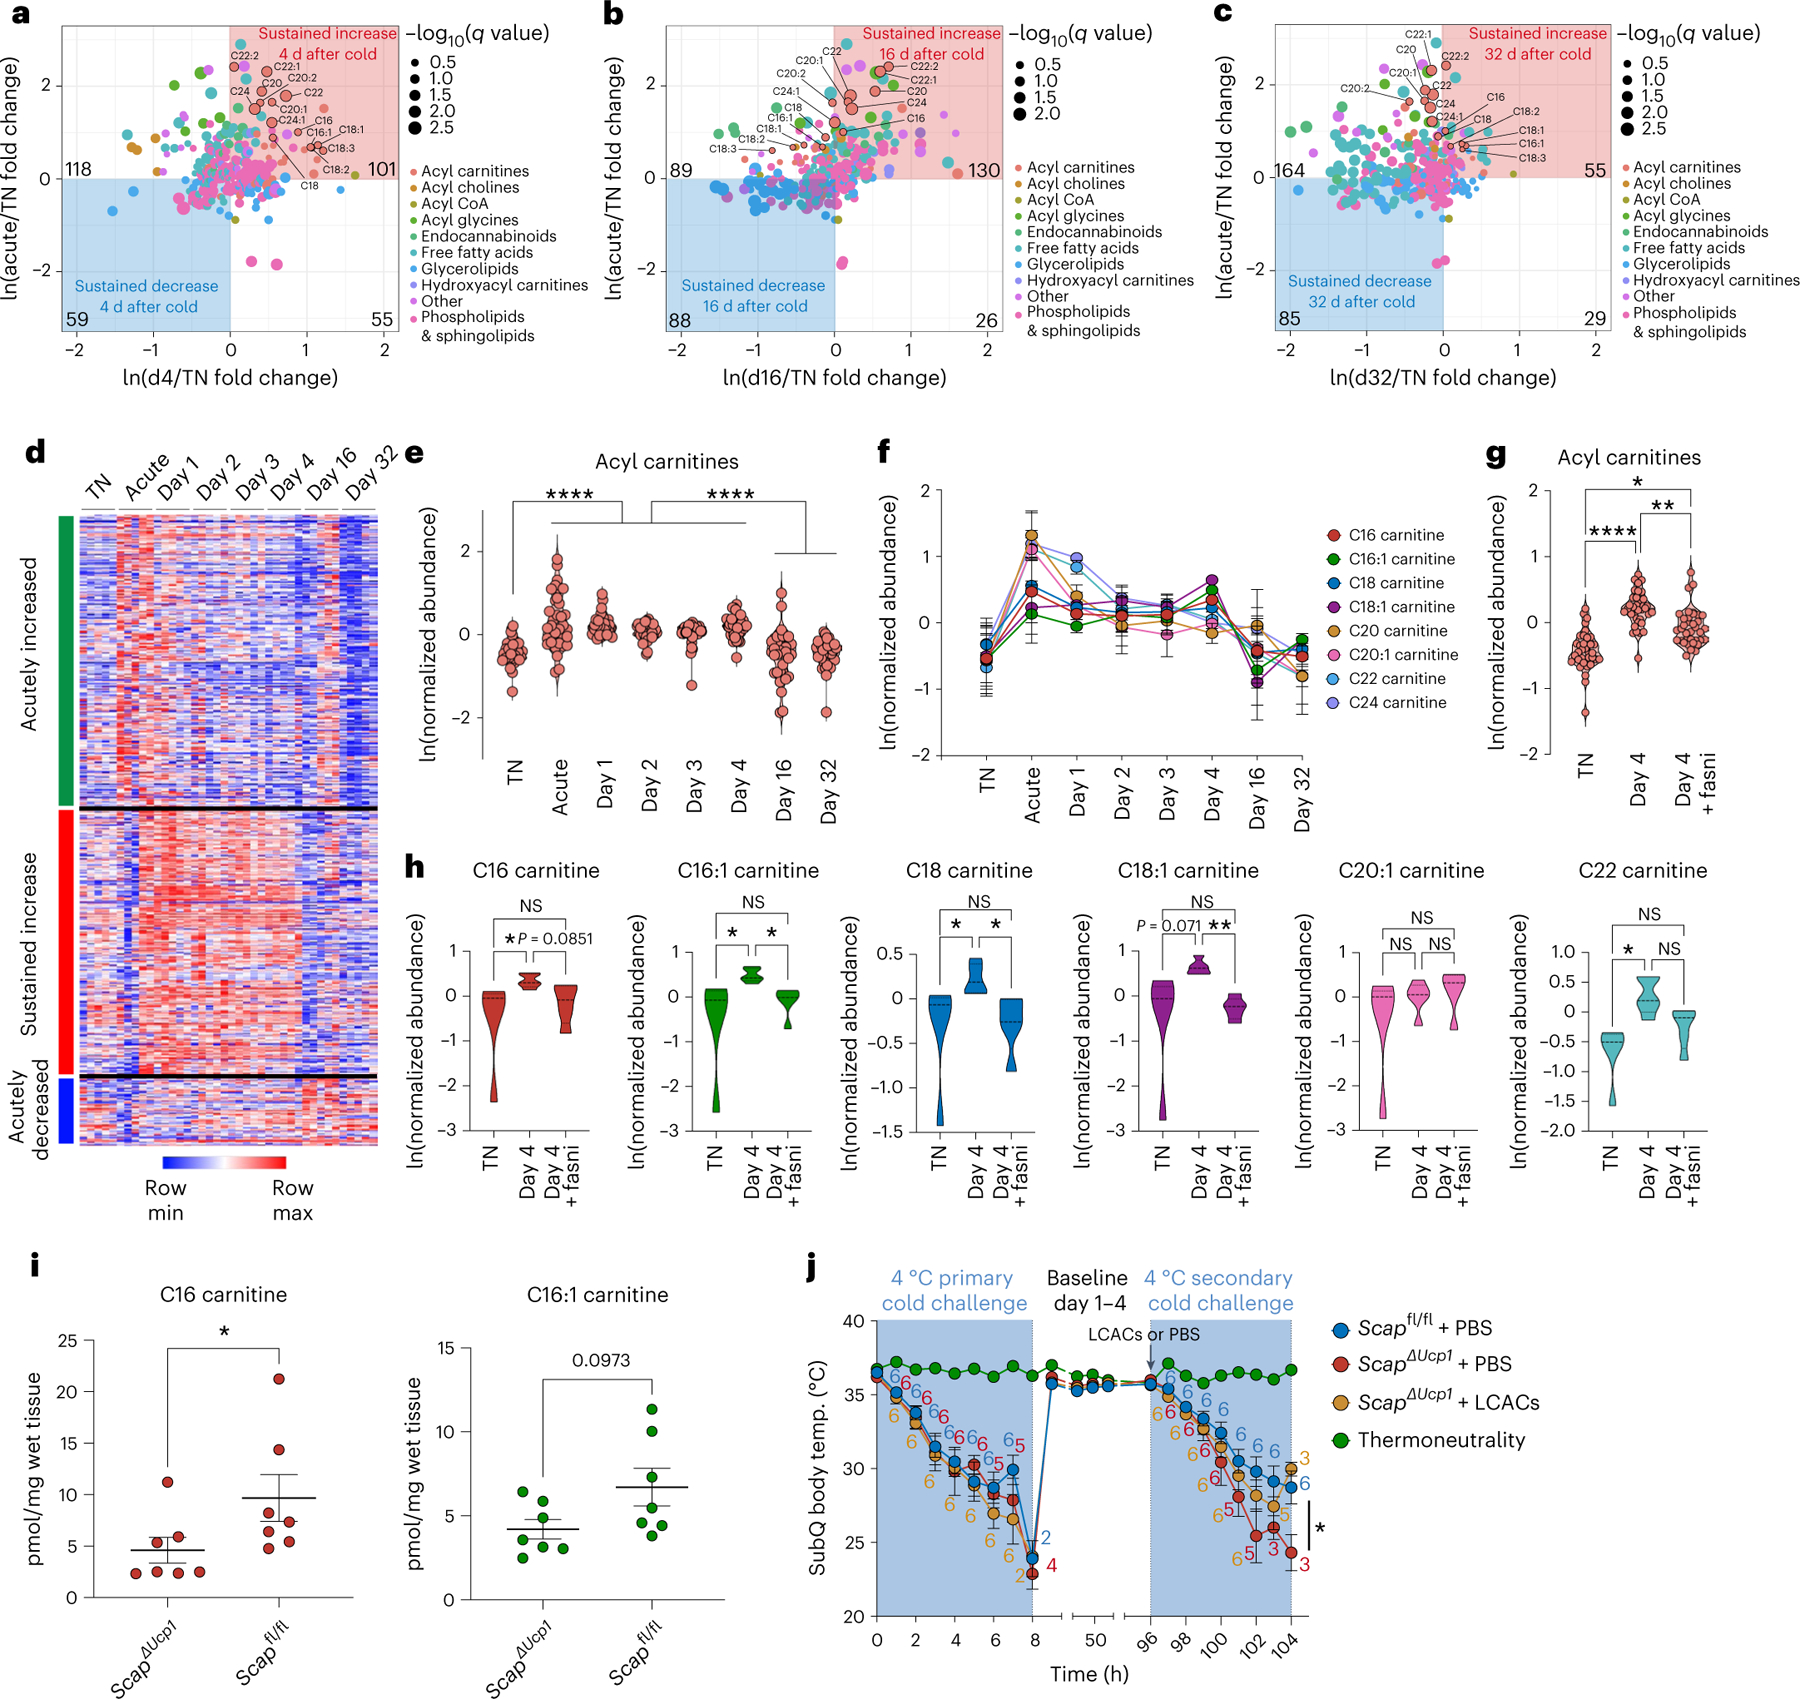
Sustained responses to transient environmental stimuli are important for survival. The mechanisms underlying long-term adaptations to temporary shifts in abiotic factors remain incompletely understood. Here, we find that transient cold exposure leads to sustained transcriptional and metabolic adaptations in brown adipose tissue, which improve thermogenic responses to secondary cold encounter. Primary thermogenic challenge triggers the delayed induction of a lipid biosynthesis programme even after cessation of the original stimulus, which protects from subsequent exposures. Single-nucleus RNA sequencing and spatial transcriptomics reveal that this response is driven by a lipogenic subpopulation of brown adipocytes localized along the perimeter of Ucp1hi adipocytes. This lipogenic programme is associated with the production of acylcarnitines, and supplementation of acylcarnitines is sufficient to recapitulate improved secondary cold responses. Overall, our data highlight the importance of heterogenous brown adipocyte populations for 'thermogenic memory', which may have therapeutic implications for leveraging short-term thermogenesis to counteract obesity.


Conflict of interest statement

Competing interests

The authors declare no competing interests.

Figures

Extended Data Fig. 1 |
Extended Data Fig. 1 |. Whole-body energy expenditure is increased in a secondary cold challenge 4 days after a primary cold challenge.
a, Whole-body energy expenditure over time in the primary cold challenge compared to secondary cold challenge of the same mice over time (n = 6 independent animals). b, Area under the curve (AUC) analysis of energy expenditure over time in primary and secondary cold challenge (9am-5pm). Error bars indicate means ± s.e.m. *, P < 0.05. Exact P values are presented in the source data file for Extended Data Fig. 1.
Extended Data Fig. 2 |
Extended Data Fig. 2 |. The transcriptional induction of lipid biosynthesis following a primary thermogenic response is specific to BAT.
a, Relative gene expression of Ucp1 in iWAT and BAT following transient cold exposure (n = 5 independent animals per condition, except iWAT Day 1 n = 4, iWAT Day 2 n = 2, and iWAT Day 4 n = 4). b, Relative gene expression of Fasn in iWAT and BAT following transient cold exposure (n = 5 independent animals per condition, except iWAT Day 1 n = 4, iWAT Day 2 n = 3, and iWAT Day 4 n = 4). c, Relative gene expression of Fasn in BAT, liver, and muscle from mice in their primary thermogenic response (1cyc) and secondary thermogenic response (2cyc) (n = 5 independent animals per condition). d, Western blot of FASN protein in BAT from cold-naïve mice compared to cold-experienced mice, and relative expression analysis compared to housekeeping gene (Vinculin) (n = 4 independent animals per condition). e, Western blot of UCP1 protein in BAT from cold-naïve mice compared to cold-experienced mice, and relative expression analysis compared to housekeeping gene (Tubulin) (n = 4 independent animals per condition). f, Representative H&E histology images of BAT from cold-naïve mice and cold-experienced mice 4 days after a transient cold exposure (n = 4 independent animals per condition), scale bar = 50μm. Error bars indicate means ± s.e.m. ns, not significant; *, P < 0.05; **, P < 0.01; ***, P < 0.001; ****, P < 0.0001. Exact P values are presented in the source data file for Extended Data Fig. 2.
Extended Data Fig. 3 |
Extended Data Fig. 3 |. Workflow and validation of nuclei isolation from BAT.
a, Workflow schematic. b, Nuclei sorting strategy using DAPI positivity, including a re-sort validation experiment. c, Inspection and counting of nuclei quality on haemocytometer.
Extended Data Fig. 4 |
Extended Data Fig. 4 |. Single-nucleus RNA-sequencing of brown adipose tissue resolves cell types and adipocyte subpopulations.
a, Expression of canonical marker genes of cell types identified by BAT snRNAseq. b-c, UMAP plots of cell types separated by cold-naïve BAT (b) and cold-experienced BAT (4 days following transient acute cold) (c). d, Cell type distributions separated by condition. e, Feature plots for Fasn, Ucp1, and Cpt2 expression within the adipocyte population. f, Dot plot for Slc7a10, Ucp1, and Fasn expression across five identified adipocyte subpopulations (A1-A5).
Extended Data Fig. 5 |
Extended Data Fig. 5 |. Cell type distributions in spatial transcriptomics data and snRNAseq data.
a, b, Cell type distributions quantified in spatial transcriptomics data (a) and snRNAseq data (b). c, Violin plots for the expression of indicated genes across all spots in each condition from BAT spatial transcriptomics data.
Extended Data Fig. 6 |
Extended Data Fig. 6 |. Total free fatty acids, glycerolipids, or phospholipids & sphingolipids in brown adipose tissue following a primary thermogenic response.
a-d, Relative abundance and distribution of free fatty acids (a), glycerolipids (b), and phospholipid & sphingolipid (c) species in BAT in different experimental conditions. Data presented in panels a-d is based on metabolomics from n = 5 independent animals per condition. Each data point represents the average value across replicates for each species. d, Comparison of indicated lipid metabolite species in BAT between TN, day 4, and day 4 with Fasn inhibition (Fasni). Each data point represents the average value across replicates for each species. Error bars indicate means ± s.e.m. ns, not significant; *, P < 0.05; ***, P < 0.001; ****, P < 0.0001. Exact P values are presented in the source data file for Extended Data Fig. 6.
Extended Data Fig. 7 |
Extended Data Fig. 7 |. Scap knockout in brown adipocytes does not affect the expression of genes involved in acylcarnitine transport or fatty acid oxidation.
a-c, Relative gene expression of Cact (a), Lcad (b), and Mcad (c) in brown adipose tissue from ScapΔUcp1 (n = 7 independent animals) and Scapflox mice (n = 7 independent animals) 4 days after primary cold exposure. Error bars indicate means ± s.e.m. ns, not significant. Exact P values are presented in the source data file for Extended Data Fig. 7.
Fig. 1 |
Fig. 1 |. Enhanced secondary thermogenic response to acute cold.
a, Schematic of experimental setup. 2cyc denotes the experimental group undergoing both a primary and secondary cold exposure. 1cyc is a cold-naïve control group for each secondary cold challenge. bf, Effect of transient acute cold exposure on a secondary thermogenic response to acute cold following thermoneutral housing for 4 d (b and c), 8 d (d), 16 d (e) or 32 d (f) between primary and secondary acute cold exposure (n = 10 independent animals for each condition, except for thermoneutral baseline n = 5). g,h, Effect of BATectomy (g; n = 5 independent animals for each condition) and UCP1 knockout (h; n = 5 independent animals for 2cyc, n = 6 for 1cyc) on the enhanced secondary thermogenic response 4 d following a primary thermogenic response. Data in b and dh show subcutaneous (SubQ) body temperature during cold exposure. Animals with subcutaneous body temperature below 20 °C were removed from cold. Counts indicate the numbers of animals analysed at each time point. Data in c show the percentage of animals maintaining subcutaneous body temperature above 20 °C in secondary cold challenge based on data in b. Error bars indicate means ± s.e.m. *P < 0.05.
Fig. 2 |
Fig. 2 |. A primary thermogenic response leads to delayed induction of a lipid biosynthesis programme in brown adipose tissue independent of sustained cold exposure.
a, Experimental schematic for the transcriptional profiling of BAT in mice exposed to acute cold followed by thermoneutral conditions for different time durations including a thermoneutral baseline comparison (n = 5 independent animals for each condition, except for thermoneutral baseline n = 4). b, Principal component analysis of RNA-seq results (left) and Euclidean distances between the average of thermoneutrality samples and every other sample in unfiltered feature space (right). c,d, Heat map (c) and line graphs (d) show the log-transformed counts per million across different time points. K-means clustering was used to classify the temporal patterns of differentially expressed genes to six clusters, of which (1) acutely increased (green), (2) delayed increase (yellow) and (3) sustained increase (orange) clusters are shown. e, Gene Ontology analysis (Enrichr) for gene sets in each cluster. f, Representative differentially expressed genes from each cluster. g,h, Analysis of differentially expressed genes from specific time points relative to thermoneutrality are shown in volcano plots, with highlighted genes involved in DNL. Error bars indicate means ± s.e.m. NS, not significant; *P < 0.05; **P < 0.01; ***P < 0.001; ****P < 0.0001.
Fig. 3 |
Fig. 3 |. Lipogenic brown adipocytes promote the improved secondary thermogenic response to acute cold.
a,b, Relative gene expression of Fasn and Scd1 (a) and Ucp1 (b) in BAT from ScapΔUcp1 and Scapfl/fl mice 4 d after transient primary cold exposure (n = 7 independent animals for each condition). c,d, Effect of Scap ablation in brown adipocytes on a primary and secondary thermogenic response to acute cold interleaved with thermoneutral housing for 4 d between primary and secondary acute cold exposure (n = 12 for ScapΔUcp1, n = 11 for Scapfl/fl, n = 5 for TN). e,f, Effect of Fasn ablation in brown adipocytes on a primary and secondary thermogenic response to acute cold interleaved with thermoneutral housing for 4 d between primary and secondary acute cold exposure (n = 14 for FasnΔUcp1, n = 12 for Fasnfl/fl, n = 5 for TN). g,h, Effect of pharmacological inhibition of Fasn after a primary thermogenic response on a secondary thermogenic response to acute cold interleaved with thermoneutral housing for 4 d between primary and secondary acute cold exposure (n = 8 for 2cyc + Fasn inhibition (Fasni), n = 9 for 2cyc + vehicle, n = 4 for TN). Data in c, e and g show subcutaneous body temperature during cold exposure. Animals with subcutaneous body temperature below 20 °C were removed from cold. Counts indicate the numbers of animals analysed at each time point. Data in d, f and h show the percentage of animals maintaining subcutaneous body temperature above 20 °C in the secondary cold response. i,j, Oxygen consumption rates of anaesthetized ScapΔUcp1 (n = 6) and Scapfl/fl (n = 11) mice after injection of noradrenaline (NA) (i), with calculated area under the curve (j). k,l, Blood glucose during glucose tolerance test (GTT) of ScapΔUcp1 mice (n = 11) and Scapfl/fl mice (n = 10) 4 d after primary thermogenic challenge, including cold-naive mice housed at thermoneutrality (n = 8; k), with calculated area under the curve (l). Error bars indicate means ± s.e.m. *P < 0.05; **P < 0.01; ***P < 0.001.
Fig. 4 |
Fig. 4 |. A primary thermogenic response induces a subpopulation of lipogenic brown adipocytes.
a, Uniform manifold approximation and projection (UMAP) embedding of 2,360 single nuclei isolated from BAT of cold-experienced mice and cold-naïve mice housed at thermoneutrality. Six cell types are labelled based on canonical candidate markers. b, Heat map of top genes expressed in each cell type revealed by snRNA-seq of BAT. c, Unsupervised clustering of only the adipocyte population in BAT yielded five subpopulations (A1, Slc7a10+/Cyp2e1+; A2, intermediate adipocyte; A3, Ucp1lo brown adipocyte; A4, Ucp1hi brown adipocyte; A5, lipogenic brown adipocyte) across both thermoneutral and cold-experienced conditions based on gene expression. d, Heat map of gene expression in each nucleus across the five subpopulations of adipocytes identified in BAT. eg, Differentially expressed genes represented as volcano plots between: lipogenic brown adipocytes and subpopulations A1–A3 (e), Ucp1hi adipocytes and subpopulations A1–A3 (f) and lipogenic brown adipocytes and Ucp1hi (g). h, Cell-type distributions by adipocyte subpopulation A1–A5 in different conditions. i, UMAP plots of the adipocytes separated by cold-naïve and cold-experienced conditions. j, Violin plots for relative expression of Slc7a10, Ucp1 and Fasn across the identified subpopulations of adipocytes in mouse BAT. k, Feature plot for Fasn and Ucp1 expression within the adipocyte population. lo, snRNA-seq of human deep-neck BAT. l, UMAP embedding and unsupervised clustering of 2,703 adipocyte nuclei from human BAT. Within the adipocyte subset, four subpopulations were identified that resembled the subpopulations identified in mouse BAT (A1, SLC7A10+; A2/A3, UCP1lo brown adipocyte; A4, UCP1hi brown adipocyte; A5, lipogenic brown adipocyte. m, Heat map with representative gene expression across the four subpopulations of adipocytes in human BAT. n, Violin plots for relative expression of SLC7A10, UCP1 and FASN across the identified subpopulations of adipocytes in human BAT. o, Feature plot for FASN and UCP1 expression within the adipocyte population from human BAT.
Fig. 5 |
Fig. 5 |. Lipogenic brown adipocytes show distinct spatial tissue patterns in brown adipose tissue following a primary thermogenic response.
ag, Spatial transcriptomics of BAT from cold-naïve and cold-experienced mice housed at thermoneutrality. a,b, Scatter pie plot with each spot in the cold-naïve (a) and cold-experienced (b) BAT section coloured according to the cell-type proportions estimated by SpaDecon (left); the cell-type-level spatial correlation heat map was constructed using the SpaDecon estimated cell-type proportions across all spots in the cold-naïve BAT section (right). c, Spatial feature plot of Ucp1 with Scd1, Fasn, Gnas and Cyp2e1 in the cold-naïve BAT section. d, Spatial feature plot of Ucp1 with Scd1, Fasn, Gnas and Cyp2e1 in the cold-experienced BAT section. e, Quantification of gene expression correlation between Scd1, Gnas and Cyp2e1 per spot with Ucp1 expression above the 50th percentile for the cold-naïve BAT section. f, Quantification of gene expression correlation between Scd1, Gnas and Cyp2e1 per spot with Ucp1 expression above the 50th percentile for the cold-experienced BAT section. gi, Immunofluorescence of Ucp1 and Fasn in BAT sections of cold-naïve and cold-experienced mice. g, Representative images from each condition. Scale bar, 50 μm. h, Quantification of Fasn+ area across the two conditions (n = 3 biological replicates per condition, with 2–3 technical replicates per biological replicate). i, Quantification of UCP1 and FASN intensity in single brown adipocytes from immunofluorescence analysis of cold-experienced BAT. Error bars indicate means ± s.e.m. **P < 0.01. R values were calculated by Pearson’s correlation.
Fig. 6 |
Fig. 6 |. A primary thermogenic response results in lipogenesis-driven sustained elevation of acylcarnitines in brown adipose tissue.
ah, Analysis of differentially abundant metabolites in BAT by untargeted metabolomics in mice exposed to acute cold followed by thermoneutral conditions for different times, including a thermoneutral (TN) baseline comparison (n = 5 independent animals for each condition in ah). a, Comparison of relative abundances of lipid metabolites in acutely cold-exposed BAT (acute), day 4 after transient cold BAT (d4) and TN BAT. b, Comparison of relative abundances of lipid metabolites in acute BAT, day 16 after transient cold BAT (d16) and TN BAT. c, Comparison of relative abundances of lipid metabolites in acute BAT, day 32 after transient cold BAT (d32) and TN BAT. For ac, the dot size reflects the −log10(q value) of the most significant comparison of d4/TN and acute/TN for the given metabolite. Colours of dot reflects type of lipid metabolite. Long-chain acylcarnitines (LCACs) are highlighted. d, Heat map depicting temporal patterns of relative metabolite abundances in BAT following cold challenge. e, Relative abundance of acylcarnitine species in BAT in different experimental conditions. Each data point represents the average value across replicates for each acylcarnitine species. f, Plot of average abundance of indicated LCACs in BAT from different experimental conditions. g, Comparison of total acylcarnitine species in BAT between TN, day 4 and day 4 with Fasni. Each data point represents one species. h, Comparison of indicated LCACs in BAT between TN, day 4 and day 4 with Fasni. i, Absolute measurements of C16 carnitine and C16:1 carnitine in BAT in ScapΔUcp1 mice (n = 7) versus Scapfl/fl mice (n = 7) 4 d following primary thermogenic challenge. j, Subcutaneous body temperature during primary and secondary cold exposure of ScapΔUcp1 mice treated with PBS or LCACs at the start of secondary cold exposure, including Scapfl/fl mice treated with PBS (n = 6 independent animals for each condition). Error bars indicate means ± s.e.m. *P < 0.05; **P < 0.01; ****P < 0.0001.

References

    1. Farber DL, Netea MG, Radbruch A, Rajewsky K & Zinkernagel RM Immunological memory: lessons from the past and a look to the future. Nat. Rev. Immunol 16, 124–128 (2016). - PubMed
    1. Netea MG et al. Defining trained immunity and its role in health and disease. Nat. Rev. Immunol 20, 375–388 (2020). - PMC - PubMed
    1. Josselyn SA, Köhler S & Frankland PW Finding the engram. Nat. Rev. Neurosci 16, 521–534 (2015). - PubMed
    1. Kandel ER, Dudai Y & Mayford MR The molecular and systems biology of memory. Cell 157, 163–186 (2014). - PubMed
    1. Naik S et al. Inflammatory memory sensitizes skin epithelial stem cells to tissue damage. Nature 550, 475–480 (2017). - PMC - PubMed

MeSH terms