Clinical Trial
. 2023 Nov;29(11):2825-2834.
doi: 10.1038/s41591-023-02568-1. Epub 2023 Oct 2.

Gemcitabine and cisplatin plus nivolumab as organ-sparing treatment for muscle-invasive bladder cancer: a phase 2 trial

Affiliations
Clinical Trial

Gemcitabine and cisplatin plus nivolumab as organ-sparing treatment for muscle-invasive bladder cancer: a phase 2 trial

Matthew D Galsky et al. Nat Med. 2023 Nov.

Erratum in

  • Author Correction: Gemcitabine and cisplatin plus nivolumab as organ-sparing treatment for muscle-invasive bladder cancer: a phase 2 trial.
    Galsky MD, Daneshmand S, Izadmehr S, Gonzalez-Kozlova E, Chan KG, Lewis S, Achkar BE, Dorff TB, Cetnar JP, Neil BO, D'Souza A, Mamtani R, Kyriakopoulos C, Jun T, Gogerly-Moragoda M, Brody R, Xie H, Nie K, Kelly G, Horowitz A, Kinoshita Y, Ellis E, Nose Y, Ioannou G, Cabal R, Del Valle DM, Haines GK, Wang L, Mouw KW, Samstein RM, Mehrazin R, Bhardwaj N, Yu M, Zhao Q, Kim-Schulze S, Sebra R, Zhu J, Gnjatic S, Sfakianos J, Pal SK. Galsky MD, et al. Nat Med. 2024 Apr;30(4):1211. doi: 10.1038/s41591-024-02814-0. Nat Med. 2024. PMID: 38242983 Free PMC article. No abstract available.

Abstract

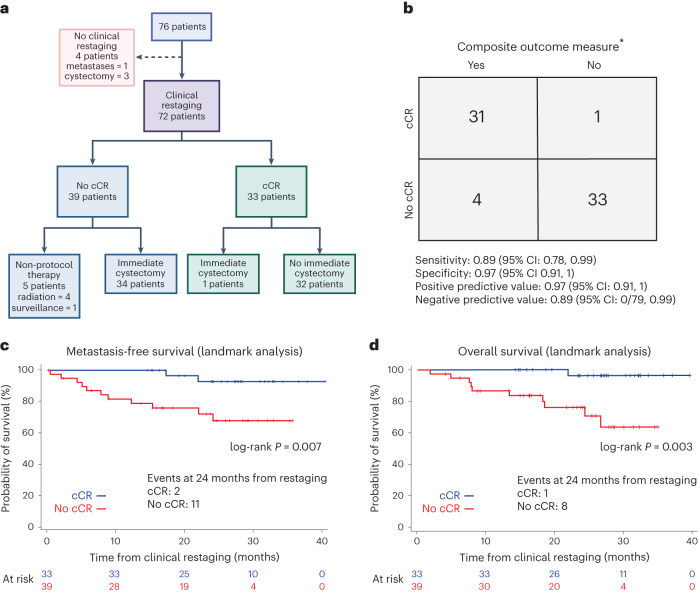
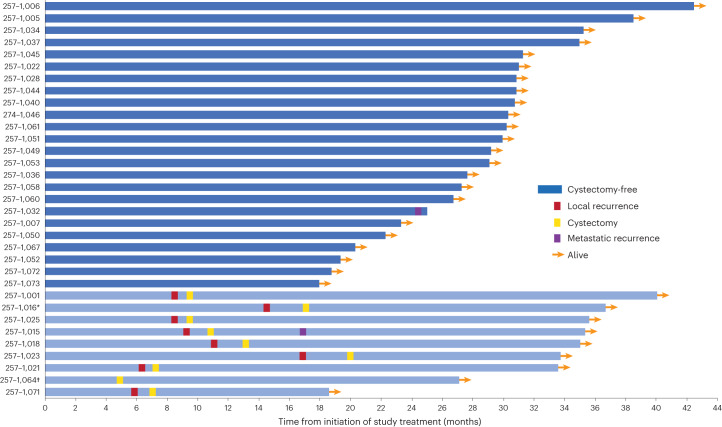
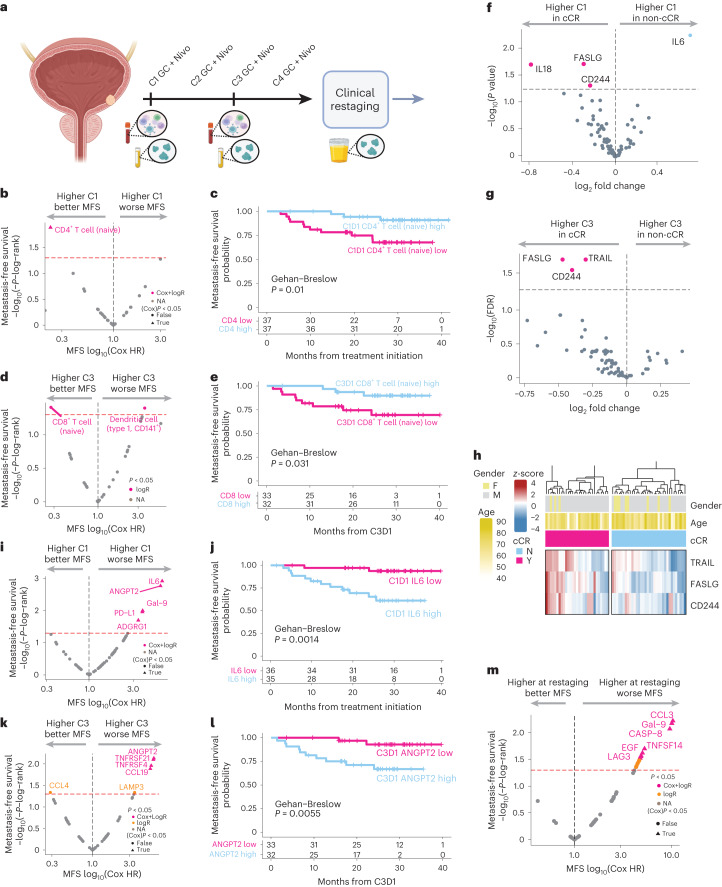
Cystectomy is a standard treatment for muscle-invasive bladder cancer (MIBC), but it is life-altering. We initiated a phase 2 study in which patients with MIBC received four cycles of gemcitabine, cisplatin, plus nivolumab followed by clinical restaging. Patients achieving a clinical complete response (cCR) could proceed without cystectomy. The co-primary objectives were to assess the cCR rate and the positive predictive value of cCR for a composite outcome: 2-year metastasis-free survival in patients forgoing immediate cystectomy or <ypT1N0 in patients electing immediate cystectomy. Seventy-six patients were enrolled; of these, 33 achieved a cCR (43%, 95% confidence interval (CI): 32%, 55%), and 32 of 33 who achieved a cCR opted to forgo immediate cystectomy. The positive predictive value of cCR was 0.97 (95% CI: 0.91, 1), meeting the co-primary objective. The most common adverse events were fatigue, anemia, neutropenia and nausea. Somatic alterations in pre-specified genes (ATM, RB1, FANCC and ERCC2) or increased tumor mutational burden did not improve the positive predictive value of cCR. Exploratory analyses of peripheral blood mass cytometry and soluble protein analytes demonstrated an association between the baseline and on-treatment immune contexture with clinical outcomes. Stringently defined cCR after gemcitabine, cisplatin, plus nivolumab facilitated bladder sparing and warrants further study. ClinicalTrials.gov identifier: NCT03451331 .


Conflict of interest statement

M.D.G. has received research funding from Bristol Myers Squibb, Novartis, Dendreon, AstraZeneca, Merck and Genentech. He has served as a consultant to Bristol Myers Squibb, Merck, Genentech, AstraZeneca, Pfizer, EMD Serono, SeaGen, Janssen, Numab, Dragonfly, GlaxoSmithKline, Basilea, UroGen, Rappta Therapeutics, Alligator, Silverback, Fujifilm, Curis, Gilead, Bicycle, Asieris, Abbvie and Analog Devices. S.D. has served as a consultant to Janssen, Ferring, Photocure, Taris, Pacific Edge, QED, Abbvie, Janssen, Bristol Myers Squibb, Sesen, Protara, Pfizer and CG Oncology. T.B.D. has served as a consultant to Astellas, AstraZeneca, Bayer, Janssen and Sanofi. R.M. has served as a consultant to Bristol Myers Squibb, Roche, Astellas and Seattle Genetics and has received research funding from Merck and Astellas. C.K. has served as a consultant to Exelixis, Sanofi, AVEO, EMD Serono and Janssen and has received research funding from Sanofi, Gilead Sciences, AstraZeneca, ESSA Pharma, Pionyr and Incyte. He owns stock in Biogen and Epic Systems. T.J. is an employee of Genentech. A.H. has served as a consultant to HTG Molecular Diagnostics and Immunorizon. L.W. is an employee of GeneDx. K.W.M. has served as a consultant to EMD Serono, Pfizer, UroGen and Riva Therapeutics, has received research support from Pfizer and Novo Ventures, has equity in Riva Therapeutics, has received writing fees from UpToDate and has received speaking fees from OncLive. He is named on an institutional patent filed on mutational signatures of DNA repair deficiency. N.B. has served as a consultant to Apricity, BreakBio, Carisma Therapeutics, CureVac, Genetech, Novartis, Primevax, Tempest Therapeutics, Dragonfly Therapeutics, BioNTech, Genotwin and Rome Therapeutics. She has received research support from Harbour Biomed Sciences and Regeneron. J.Z. is an employee of GeneDx. S.G. received research funding from Boehringer Ingelheim, Bristol Myers Squibb, Celgene, Genentech, Regeneron and Takeda. J.S. has served as a consultant or advisor for Natera, Pacific Edge, Merck, Urogen and Janssen. S.K.P. has received travel support form CRISPR Therapeutics and Ipsen. All remaining authors declare no competing interests.

Figures

Fig. 1
Fig. 1. Study design and primary objectives of HCRN GU16-257.
a, CONSORT diagram outlining disposition of patients enrolled on HCRN GU16-257 and demonstrating co-primary objective of estimating the cCR rate. b, Contingency table informing co-primary objective of assessing the positive predictive value of cCR for the composite outcome measure of 2-year metastasis-free survival in patients forgoing immediate cystectomy or <ypT1N0 in patients undergoing immediate cystectomy (n = 69 of 76 total patients). Seven patients were excluded for the following reasons: four patients who did not undergo clinical response assessment; two patients who did not achieve a cCR, who did not pursue cystectomy and who were lost to follow-up before 2 years; and one patient who achieved a cCR and without evidence of local or distant recurrence at 18 months and who was subsequently lost to follow-up. c, Metastasis-free survival according to cCR versus no cCR using landmark timepoint of post-cycle 4 restaging (n = 72; four patients were excluded who did not undergo clinical response assessment). Estimating metastasis-free survival was a secondary objective of the study. d, Overall survival according to cCR versus no cCR using landmark timepoint of post-cycle 4 restaging (n = 72; four patients were excluded who did not undergo clinical response assessment). Estimating overall survival was a secondary objective of the study. a and b were created with BioRender. *Composite outcome measure: 2-year metastasis-free survival in patients forgoing immediate cystectomy or <ypT1N0 in patients undergoing immediate cystectomy.
Fig. 2
Fig. 2. Clinical outcomes of patients enrolled on HCRN GU16-257 achieving a cCR.
* Patient underwent cystectomy for radiographic changes concerning for local recurrence without evidence of cancer on biopsy or final cystectomy specimen. † Patient opted for immediate cystectomy.
Fig. 3
Fig. 3. Genomic alterations in pre-treatment tumor tissue and association with clinical outcomes.
Oncoplot revealing frequently mutated genes based on DNA sequencing of pre-treatment transurethral resection of bladder tumor specimens among 73 patients. Oncoplot is arranged according to TMB (Methods) and annotated based on the presence or absence of a mutation in a pre-specified set of genes (RB1, ATM, ERCC2 and FANCC), referred to as ‘Signature_mutations’ and according to cCR categorization. Mutations are annotated: del, deletion; ins, insertion.
Fig. 4
Fig. 4. Association between peripheral blood immune populations as determined by mass cytometry (CyTOF) or peripheral blood or urine protein analytes and cCR or metastasis-free survival.
a, Timing of sample collection. b, Volcano plot for metastasis-free survival (MFS) based on C1D1 peripheral blood CyTOF data (n = 74; patients without samples or outcome data were excluded) showing log-rank test (y axis) and Cox regression hazard ratio (x axis). c, Kaplan–Meier curves for CD4+ naive T cells on C1D1 with Gehan–Breslow P values. d, Volcano plot for MFS based on C3D1 peripheral blood CyTOF data (n = 65; patients without samples or outcome data were excluded) showing log-rank test (y axis) and Cox regression hazard ratio (x axis). e, Kaplan–Meier curves with Gehan–Breslow P values for CD8+ naive T cells at C3D1. f, Volcano plot showing the differential expression of peripheral blood proteins on C1D1 (n = 71; patients without samples or outcome data were excluded) according to cCR status (−log10(P value) in x axis and log2 fold change calculated using moderated t-statistic). g, Volcano plot showing the differential expression of peripheral blood proteins on C3D1 (n = 65; patients without samples or outcome data were excluded) according to cCR status (−log10(P value) in x axis and log2 fold change calculated using moderated t-statistic). h, Heat map showing the normalized expression (z-score) for peripheral blood proteins increased on C3D1 according to cCR status (hierarchically clustered using Ward’s algorithm). i, Volcano plot for MFS based on C1D1 expression of proteins showing log-rank test (y axis) and Cox regression hazard ratio (x axis). j, Kaplan–Meier curves for IL6 expression at C1D1 with Gehan–Breslow P values. k, Volcano plot for MFS based on C3D1 protein expression showing log-rank test (y axis) and Cox regression hazard ratio (x axis). l, Kaplan–Meier curves for ANGPT2 expression at C3D1 with Gehan–Breslow P values. m, Volcano plot for MFS based on urine proteins at time of clinical restaging (n = 59, patients without samples or outcome data were excluded) showing log-rank test (y axis) and Cox regression hazard ratio (x axis). For associations with cCR, adjustment for multiple comparisons was performed using the Benjamini–Hochberg method. a was created with BioRender. FDR, false discovery rate; HR, hazard ratio; Nivo, nivolumab; NA, not applicable.
Extended Data Fig. 1
Extended Data Fig. 1. Schematic representation of the design of HCRN GU16-257.
Patients with muscle-invasive urothelial cancer of the bladder diagnosed based on standard of care TURBT (transurethral resection of bladder tumor) received four cycles of gemcitabine, cisplatin, plus nivolumab followed by clinical restaging consisting of cystoscopy with biopsies, urine cytology, and imaging including MRI (magnetic resonance imaging) of the bladder (or computed tomography scan if MRI was contraindicated). Patients achieving a clinical complete response (cCR) were offered the option to proceed with immediate cystectomy versus proceed without cystectomy and receive an additional 4 months of single-agent nivolumab followed by surveillance. Patients without a cCR were recommended to undergo immediate cystectomy. The primary objectives were to estimate the cCR rate and to assess the positive predictive value (PPV) of cCR for a composite outcome measure (MFS, metastasis-free survival). *Patients achieving a clinical CR were offered the option to forgo cystectomy or proceed with immediate cystectomy.
Extended Data Fig. 2
Extended Data Fig. 2. Vesical Imaging-Reporting And Data System (VI-RADS) scoring of bladder magnetic resonance imaging (MRI) post-treatment with gemcitabine, cisplatin, plus nivolumab and association with clinical outcomes.
(a) Representative baseline image demonstrating posterior bladder wall mass and post- gemcitabine, cisplatin, plus nivolumab MRI sequences scored as VI-RADS 1. (b) Representative baseline image demonstrating posterior bladder wall mass and post- gemcitabine, cisplatin, plus nivolumab MRI sequences scored as VI-RADS 5. (c) Distribution of VI-RADS scores on MRI of the bladder post- gemcitabine, cisplatin, plus nivolumab (n = 50). (d) Landmark analysis for metastasis-free survival in study cohort with available restaging MRI scans (n = 50) according to VI-RADS 1-2 versus 3–5.
Extended Data Fig. 3
Extended Data Fig. 3. Relationship between PD-L1 immunohistochemical staining of pre-treatment transurethral resection of bladder tumor specimens (n = 59) and clinical outcomes.
(a) Relationship between PD-L1 immunohistochemical staining and scoring according to the combined positive score (CPS) and achievement of a clinical complete response (Y, yes; N, no) in 59 patients with available samples for testing. Box and whisker plots demonstrating CPS for patients achieving a clinical complete response (min 0, max 95, median 5, 1st quartile 1, 3rd quartile 20) and not achieving a clinical complete response (min 0, max 95, median 1, 1st quartile 0, 3rd quartile 5). (b) Kaplan–Meier curve for metastasis-free survival according to PD-L1 expression of baseline TURBT specimens using the cut-point of CPS ≥ 10 versus < 10. (c) Kaplan–Meier curve for overall survival according to PD-L1 expression of baseline TURBT specimens using the cut-point of CPS ≥ 10 versus < 10.
Extended Data Fig. 4
Extended Data Fig. 4. Peripheral blood mass cytometry (CyTOF) and association with response and overall survival.
(a) Heatmap, showing the differential abundance results between cell populations and association with clinical complete response (cCR). The x-axis shows the cell type annotation from ASTROLABE. The y-axis shows the timepoint of the comparison between responders (Y) and non-responders (N). The direction of the logFC is dictated by the comparison. Negative logFC indicates increase of expression in responders. The size of the circle indicates the significance. The larger the circle the smaller the p value. Additionally, the stars on top of the circles indicate p < 0.05 significance. Circles without stars indicate p > 0.05 or non-statistically significant. (b) Peripheral blood CyTOF data. Volcano plot for overall survival (OS) based on cycle 1 day 1 (C1D1) abundances of cell populations showing log rank test (y-axis) and Cox regression hazard ratio (x-axis). Cell abundances significant for both tests are shown in pink. A lower hazard ratio (left side of the black line) is associated with reduced risk. (c) Peripheral blood CyTOF data. Volcano plot for OS based on cycle 3 day 1 (C3D1) abundances of cell populations showing log rank test (y-axis) and Cox regression hazard ratio (x-axis). Cell abundances significant for both tests are shown in pink. A lower hazard ratio (left side of the black line) is associated with reduced risk.
Extended Data Fig. 5
Extended Data Fig. 5. Peripheral blood protein analytes and association with response and overall survival.
(a) Volcano plot demonstrating trend in peripheral blood analytes by Olink from cycle 1 day 1 (C1D1) to cycle 3 day 1 (C3D1) demonstrating largest increase in PD-1 (PDCD1). (b) Peripheral blood protein analyte data. Volcano plot for overall survival (OS) based on C1D1 levels of protein analytes showing log rank test (y-axis) and Cox regression hazard ratio (x-axis). Analytes significant for both tests are shown in pink. A lower hazard ratio (left side of the black line) is associated with reduced risk. (c) Peripheral blood protein analyte data. Volcano plot for overall survival (OS) based on C3D1 levels of protein analytes showing log rank test (y-axis) and Cox regression hazard ratio (x-axis). Analytes significant for both tests are shown in pink. A lower hazard ratio (left side of the black line) is associated with reduced risk. (d) Kaplan-Meier curves showing better OS as measured from C3D1 in patients with lower versus higher peripheral blood levels of angiopoietin-2 (ANGPT2). (e) Peripheral blood protein analyte data. Volcano plot for metastasis-free survival (MFS) based on changes in levels of protein analytes from C1D1 to C3D1 showing log rank test (y-axis) and Cox regression hazard ratio (x-axis). Analytes significant for both tests are shown in pink. A lower hazard ratio (left side of the black line) is associated with reduced risk. (f) Kaplan-Meier curves for the proteins in E showing MFS for patients with an increase in PGF, MMP7, or IL6 from C1D1 to C3D1 versus a decrease in levels of these proteins. (g) Peripheral blood protein analyte data. Volcano plot for OS based on changes in levels of protein analytes from C1D1 to C3D1 showing log rank test (y-axis) and Cox regression hazard ratio (x-axis). Analytes significant for both tests are shown in pink. A lower hazard ratio (left side of the black line) is associated with reduced risk. (h) Peripheral blood protein analyte data. Line plots showing individual changes in protein levels from C1D1 to C3D1. N = 64 patients for each analyte for C1D1 to C3D1 comparisons.
Extended Data Fig. 6
Extended Data Fig. 6. Urine protein analytes and association with response and survival.
(a) Urine Olink protein analyte data. Volcano plot showing the differential expression at time of restaging among patients achieving or not achieving a clinical complete response. The statistical significance or -log10(Pval) is shown on y-axis and log2 protein levels is shown on x-axis. (b) Urine protein analyte data. Volcano plot for overall survival (OS) based levels of protein analytes in the urine at the time of restaging showing log rank test (y-axis) and Cox regression hazard ratio (x-axis). Analytes significant for both tests are shown in pink. A lower hazard ratio (left side of the black line) is associated with reduced risk.

Comment in

References

    1. Marqueen KE, et al. Early mortality in patients with muscle-invasive bladder cancer undergoing cystectomy in the United States. JNCI Cancer Spectr. 2018;2:pky075. doi: 10.1093/jncics/pky075. - DOI - PMC - PubMed
    1. Grossman HB, et al. Neoadjuvant chemotherapy plus cystectomy compared with cystectomy alone for locally advanced bladder cancer. N. Engl. J. Med. 2003;349:859–866. doi: 10.1056/NEJMoa022148. - DOI - PubMed
    1. Griffiths G, Hall R, Sylvester R, Raghavan D, Parmar MK. International phase III trial assessing neoadjuvant cisplatin, methotrexate, and vinblastine chemotherapy for muscle-invasive bladder cancer: long-term results of the BA06 30894 trial. J. Clin. Oncol. 2011;29:2171–2177. doi: 10.1200/JCO.2010.32.3139. - DOI - PMC - PubMed
    1. Flaig TW, et al. A randomized phase II study of coexpression extrapolation (COXEN) with neoadjuvant chemotherapy for bladder cancer (SWOG S1314; NCT02177695) Clin. Cancer Res. 2021;27:2435–2441. doi: 10.1158/1078-0432.CCR-20-2409. - DOI - PMC - PubMed
    1. Herr HW, Bajorin DF, Scher HI. Neoadjuvant chemotherapy and bladder-sparing surgery for invasive bladder cancer: ten-year outcome. J. Clin. Oncol. 1998;16:1298–301. doi: 10.1200/JCO.1998.16.4.1298. - DOI - PubMed

Publication types

MeSH terms

Associated data