. 2023 Oct;29(10):2535-2546.
doi: 10.1038/s41591-023-02570-7. Epub 2023 Oct 2.

AZD5582 plus SIV-specific antibodies reduce lymph node viral reservoirs in antiretroviral therapy-suppressed macaques

Affiliations

AZD5582 plus SIV-specific antibodies reduce lymph node viral reservoirs in antiretroviral therapy-suppressed macaques

Amir Dashti et al. Nat Med. 2023 Oct.

Abstract

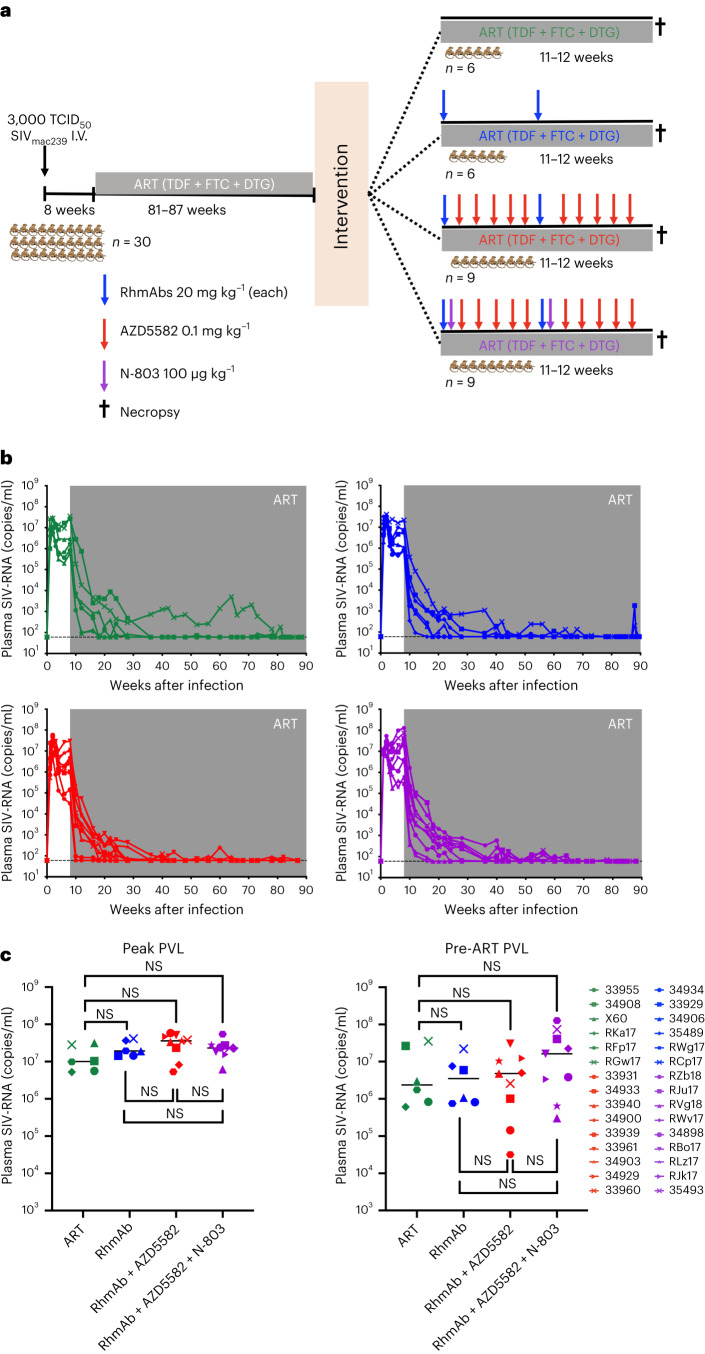
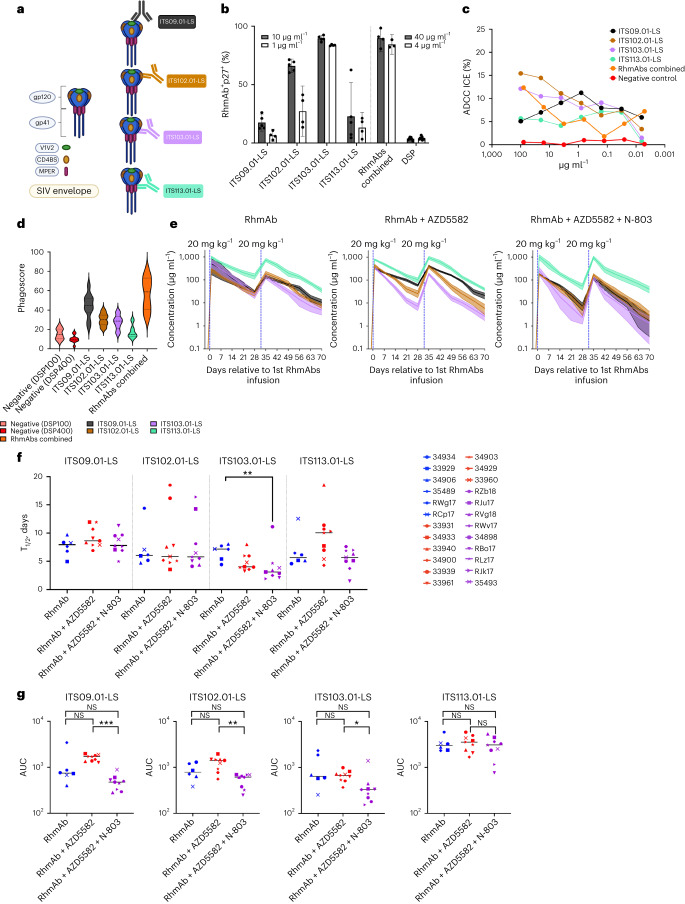
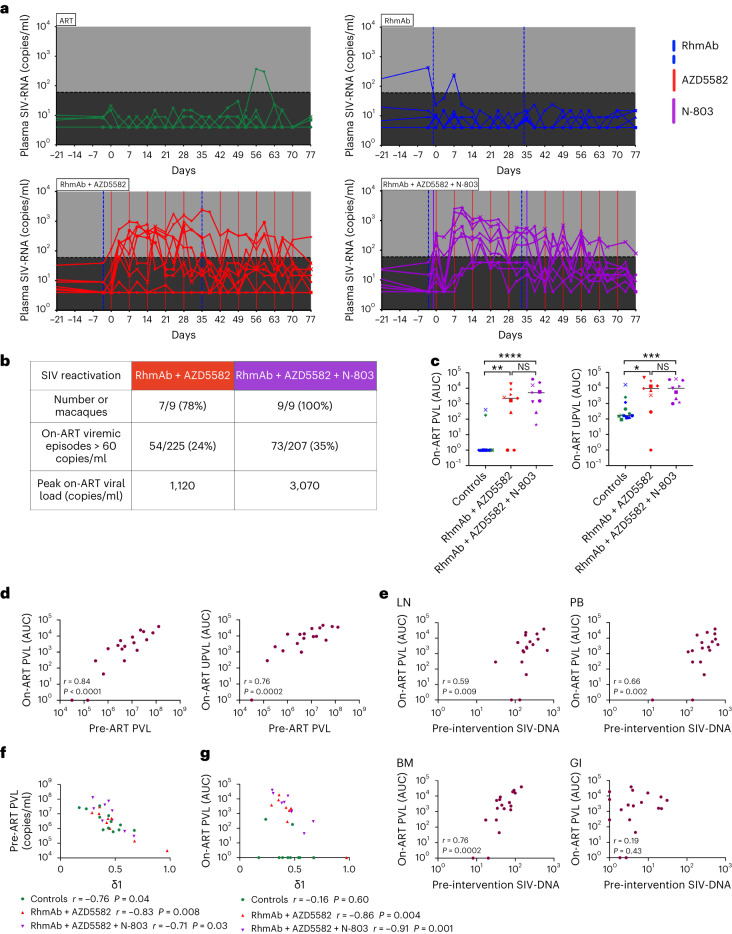
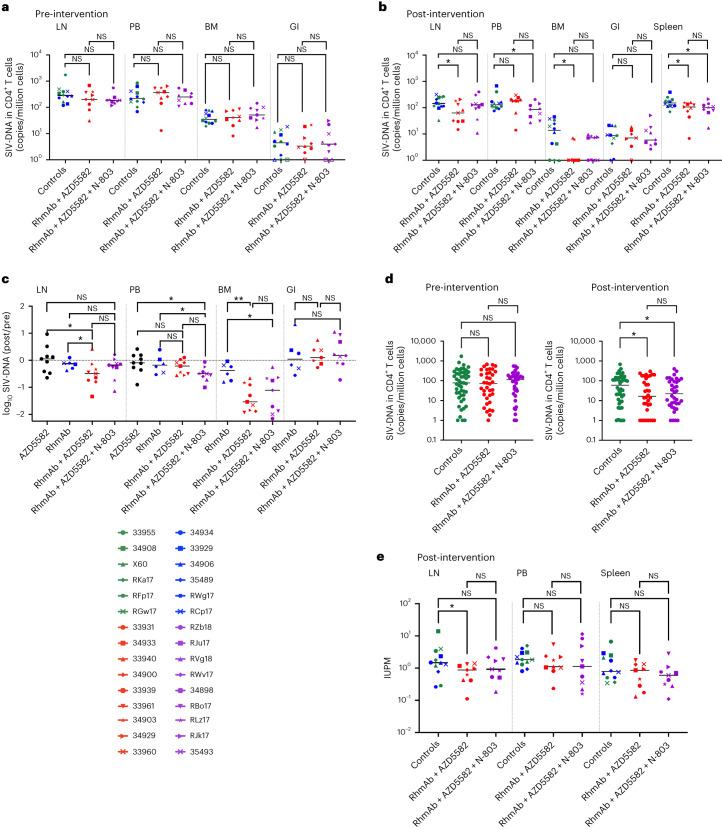
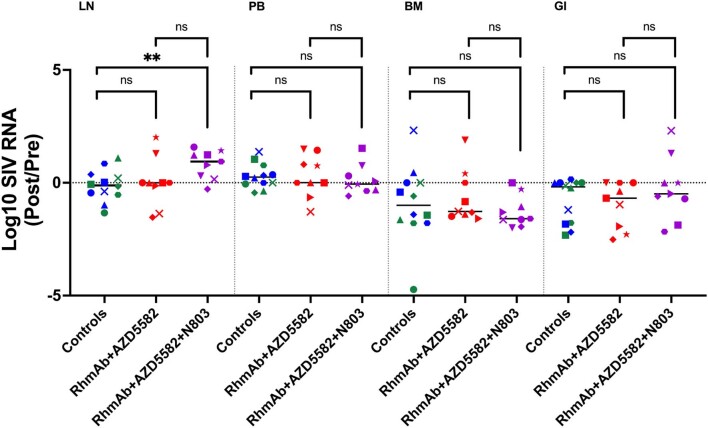
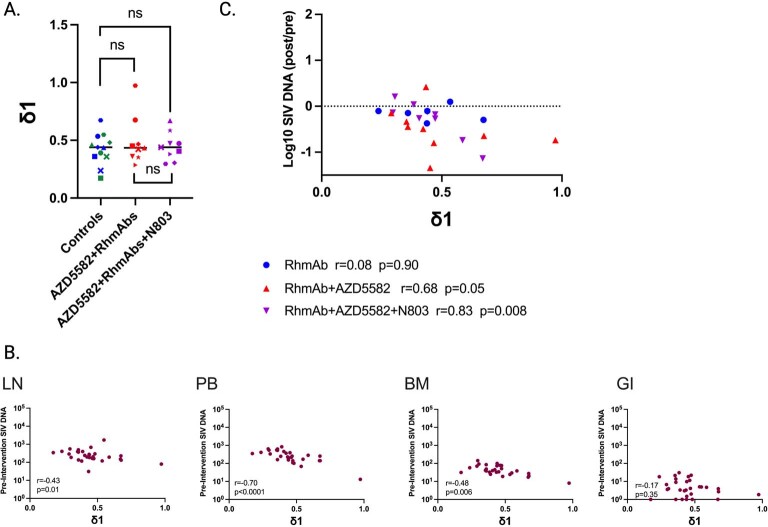
The main barrier to HIV cure is a persistent reservoir of latently infected CD4+ T cells harboring replication-competent provirus that fuels rebound viremia upon antiretroviral therapy (ART) interruption. A leading approach to target this reservoir involves agents that reactivate latent HIV proviruses followed by direct clearance of cells expressing induced viral antigens by immune effector cells and immunotherapeutics. We previously showed that AZD5582, an antagonist of inhibitor of apoptosis proteins and mimetic of the second mitochondrial-derived activator of caspases (IAPi/SMACm), induces systemic reversal of HIV/SIV latency but with no reduction in size of the viral reservoir. In this study, we investigated the effects of AZD5582 in combination with four SIV Env-specific Rhesus monoclonal antibodies (RhmAbs) ± N-803 (an IL-15 superagonist) in SIV-infected, ART-suppressed rhesus macaques. Here we confirm the efficacy of AZD5582 in inducing SIV reactivation, demonstrate enhancement of latency reversal when AZD5582 is used in combination with N-803 and show a reduction in total and replication-competent SIV-DNA in lymph-node-derived CD4+ T cells in macaques treated with AZD5582 + RhmAbs. Further exploration of this therapeutic approach may contribute to the goal of achieving an HIV cure.


Conflict of interest statement

J.T.S. is employed by ImmunityBio. The remaining authors declare no competing interests.

Figures

Fig. 1
Fig. 1. Study design and animal group assignment.
a, Experimental design. Thirty RMs were infected with SIVmac239. ART was initiated 8 weeks p.i. After 81–87 weeks of ART, RMs were divided into four groups with continuous ART exposure: ART controls (n = 6); RhmAb controls (n = 6); RhmAb + AZD5582 (n = 9); and RhmAb + AZD5582 + N-803 (n = 9). RhmAbs were dosed twice at 20 mg kg−1 s.c. each; AZD5582 at 0.1 mg kg−1 i.v. weekly for 10 weeks and N-803 at 100 μg kg−1 s.c. twice as shown. The first RhmAbs injection was administered 3 d before the first dose of AZD5582. N-803 was given at the same time as RhmAbs. b, Plasma SIV-RNA levels in the 30 RMs after SIV infection and ART but before further interventions. Green symbols: ART control group (n = 6); blue symbols: RhmAb control group (n = 6); red symbols: RhmAb + AZD5582 group (n = 9); purple symbols: RhmAb + AZD5582 + N-803 group (n = 9). Gray shading represents the period of ART administration c, Peak and pre-ART viral loads compared across groups: ART controls (n = 6); RhmAb controls (n = 6); RhmAb + AZD5582 (n = 9); and RhmAb + AZD5582 + N-803 (n = 9). Statistical significance was determined with a two-sided Mann–Whitney U-test. Horizontal lines represent the median.
Fig. 2
Fig. 2. RhmAb specificities and function.
a, Schematic representation of RhmAbs used in this study. ITS09.01-LS, ITS102.01-LS, ITS103.01-LS and ITS113.01-LS RhmAbs target V2, CD4 binding site, CD4 binding site proximal and MPER, respectively. b, Surface binding of RhmAbs to SIVmac239-infected A66 cells. The percentage of infected cells (p27+) with bound RhmAbs (at 10 µg ml−1 and 1 μg ml−1) was measured by flow cytometry. Combo indicates the binding of a combination of all four RhmAbs (total of 40 µg ml−1 and 4 μg ml−1). Anti-DSP was used as a negative control at both 40 µg ml−1 and 4 µg ml−1. Technical replicates are shown: n = 5 (10 µg ml−1); n = 4 (1 μg ml−1 and combo at 10 µg ml−1 each); n = 3 (combo at 1 μg ml−1 each); n = 7 (DSP 40 µg ml−1); n = 9 (DSP 4 µg ml−1). Mean with 95% confidence intervals are shown. c, In vitro analysis of ICE ADCC assay using SIVmac239-infected or mock-infected A66 cells as targets and NK92RhCD16 cells as effectors at a 10:1 effector:target ratio. Individual RhmAbs were tested using five-fold dilutions starting at 100 µg ml−1 concentration. The cocktail of four RhmAbs was also tested starting with 80 µg ml−1 total IgG (20 µg ml−1 of each RhmAb). The negative control DSP was tested using five-fold dilutions starting at 80 µg ml−1. d, In vitro analysis of ADNP using granulocytes isolated from PBMCs of SIVmac239-infected RMs as effectors and SIVmac239 gp130-coated fluorescent beads as targets. Individual RhmAbs were tested using 100 µg ml−1 concentration. Combined RhmAbs were tested using 100 µg ml−1 concentration of each RhmAb. The negative control DSP was tested at 100 µg ml−1 and 400 µg ml−1 (DSP100 and DSP400). e, RhmAb concentrations in serum (mean ± s.e.m.) are shown after each of the two injections of RhmAbs over10 weeks of the intervention phase of the experiment. Vertical blue lines show the timing of RhmAb administration. f, Half-life (T1/2) of RhmAbs after the first dose. RhmAb controls (n = 6), RhmAb + AZD5582 (n = 9) and RhmAb + AZD5582 + N-803 (n = 9). g, AUC of RhmAb concentrations from 24 h after the first dose through day 70. RhmAb controls (n = 6), RhmAb + AZD5582 (n = 9) and RhmAb + AZD5582 + N-803 (n = 9). Statistical significance was determined using the Kruskal–Wallis test with Dunn’s multiple comparisons test in f and g. Horizontal lines represent the median. NS, non-significant. *P < 0.05; **P < 0.01; ***P < 0.001.
Fig. 3
Fig. 3. Latency reversal induced by AZD5582 and AZD5582 + N-803 in ART-suppressed SIV-infected macaques.
a, Plasma SIV-RNA levels measured by the ultrasensitive viral load assay in ART-suppressed SIV-infected RMs during the intervention phase of the experiment. The black shading defines the difference between the LOD of conventional and ultrasensitive viral load assays (60 versus 4 copies per milliliter). Gray shading represents the period of ART administration. Blue vertical lines represent RhmAb administration; purple vertical lines represent N-803 administration; and red vertical lines represent AZD5582 infusions. The first N-803 dose was administered 3 d before AZD5582 and at the same time as RhmAbs. Green symbols: ART control group (n = 6); blue symbols: RhmAb control group (n = 6); red symbols: RhmAb + AZD5582 group (n = 9); purple symbols: RhmAb + AZD5582 + N-803 group (n = 9). b, Comparison of latency reversal in RhmAb + AZD5582 and RhmAb + AZD5582 + N-803 groups using ultrasensitive viral load assay results. c, Comparison of on-ART viremia (AUC) between groups during the intervention period (days 0–77). Both control groups (ART and RhmAbs) are combined. Results from both the standard PVL assay and the UPVL assay are shown. Controls (n = 12), RhmAb + AZD5582 (n = 9) and RhmAb + AZD5582 + N-803 (n = 9). Statistical significance was determined with a two-sided Mann–Whitney U-test. Horizontal lines represent the median. NS, non-significant. *P < 0.05; **P < 0.01; ***P < 0.001; ****P < 0.0001. d, Correlation between pre-ART (week 8) PVLs and on-ART viremia presented as AUC of plasma SIV-RNA levels measured by standard viral load assay (left) and ultrasensitive viral load assay (right) in all RMs that received AZD5582. e, Correlation between AUC of on-ART viremia during the intervention period in all RMs that received AZD5582 and CD4+ T-cell-associated SIV-DNA at weeks 81–87 (before AZD5582 or AZD5582 + N-803 administration) in lymph nodes (LNs), peripheral blood (PB), bone marrow (BM) and gastrointestinal tract (GI). f, Correlation between pre-ART (week 8) plasma SIV-RNA levels and δ1. g, Correlation between on-ART plasma viremia during intervention and δ1. Non-parametric two-sided Spearman correlation with 95% confidence interval was used for statistical analysis in dg.
Fig. 4
Fig. 4. Viral reservoir assessment.
a, Comparison of cell-associated SIV-DNA levels in CD4+ T cells isolated from lymph nodes (LNs), peripheral blood (PB), bone marrow (BM) and gastrointestinal tract (GI) between groups at weeks 81–87 (when all animals have received only ART—pre-intervention timepoint). Both control groups (ART and RhmAbs) are combined. Controls (n = 12), RhmAb + AZD5582 (n = 9) and RhmAb + AZD5582 + N-803 (n = 9). b, Comparison of cell-associated SIV-DNA levels in CD4+ T cells isolated from LN, PB, BM, GI tract and spleen at weeks 101–105 (after all interventions have been administered—post-intervention timepoint). Controls (n = 12), RhmAb + AZD5582 (n = 9) and RhmAb + AZD5582 + N-803 (n = 9). c, Comparison of the fold change of SIV-DNA levels in CD4+ T cells isolated from LN, PB, BM and GI tract between groups that received RhmAbs. For LN and PB, data from a historical group of RMs given AZD5582 are shown only for comparison. AZD5582 (n = 9), RhmAb controls (n = 6), RhmAb + AZD5582 (n = 9), RhmAb + AZD5582 + N-803 (n = 9). d, Comparison of cell-associated SIV-DNA levels in CD4+ T cells isolated from PB + LN + BM + GI (combined, to approximate the total body SIV-DNA pool) before intervention (left) and after intervention (right). Controls (n = 12), RhmAb + AZD5582 (n = 9), RhmAb + AZD5582 + N-803 (n = 9). e, Frequencies of CD4+ T cells from LN, PB and spleen with replication-competent SIV determined by quantitative viral outgrowth assay at weeks 101–105 (after all interventions have been administered—post-intervention timepoint). Controls (n = 12), RhmAb + AZD5582 (n = 9), RhmAb + AZD5582 + N-803 (n = 9). Statistical significance was determined using the Mann–Whitney U-test in ac and e and two-way ANOVA with Tukey’s multiple comparisons test in d. Horizontal lines represent the median. NS, non-significant; IUPM, Infectious Units Per Million CD4+ T cells. *P < 0.05; **P < 0.01.
Extended Data Fig. 1
Extended Data Fig. 1. Gating strategy for flow cytometric analysis of RhmAb binding to infected cells.
Gating strategy for flow cytometric analysis of RhmAb binding to mock-infected A66 cell line, expressing rhesus CD4 and CCR5 receptors (top) and SIVmac239-infected A66 cells (bottom). For SIVmac239-infected cells, p27+ and p27 cells were analyzed for surface binding by staining with secondary Ab (goat anti-human (H + L) polyclonal antisera) after incubation with RhmAbs.
Extended Data Fig. 2
Extended Data Fig. 2. RhmAb pharmacokinetics and ADA measurements in individual macaques.
Serum concentrations of RhmAbs and ADA measurements in individual RMs in RhmAb control group (a), RhmAb + AZD5582 group (b), RhmAb + AZD5582 + N-803 group (c). Solid lines = RhmAb concentration; dashed lines = ADA level. Vertical dashed lines represent the RhmAb administrations.
Extended Data Fig. 3
Extended Data Fig. 3. ADA measurements in individual macaques.
a–c. ADA development in the three groups that received RhmAbs (% of time points where ADA was detected during the ten weeks of the intervention phase). d. Negative correlation between RhmAb serum concentrations (AUC) and ADA levels (AUC) (all groups combined) for all RhmAbs except ITS113.01-LS. Nonparametric two-sided Spearman correlation with 95% confidence interval was used for statistical analysis.
Extended Data Fig. 4
Extended Data Fig. 4. Longitudinal immune cell subsets and their phenotype.
a. Longitudinal assessment of white blood cells (WBC), neutrophils, monocytes (top); lymphocytes, CD4+ T cells, and CD8+ T cells (middle); and Ki67 expression in CD4+ T cells (left), and CD8+ T cells (right) in peripheral blood. Line shows the mean with shading representing SEM. Statistical significance was determined using Friedman test with Dunn’s test for multiple comparisons. Friedman p value shown on the graphs with post-test comparisons shown by * p < 0.05; ** p < 0.01; *** p < 0.001; **** p < 0.0001. Controls (n = 12), RhmAb + AZD5582 (n = 9), and RhmAb + AZD5582 + N-803 (n = 9). Exact p values reported in Results, with the exception of i) Control group Ki67+CD4+ T cells: p = 0.004, day 10 vs −7 and p = 0.0004, day 46 vs −7; Ki67+CD8+ T cells: p = 0.009, day 10 vs −7; ii) RhmAb + AZD5582 group lymphocytes: p = 0.002, day 3 vs −5 and p = 0.007, day 24 vs −5; CD4+ T cells: p<0.0001, day 10 vs −5 and p = 0.03, days 24 and 32 vs −5; CD8+ T cells: p<0.0001, day 10 vs −5, p = 0.02, day 24 vs −5, p = 0.0002, day 32 vs −5, and p = 0.04, day 67 vs −5; Ki67+CD4+ T cells: p<0.0001, day 10 vs −7 and p<0.0001, day 39 vs −7; Ki67+CD8+ T cells: p<0.0001, day 10 vs −7 and p = 0.02, day 32 vs −7; iii) RhmAb + AZD5582 + N-803 group Ki67+CD4+ T cells: p = 0.001, day 3 vs −7 and p = 0.02, day 53 vs −7; Ki67+CD8+ T cells: p<0.0001, day 3 vs −7 and p < 0.0001, day 46 vs −7. b. Comparison of CCR5, HLA-DR, Ki67, and PD-1 expression pre- and post-intervention (weeks 78–87 and 101–105) in CD4+ T cells from peripheral blood (left) and LN (right). ART controls (n = 6), RhmAb controls (n = 6), RhmAb + AZD5582 (n = 9), and RhmAb + AZD5582 + N-803 (n = 9). Exact p values reported in Results, with the exception of blood CD4+CCR5+ and blood CD4+PD-1+ T cells for the RhmAb + AZD5582 + N-803 group (p = 0.004 and p = 0.008, respectively). c. Comparison of CCR5, HLA-DR, Ki67, and PD-1 expression pre- and post-intervention (weeks 78–87 and 101–105) in CD8+ T cells from peripheral blood (left) and LN (right). Exact p values reported in Results, with the exception of blood CD8+CCR5+ and blood CD8+PD-1+ T cells for the RhmAb + AZD5582 + N-803 group (p = 0.004 and p = 0.04, respectively). Statistical significance was determined using two-sided Wilcoxon matched-pairs signed-rank tests in (B) and (C). NS = non-significant. * p < 0.05; ** p < 0.01. d. Morphologic assessment of lymph nodes in each group. e. Levels of CD4+ and CD8+ T cells in lymph nodes comparing pre-, mid- and post-intervention time points in the RhmAb + AZD5582 and RhmAb + AZD5582 + N-803 groups and similar time points in ART and RhmAb controls. Pre-intervention: n = 3 (ART controls), n = 3 (RhmAb controls), n = 4 (RhmAb + AZD5582), n = 3 (RhmAb + AZD5582 + N-803). Mid-intervention: n = 2 (ART controls), n = 3 (RhmAb controls), n = 4 (RhmAb + AZD5582), n = 5 (RhmAb + AZD5582 + N-803). Post-intervention: n = 4 (ART controls), n = 2 (RhmAb controls), n = 7 (RhmAb + AZD5582), n = 6 (RhmAb + AZD5582 + N-803).
Extended Data Fig. 5
Extended Data Fig. 5. Innate effector cells.
a. Longitudinal assessment of total NK cells in the blood of the RhmAb + AZD5582 + N-803 group (top left, n = 9). NK cell frequency in blood and lymph nodes from the RhmAb + AZD5582 + N-803 group (top right, n = 9). Line shows the mean with shading representing SEM. b. Longitudinal expression of functional markers in NK cells from peripheral blood (bottom left) and lymph nodes (bottom right) in the RhmAb + AZD5582 + N-803 group. Line shows the mean with shading representing SEM. Statistical significance was determined using two-sided Wilcoxon matched-pairs signed-rank test. * p < 0.05; ** p < 0.01.
Extended Data Fig. 6
Extended Data Fig. 6. Adaptive effector cells.
a. Gating strategy to identify CD8+CD95+ T cells. b. Representative gating for IFNg in CD8+CD95+ T cells following incubation with DMSO (negative control), SIV Gag peptides, and phorbal 12-myristate 13-acetate (PMA) + ionomycin (ION) (positive control). c. Frequencies of SIV-specific memory CD8+ T cells in the ART and RhmAb controls (n = 8, left) and RhmAb + AZD5582 group (n = 8, right). Data points shown are DMSO subtracted from the Gag condition at each time point and for each individual RM. Statistical significance was determined using the two-sided Wilcoxon matched-pairs signed-rank test. ** p < 0.01.
Extended Data Fig. 7
Extended Data Fig. 7. Cell-associated SIV-RNA assessment.
Comparison of the fold change of SIV-RNA levels in CD4+ T cells isolated from LN, PB, BM, and GI tract between groups. Controls (n = 12), RhmAb + AZD5582 (n = 9), and RhmAb + AZD5582 + N-803 (n = 9). Statistical significance was determined with a two-sided Mann-Whitney U test. Horizontal lines represent the median. NS = non-significant. ** p < 0.01.
Extended Data Fig. 8
Extended Data Fig. 8. δ1 and reservoir levels pre-intervention.
a. Comparison of δ1 between groups. Controls (n = 12), RhmAb + AZD5582 (n = 9), and RhmAb + AZD5582 + N-803 (n = 9). Statistical significance was determined with a two-sided Mann-Whitney U test. Horizontal lines represent the median. NS = non-significant. b. Correlation between δ1 and levels of CD4 + T cell-associated SIV-DNA in all RMs at weeks 81–87 before treatment with RhmAbs, AZD5582, or N-803 in lymph nodes (LN), peripheral blood (PB), bone marrow (BM), and gastrointestinal (GI) tract. c. Correlation between δ1 and the fold change in SIV-DNA in LN CD4+ T cells for each group that received RhmAbs. Nonparametric two-sided Spearman correlation with 95% confidence interval was used for statistical analysis in (B) and (C).

Similar articles

Cited by

References

    1. Finzi D, et al. Identification of a reservoir for HIV-1 in patients on highly active antiretroviral therapy. Science. 1997;278:1295–1300. doi: 10.1126/science.278.5341.1295. - DOI - PubMed
    1. Wong JK, et al. Recovery of replication-competent HIV despite prolonged suppression of plasma viremia. Science. 1997;278:1291–1295. doi: 10.1126/science.278.5341.1291. - DOI - PubMed
    1. Chun TW, et al. Rebound of plasma viremia following cessation of antiretroviral therapy despite profoundly low levels of HIV reservoir: implications for eradication. AIDS. 2010;24:2803–2808. doi: 10.1097/QAD.0b013e328340a239. - DOI - PMC - PubMed
    1. Deeks SG, et al. Research priorities for an HIV cure: International AIDS Society Global Scientific Strategy 2021. Nat. Med. 2021;27:2085–2098. doi: 10.1038/s41591-021-01590-5. - DOI - PubMed
    1. Lee MJ, et al. Immunotherapeutic approaches to HIV cure and remission. Curr. Op. Infect. Dis. 2022;35:31–41. doi: 10.1097/QCO.0000000000000803. - DOI - PubMed

Publication types

Substances