. 2023 Oct 3;23(1):281.
doi: 10.1186/s12866-023-03029-y.

Angelica polysaccharides relieve blood glucose levels in diabetic KKAy mice possibly by modulating gut microbiota: an integrated gut microbiota and metabolism analysis

Affiliations

Angelica polysaccharides relieve blood glucose levels in diabetic KKAy mice possibly by modulating gut microbiota: an integrated gut microbiota and metabolism analysis

Xiaolong Tang et al. BMC Microbiol. .

Abstract

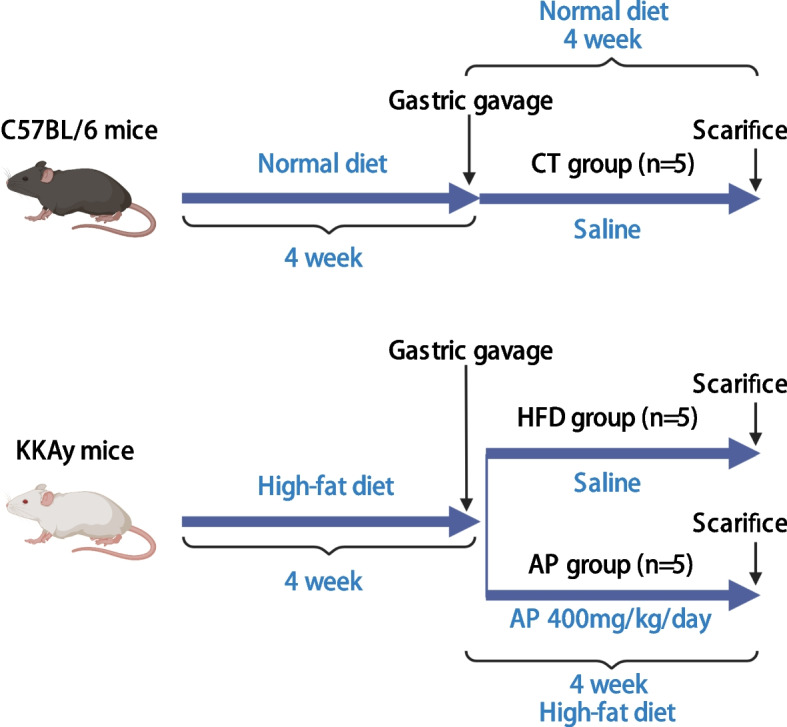
Background: Angelica polysaccharides (AP) have numerous benefits in relieving type 2 diabetes (T2D). However, the underlying mechanisms have yet to be fully understood. Recent many reports have suggested that altering gut microbiota can have adverse effects on the host metabolism and contribute to the development of T2D. Here, we successfully established the T2D model using the male KKAy mice with high-fat and high-sugar feed. Meanwhile, the male C57BL/6 mice were fed with a normal feed. T2D KKAy mice were fed either with or without AP supplementation. In each group, we measured the mice's fasting blood glucose, weight, and fasting serum insulin levels. We collected the cecum content of mice, the gut microbiota was analyzed by targeted full-length 16S rRNA metagenomic sequencing and metabolites were analyzed by untargeted-metabolomics.

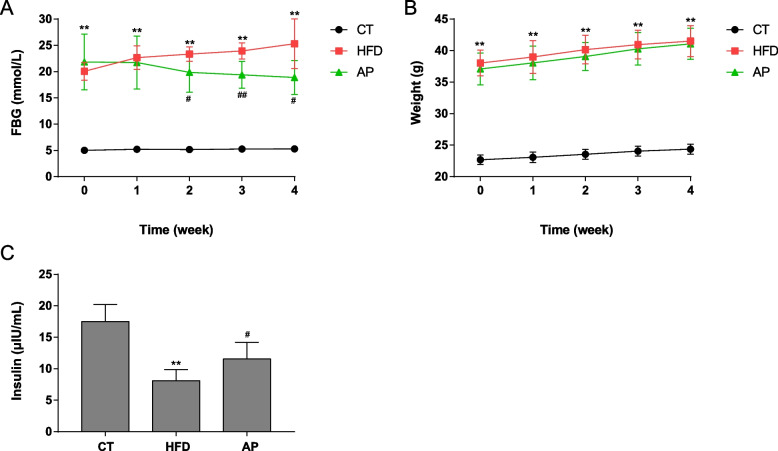
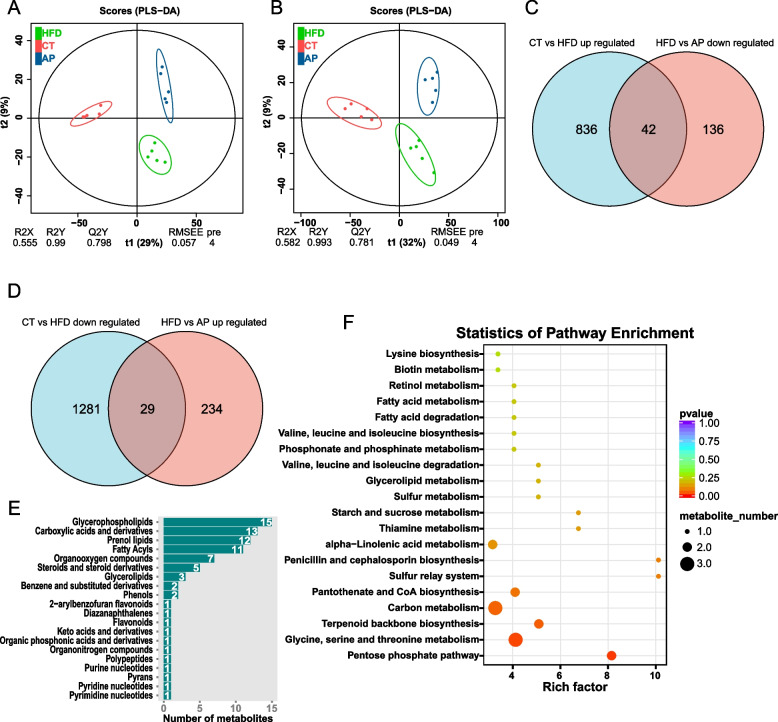
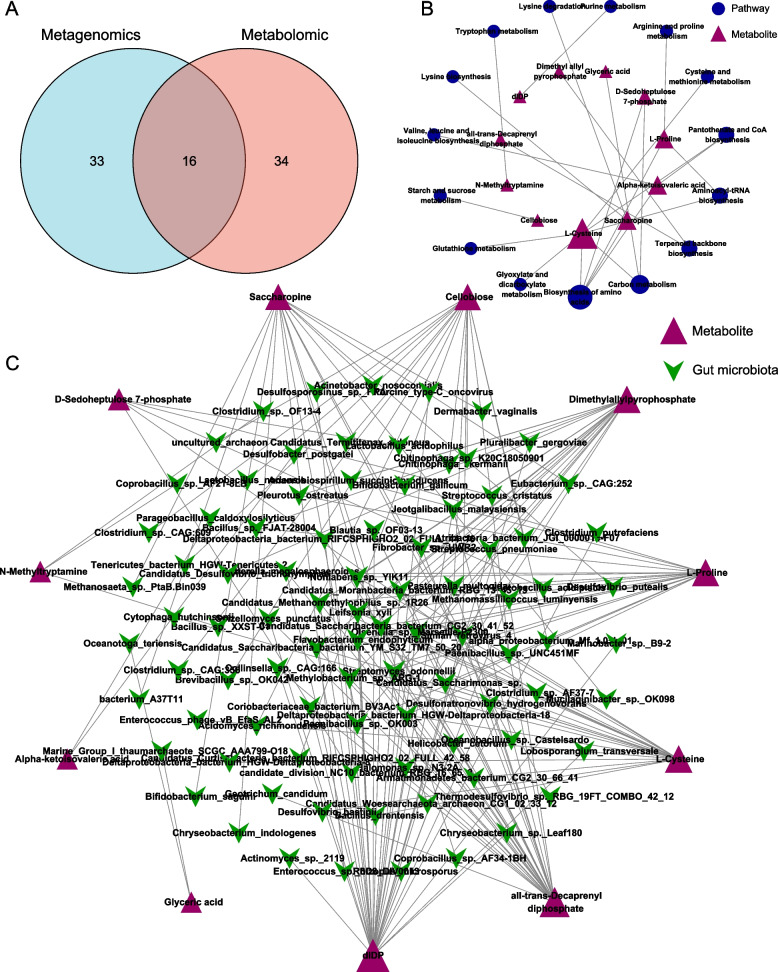
Results: We found AP effectively alleviated glycemic disorders of T2D KKAy mice, with the changes in gut microbiota composition and function. Many bacteria species and metabolites were markedly changed in T2D KKAy mice and reversed by AP. Additionally, 16 altered metabolic pathways affected by AP were figured out by combining metagenomic pathway enrichment analysis and metabolic pathway enrichment analysis. The key metabolites in 16 metabolic pathways were significantly associated with the gut microbial alteration. Together, our findings showed that AP supplementation could attenuate the diabetic phenotype. Significant gut microbiota and gut metabolite changes were observed in the T2D KKAy mice and AP intervention.

Conclusions: Administration of AP has been shown to improve the composition of intestinal microbiota in T2D KKAy mice, thus providing further evidence for the potential therapeutic application of AP in the treatment of T2D.

Keywords: 16S rRNA gene sequences; Gut microbiota; Metabolomics; Metagenomics; Type 2 diabetes.


Conflict of interest statement

The authors declare no competing interests..

Figures

Fig. 1
Fig. 1
The flow chart of the experimental design for all groups
Fig. 2
Fig. 2
AP supplementation alleviates the hyperglycemia of HDF KKAy mice. Male C57BL/6 mice were treated with a regular diet (CT). KKAy mice were treated with a high-fat diet without (HFD) or with AP supplementation (AP). The experiment lasted for four weeks. A The effects of AP supplementation on FBG level. B The effects of AP supplementation on body weight level. C The effects of AP supplementation on the fasting serum insulin level. Mean ± SEM (n = 5). **p < 0.01 compared with CT group; #p < 0.05 and ##p < 0.01 compared with HFD group
Fig. 3
Fig. 3
16S full-length rRNA sequencing discovered that AP reversed gut dysbiosis in HFD KKAy mice (n = 5). A Shannon index analysis based on Bray–Curtis distance showed no significant differences were observed among CT, HFD, and AP groups at the OTU level. B Bray–Curtis PERMANOVA analysis showed a significant difference between the three groups (p = 0.001). C The number of OTUs found in the CT, HFD, and AP groups; the total number of OTUs. D The Venn diagram showed the extent of overlapped and specific OTUs among the three groups. E Bray–Curtis PCoA analysis displayed clear separation among the three groups at the OTU level. F Bray–Curtis PCoA analysis displayed clear separation among the three groups at the genus level. G The bar graph showed each group's top 10 relative abundance gut microbiota at the genus level. H The top 10 relative abundance gut microbiota at the phyla level in each group. Most of the dominant bacteria changed by HFD were reversed by AP treatment. I The ratio of Firmicutes/Bacteroidetes was higher in the HFD group than in the CT group and reversed by AP treatment. J Heatmap based on Bray–Curtis distance showed that the distance between AP and CT groups was relatively closer than the distance between HDF and CT groups. The color gradient on the adjacent bar chart, transitioning from blue to red, represents the magnitude of differences between the samples, with blue indicating minimal differences and red indicating maximal differences
Fig. 4
Fig. 4
Metagenomics sequencing discovered that AP reversed gut dysbiosis in HFD KKAy mice (n = 3). A Venn diagram showed the extent of overlapped and specific bacterial species among the three groups. B Bray–Curtis PCoA analysis displayed clear separation among the three groups at the species level. C Based on the criteria of p < 0.05, 416 species abundance significantly increased by HFD and reversed by AP. D Based on the criteria of p < 0.05, 30 species significantly decreased by HFD and reversed by AP. E Venn diagram showed the extent of overlapped and specific KO among the three groups. F Bray–Curtis PCoA analysis displayed clear separation among the three groups at the KO level. G The different KEGG pathways related to metabolism between HFD and AP groups
Fig. 5
Fig. 5
LC–MS/MS-based untargeted metabolic profiling in positive and negative modes discovered that AP changes gut metabolome in HFD KKAy mice (n = 5). A, B The PLS-DA analysis showed clear separation among three groups in the positive model (R2X = 0.555, R2Y = 0.99, Q2Y = 0.798) and in the negative model (R2X = 0.582, R2Y = 0.993, Q2Y = 0.781). C, D With the criteria of either VIP > 1 and p < 0.05, the Venn diagram showed the number of differential metabolites between groups. 42 metabolites were up-regulated by HFD and reversed by AP, 29 metabolites were down-regulated by HFD and reversed by AP. E The differential metabolites class categories between HFD and AP groups. F The top 20 of KEGG enrichment analysis based on the differential metabolites between HFD and AP groups
Fig. 6
Fig. 6
Exploration of the relationship between gut microbial species and differential metabolites. A Between the HFD and AP groups, there were 16 common metabolic pathways that overlapped between the metagenomic sequencing and metabolomics. B The network analysis showed that the 16 common metabolic pathways contained 11 differential metabolites. C The network analysis showed the significant relationship between the metabolites and the bacterial species based on the criteria of the spearman’s coefficient less than -0.7 or more than 0.7, and p < 0.01

Similar articles

Cited by

References

    1. Khan MAB, Hashim MJ, King JK, Govender RD, Mustafa H, Al KJ. Epidemiology of Type 2 Diabetes - Global Burden of Disease and Forecasted Trends. J Epidemiol Glob Health. 2020;10:107–111. - PMC - PubMed
    1. Gomaa EZ. Human gut microbiota/microbiome in health and diseases: a review. Antonie Van Leeuwenhoek. 2020;113:2019–2040. - PubMed
    1. Iatcu CO, Steen A, Covasa M. Gut Microbiota and Complications of Type-2 Diabetes. Nutrients. 2021;14:166. - PMC - PubMed
    1. Wu H, Tremaroli V, Schmidt C, Lundqvist A, Olsson LM, Krämer M, et al. The Gut Microbiota in Prediabetes and Diabetes: A Population-Based Cross-Sectional Study. Cell Metab. 2020;32:379–390. - PubMed
    1. Arora T, Tremaroli V. Therapeutic Potential of Butyrate for Treatment of Type 2 Diabetes. Front Endocrinol (Lausanne) 2021;12:761834. - PMC - PubMed

Publication types