A predictive model for preterm infants with bronchopulmonary dysplasia based on ferroptosis-related lncRNAs
- PMID: 37784105
- PMCID: PMC10544375
- DOI: 10.1186/s12890-023-02670-7
A predictive model for preterm infants with bronchopulmonary dysplasia based on ferroptosis-related lncRNAs
Abstract
Background: Bronchopulmonary dysplasia (BPD) is the most challenging chronic lung disease for prematurity, with difficulties in early identification. Given lncRNA emerging as a novel biomarker and the regulator of ferroptosis, this study aims to develop a BPD predictive model based on ferroptosis-related lncRNAs (FRLs).
Methods: Using a rat model, we firstly explored mRNA levels of ferroptosis-related genes and ferrous iron accumulation in BPD rat lungs. Subsequently, a microarray dataset of umbilical cord tissue from 20 preterm infants with BPD and 34 preterm infants without BPD were downloaded from the Gene Expression Omnibus databases. Random forest and LASSO regression were conducted to identify diagnostic FRLs. Nomogram was used to construct a predictive BPD model based on the FRLs. Finally, umbilical cord blood lymphocytes of preterm infants born before 32 weeks gestational age and term infants were collected and determined the expression level of diagnostic FRLs by RT-qPCR.
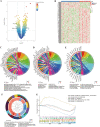
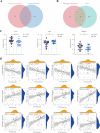
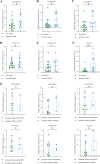
Results: Increased iron accumulation and several dysregulated ferroptosis-associated genes were found in BPD rat lung tissues, indicating that ferroptosis was participating in the development of BPD. By exploring the microarray dataset of preterm infants with BPD, 6 FRLs, namely LINC00348, POT1-AS1, LINC01103, TTTY8, PACRG-AS1, LINC00691, were determined as diagnostic FRLs for modeling. The area under the receiver operator characteristic curve of the model was 0.932, showing good discrimination of BPD. In accordance with our analysis of microarray dataset, the mRNA levels of FRLs were significantly upregulated in umbilical cord blood lymphocytes from preterm infants who had high risk of BPD.
Conclusion: The incorporation of FRLs into a predictive model offers a non-invasive approach to show promise in improving early detection and management of this challenging chronic lung disease in premature infant, enabling timely intervention and personalized treatment strategies.
Keywords: Bronchopulmonary dysplasia; Diagnosis; Ferroptosis; LncRNA; Preterm infant.
© 2023. BioMed Central Ltd., part of Springer Nature.
Conflict of interest statement
The authors declare no competing interests.
Figures


Similar articles
-
Bronchopulmonary dysplasia: analysis and validation of ferroptosis-related diagnostic biomarkers and immune cell infiltration features.Pediatr Res. 2024 Dec;96(7):1673-1680. doi: 10.1038/s41390-024-03249-6. Epub 2024 May 17. Pediatr Res. 2024. PMID: 38760473
-
CircRNA, lncRNA, and mRNA profiles of umbilical cord blood exosomes from preterm newborns showing bronchopulmonary dysplasia.Eur J Pediatr. 2022 Sep;181(9):3345-3365. doi: 10.1007/s00431-022-04544-2. Epub 2022 Jul 5. Eur J Pediatr. 2022. PMID: 35790551 Free PMC article.
-
Long non-coding RNA MALAT1 protects preterm infants with bronchopulmonary dysplasia by inhibiting cell apoptosis.BMC Pulm Med. 2017 Dec 13;17(1):199. doi: 10.1186/s12890-017-0524-1. BMC Pulm Med. 2017. PMID: 29237426 Free PMC article.
-
Inhalation or instillation of steroids for the prevention of bronchopulmonary dysplasia.Neonatology. 2015;107(4):358-9. doi: 10.1159/000381132. Epub 2015 Jun 5. Neonatology. 2015. PMID: 26044104 Review.
-
Pulmonary hypertension associated with bronchopulmonary dysplasia in preterm infants.J Reprod Immunol. 2017 Nov;124:21-29. doi: 10.1016/j.jri.2017.09.013. Epub 2017 Oct 2. J Reprod Immunol. 2017. PMID: 29035757 Review.
Cited by
-
Screening for biomarkers of bronchopulmonary dysplasia: a bioinformatics analysis.Transl Pediatr. 2025 Apr 30;14(4):658-670. doi: 10.21037/tp-2024-595. Epub 2025 Apr 27. Transl Pediatr. 2025. PMID: 40386354 Free PMC article.
-
The Oncogenic Role of VWA8-AS1, a Long Non-Coding RNA, in Epstein-Barr Virus-Associated Oral Squamous Cell Carcinoma: An Integrative Transcriptome and Functional Analysis.Int J Mol Sci. 2024 Nov 22;25(23):12565. doi: 10.3390/ijms252312565. Int J Mol Sci. 2024. PMID: 39684278 Free PMC article.
-
Ferroptosis-related LncRNAs in diseases.BMC Biol. 2025 Jun 6;23(1):158. doi: 10.1186/s12915-025-02268-x. BMC Biol. 2025. PMID: 40481573 Free PMC article. Review.
-
Advancements in biomarkers and machine learning for predicting of bronchopulmonary dysplasia and neonatal respiratory distress syndrome in preterm infants.Front Pediatr. 2025 Apr 25;13:1521668. doi: 10.3389/fped.2025.1521668. eCollection 2025. Front Pediatr. 2025. PMID: 40352605 Free PMC article. Review.
References
-
- Stoll BJ, Hansen NI, Bell EF, Walsh MC, Carlo WA, Shankaran S, Laptook AR, Sánchez PJ, Van Meurs KP, Wyckoff M, Das A, Hale EC, Ball MB, Newman NS, Schibler K, Poindexter BB, Kennedy KA, Cotten CM, Watterberg KL, D'Angio CT, DeMauro SB, Truog WE, Devaskar U, Higgins RD. Trends in Care Practices, Morbidity, and Mortality of Extremely Preterm Neonates, 1993–2012. JAMA. 2015;314(10):1039–1051. doi: 10.1001/jama.2015.10244. - DOI - PMC - PubMed
-
- Jacob SV, Coates AL, Lands LC, MacNeish CF, Riley SP, Hornby L, Outerbridge EW, Davis GM, Williams RL. Long-term pulmonary sequelae of severe bronchopulmonary dysplasia. J Pediatr. 1998;133(2):193–200. 10.1016/s0022-3476(98)70220-3. - PubMed
MeSH terms
Substances
Grants and funding
LinkOut - more resources
Full Text Sources

