

Comparative analysis of alignment algorithms for macular optical coherence tomography imaging
- PMID: 37784169
- PMCID: PMC10544468
- DOI: 10.1186/s40942-023-00497-2
Comparative analysis of alignment algorithms for macular optical coherence tomography imaging
Abstract
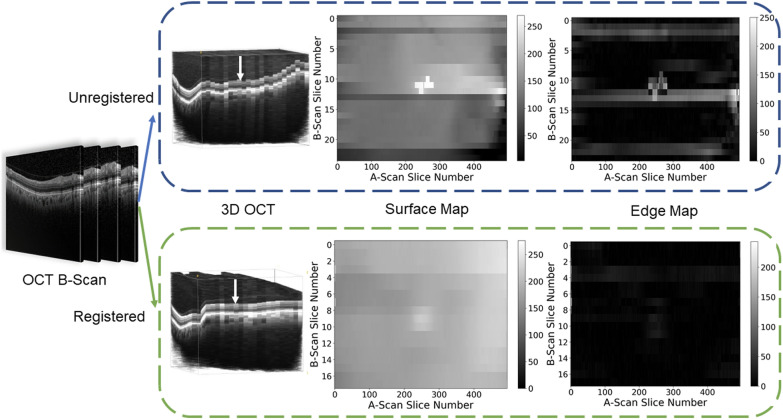
Background: Optical coherence tomography (OCT) is the most important and commonly utilized imaging modality in ophthalmology and is especially crucial for the diagnosis and management of macular diseases. Each OCT volume is typically only available as a series of cross-sectional images (B-scans) that are accessible through proprietary software programs which accompany the OCT machines. To maximize the potential of OCT imaging for machine learning purposes, each OCT image should be analyzed en bloc as a 3D volume, which requires aligning all the cross-sectional images within a particular volume.
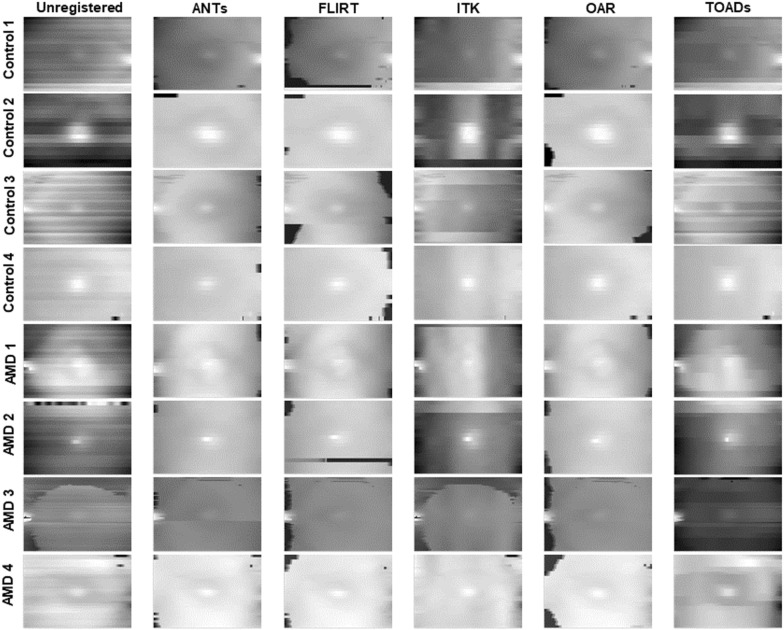
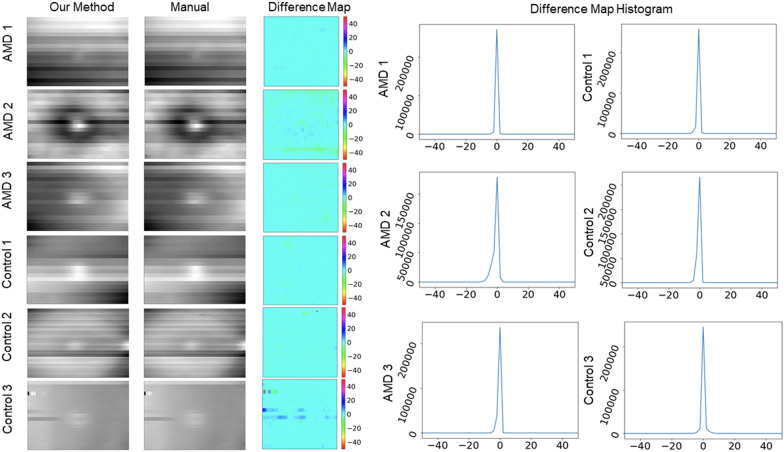
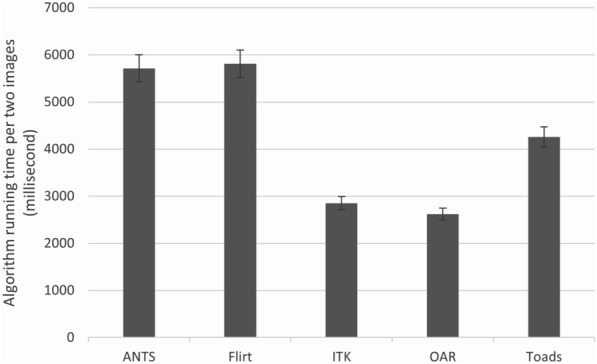
Methods: A dataset of OCT B-scans obtained from 48 age-related macular degeneration (AMD) patients and 50 normal controls was used to evaluate five registration algorithms. After alignment of B-scans from each patient, an en face surface map was created to measure the registration quality, based on an automatically generated Laplace difference of the surface map-the smoother the surface map, the smaller the average Laplace difference. To demonstrate the usefulness of B-scan alignment, we trained a 3D convolutional neural network (CNN) to detect age-related macular degeneration (AMD) on OCT images and compared the performance of the model with and without B-scan alignment.
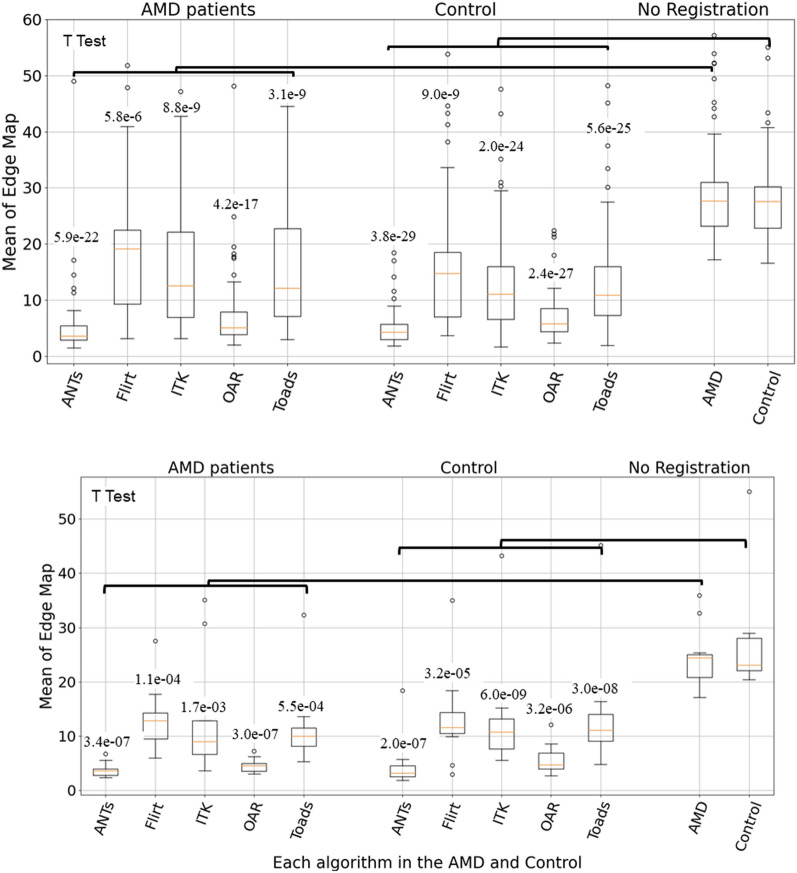
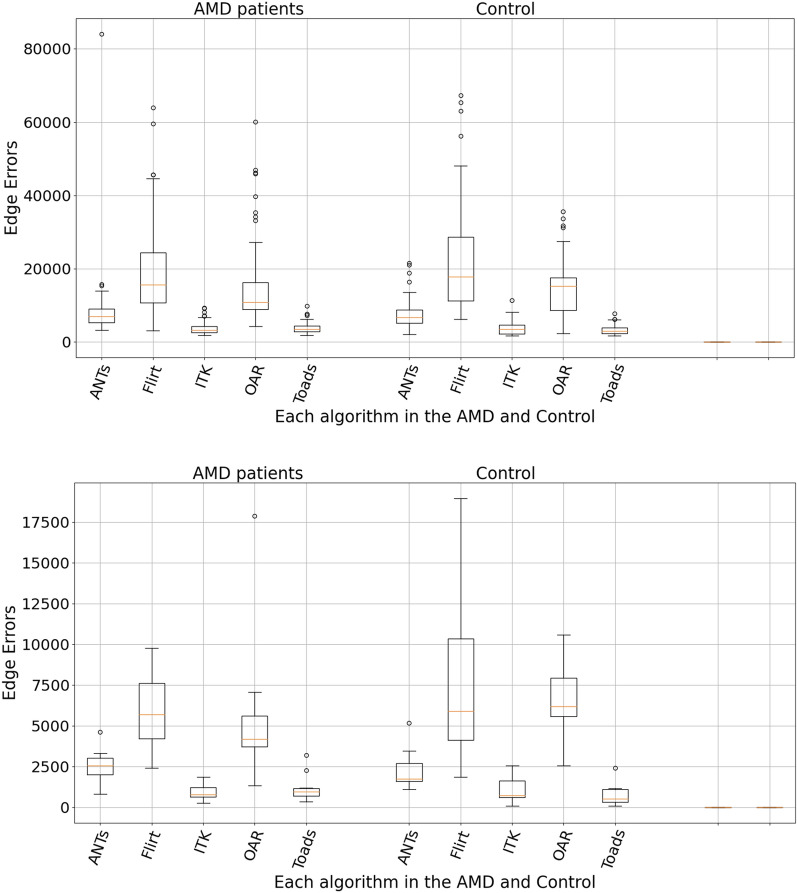
Results: The mean Laplace difference of the surface map before registration was 27 ± 4.2 pixels for the AMD group and 26.6 ± 4 pixels for the control group. After alignment, the smoothness of the surface map was improved, with a mean Laplace difference of 5.5 ± 2.7 pixels for Advanced Normalization Tools Symmetric image Normalization (ANTs-SyN) registration algorithm in the AMD group and a mean Laplace difference of 4.3 ± 1.4.2 pixels for ANTs in the control group. Our 3D CNN achieved superior performance in detecting AMD, when aligned OCT B-scans were used (AUC 0.95 aligned vs. 0.89 unaligned).
Conclusions: We introduced a novel metric to quantify OCT B-scan alignment and compared the effectiveness of five alignment algorithms. We confirmed that alignment could be improved in a statistically significant manner with readily available alignment algorithms that are available to the public, and the ANTs algorithm provided the most robust performance overall. We further demonstrated that alignment of OCT B-scans will likely be useful for training 3D CNN models.
Keywords: Age-related macular degeneration; B-scans; Image alignment; Image registration; Optical coherence tomography.
© 2023. Brazilian Retina and Vitreous Society.
Conflict of interest statement
The authors declare that they have no competing interests.
Figures
Similar articles
-
Automatic diagnosis of macular diseases from OCT volume based on its two-dimensional feature map and convolutional neural network with attention mechanism.J Biomed Opt. 2020 Sep;25(9):096004. doi: 10.1117/1.JBO.25.9.096004. J Biomed Opt. 2020. PMID: 32940026 Free PMC article.
-
Optical Coherence Tomography-Based Deep-Learning Models for Classifying Normal and Age-Related Macular Degeneration and Exudative and Non-Exudative Age-Related Macular Degeneration Changes.Ophthalmol Ther. 2019 Dec;8(4):527-539. doi: 10.1007/s40123-019-00207-y. Epub 2019 Aug 12. Ophthalmol Ther. 2019. PMID: 31407214 Free PMC article.
-
Detection of Nonexudative Macular Neovascularization on Structural OCT Images Using Vision Transformers.Ophthalmol Sci. 2022 Jul 8;2(4):100197. doi: 10.1016/j.xops.2022.100197. eCollection 2022 Dec. Ophthalmol Sci. 2022. PMID: 36531577 Free PMC article.
-
En-face optical coherence tomography in the diagnosis and management of age-related macular degeneration and polypoidal choroidal vasculopathy.Indian J Ophthalmol. 2015 May;63(5):378-83. doi: 10.4103/0301-4738.159860. Indian J Ophthalmol. 2015. PMID: 26139796 Free PMC article. Review.
-
Expanding Application of Optical Coherence Tomography Beyond the Clinic: A Narrative Review.Diagnostics (Basel). 2025 Apr 29;15(9):1140. doi: 10.3390/diagnostics15091140. Diagnostics (Basel). 2025. PMID: 40361958 Free PMC article. Review.
Cited by
-
Artificial intelligence for diagnosing exudative age-related macular degeneration.Cochrane Database Syst Rev. 2024 Oct 17;10(10):CD015522. doi: 10.1002/14651858.CD015522.pub2. Cochrane Database Syst Rev. 2024. PMID: 39417312
-
Adaptive Curved Slicing for En Face Imaging in Optical Coherence Tomography.Sensors (Basel). 2025 Jul 10;25(14):4329. doi: 10.3390/s25144329. Sensors (Basel). 2025. PMID: 40732457 Free PMC article.
References
-
- Huettel SA, Song AW, McCarthy G. Functional magnetic resonance imaging. Sunderland: Sinauer Associates; 2004.
LinkOut - more resources
Full Text Sources
Research Materials
Miscellaneous
