

Risk factors and healthcare costs associated with long bone fracture non-union: a retrospective US claims database analysis
- PMID: 37784206
- PMCID: PMC10546674
- DOI: 10.1186/s13018-023-04232-3
Risk factors and healthcare costs associated with long bone fracture non-union: a retrospective US claims database analysis
Abstract
Background: Few contemporary US-based long bone non-union analyses have recently been published. Our study was designed to provide a current understanding of non-union risks and costs, from the payers' perspective.
Methods: The Merative™ MarketScan® Commercial Claims and Encounters database was used. Patients with surgically treated long bone (femur, tibia, or humerus) fractures in the inpatient setting, from Q4 2015 to most recent, were identified. Exclusion criteria included polytrauma and amputation at index. The primary outcome was a diagnosis of non-union in the 12 and 24 months post-index. Additional outcomes included concurrent infection, reoperation, and total healthcare costs. Age, gender, comorbidities, fracture characteristics, and severity were identified for all patients. Descriptive analyses were performed. Crude and adjusted rates of non-union (using Poisson regressions with log link) were calculated. Marginal incremental cost of care associated with non-union and infected non-union and reoperation were estimated using a generalized linear model with log link and gamma distribution.
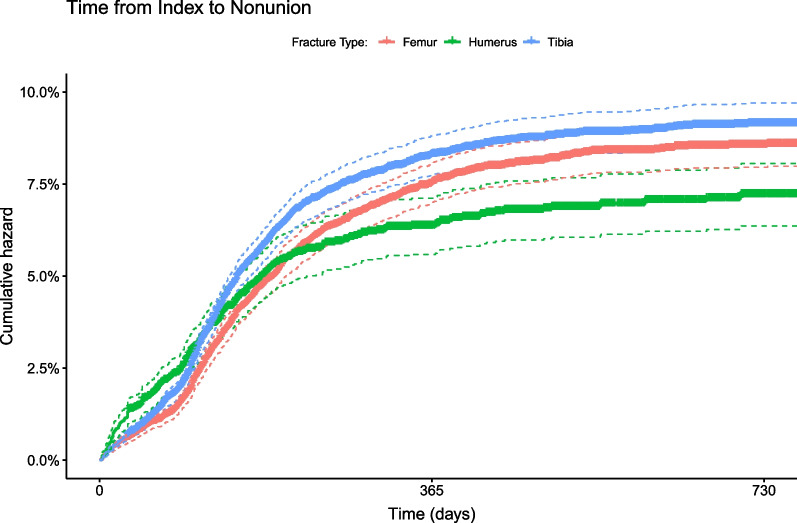
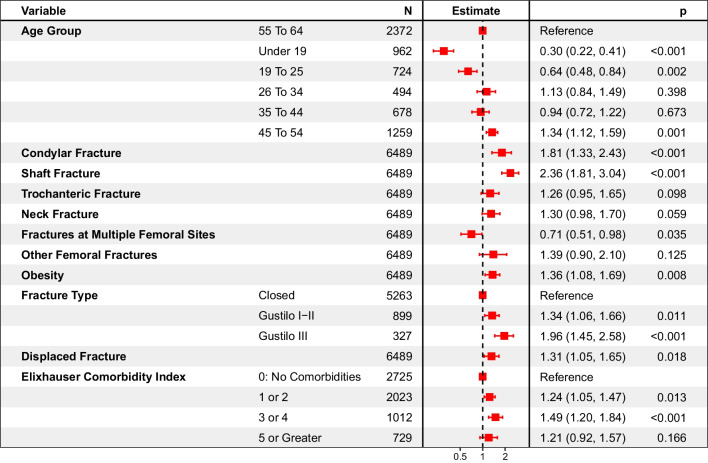
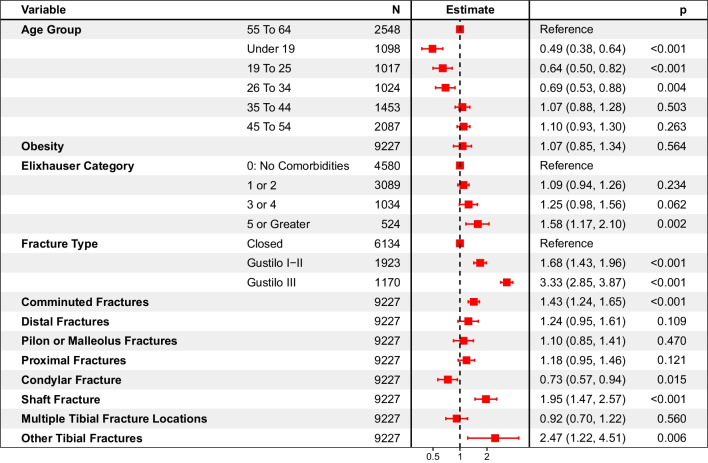
Results: A total of 12,770, 13,504, and 4,805 patients with femoral, tibial, or humeral surgically treated fractures were identified, 74-89% were displaced, and 18-27% were comminuted. Two-year rates of non-union reached 8.5% (8.0%-9.1%), 9.1% (8.6%-9.7%), and 7.2% (6.4%-8.1%) in the femoral, tibial, and humeral fracture cohorts, respectively. Shaft fractures were at increased risk of non-union versus fractures in other sites (risk ratio (RR) in shaft fractures of the femur: 2.36 (1.81-3.04); tibia: 1.95 (1.47-2.57); humerus: 2.02 (1.42-2.87)). Fractures with severe soft tissue trauma (open vs. closed, Gustilo III vs. Gustilo I-II) were also at increased risk for non-union (RR for Gustilo III fracture (vs. closed) for femur: R = 1.96 (1.45-2.58), for tibia: 3.33 (2.85-3.87), RR for open (vs. closed) for humerus: 1.74 (1.30-2.32)). For all fractures, younger patients had a reduced risk of non-union compared to older patients. For tibial fractures, increasing comorbidity (Elixhauser Index 5 or greater) was associated with an increased risk of non-union. The two-year marginal cost of non-union ranged from $33K-$45K. Non-union reoperation added $16K-$34K in incremental costs. Concurrent infection further increased costs by $46K-$86K.
Conclusions: Non-union affects 7-10% of surgically treated long bone fracture cases. Shaft and complex fractures were at increased risk for non-union.
Keywords: Bone fractures; Cost analysis; Fractures; Non-union; Risk factors.
© 2023. BioMed Central Ltd., part of Springer Nature.
Conflict of interest statement
MFV, JWR and CEH are employees of Johnson & Johnson. MV and MB are employees of DePuy Synthes, a Johnson & Johnson Company.
Figures

References
MeSH terms
LinkOut - more resources
Full Text Sources
Medical
