[Preprint]. 2023 Sep 22:2023.09.19.558483.
doi: 10.1101/2023.09.19.558483.

AgRP neuron activity promotes associations between sensory and nutritive signals to guide flavor preference

Affiliations

AgRP neuron activity promotes associations between sensory and nutritive signals to guide flavor preference

Nathaniel T Nyema et al. bioRxiv. .

Update in

Abstract

Objective: The learned associations between sensory cues (e.g., taste, smell) and nutritive value (e.g., calories, post-ingestive signaling) of foods powerfully influences our eating behavior [1], but the neural circuits that mediate these associations are not well understood. Here, we examined the role of agouti-related protein (AgRP)-expressing neurons - neurons which are critical drivers of feeding behavior [2; 3] - in mediating flavor-nutrient learning (FNL).

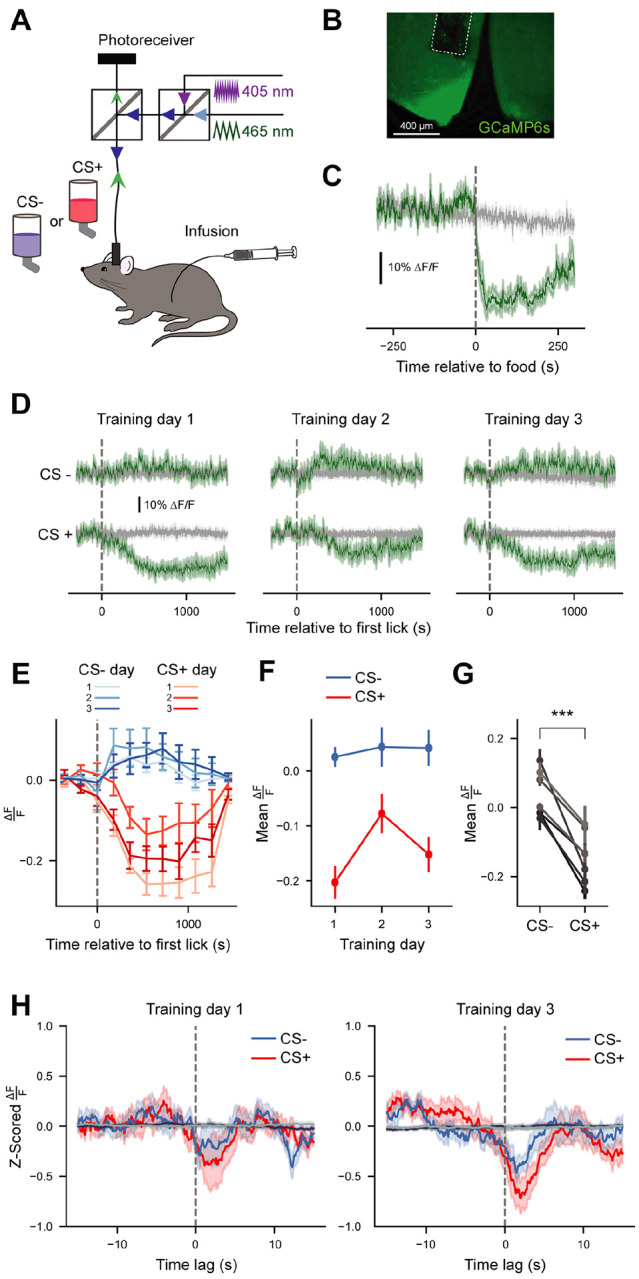
Methods: Because mice prefer flavors associated with AgRP neuron activity suppression [4], we examined how optogenetic stimulation of AgRP neurons during intake influences FNL, and used fiber photometry to determine how endogenous AgRP neuron activity tracks associations between flavors and nutrients.

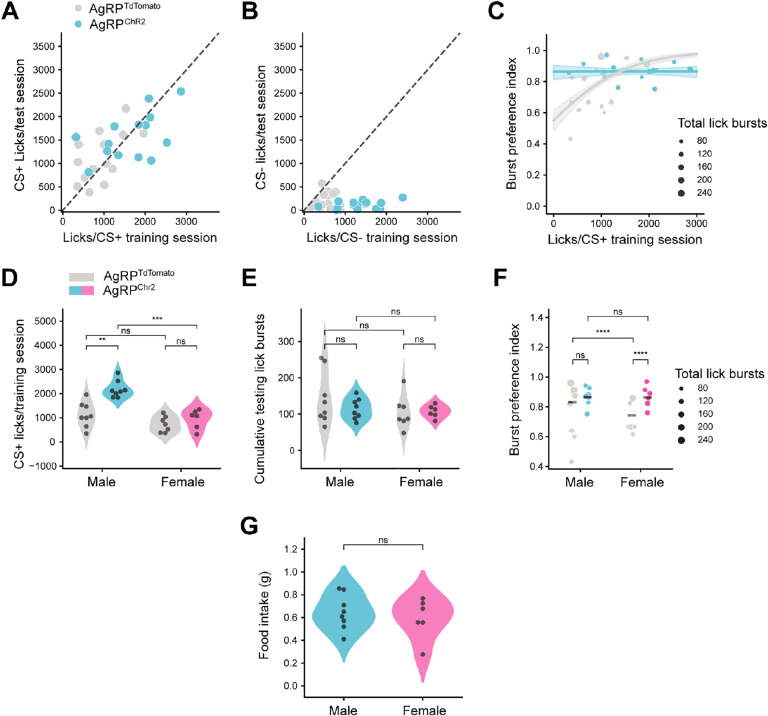
Results: We unexpectedly found that tonic activity in AgRP neurons during FNL potentiated, rather than prevented, the development of flavor preferences. There were notable sex differences in the mechanisms for this potentiation. Specifically, in male mice, AgRP neuron activity increased flavor consumption during FNL training, thereby strengthening the association between flavors and nutrients. In female mice, AgRP neuron activity enhanced flavor-nutrient preferences independently of consumption during training, suggesting that AgRP neuron activity enhances the reward value of the nutrient-paired flavor. Finally, in vivo neural activity analyses demonstrated that acute AgRP neuron dynamics track the association between flavors and nutrients in both sexes.

Conclusions: Overall, these data (1) demonstrate that AgRP neuron activity enhances associations between flavors and nutrients in a sex-dependent manner and (2) reveal that AgRP neurons track and update these associations on fast timescales. Taken together, our findings provide new insight into the role of AgRP neurons in assimilating sensory and nutritive signals for food reinforcement.

Keywords: AgRP; fiber photometry; flavor-nutrient learning; gut-brain signaling; optogenetics.


Conflict of interest statement

Declarations of interest: None

Figures

Figure 1.
Figure 1.. AgRP neuron activity potentiates flavor-nutrient learning
(A) Schematic for AgRP neuron stimulation: optogenetic activation of AgRP neurons (AgRPChR2) was used to prevent inhibition of AgRP neurons during infusion of nutrients (glucose) in (D). (B) Schematic of brain stimulation and representative images of Fos expression in control and AgRPChR2 mice. (C) Food intake in AgRPChR2 mice with and without optogenetic stimulation (n=14). Paired t-test, t(13) = −13.857, p<0.0001. Bar graph represents mean. (D) Simplified schematic of flavor-nutrient learning (FNL) protocol. Mice received a 10-min gastric infusion of nutrients (glucose) or water triggered by 20 flavor licks (at time=t20). See Figure S1 and Methods for detailed protocol. (E) Average number of licks per test session following FNL protocol in control (AgRPtdTomato) (n=15) and experimental (AgRPChR2) (n=14) mice. Mixed ANOVA, Chr2: F(1,27)=3.506, p=ns; CS: F(1,27)=132.518, p<0.0001; Chr2*CS: F(1,27)=6.673, p<0.05. (F) Total number of CS+ and CS− licks in test sessions in control (AgRPtdTomato) (n=15) and experimental (AgRPChR2) (n=14) mice. T-test, t(27) = 1.853, p=ns. (G) Preference index (proportion of CS+ licks during testing, see Methods for details) from test sessions in control (AgRPtdTomato) (n=15) and experimental (AgRPChR2) (n=14) mice. Mann-Whitney U Test, U=152, p<0.05. *p<0.05, **p<0.01, ***p<0.001, ****p<0.0001.
Figure 2.
Figure 2.. Binomial regression modeling reveals sex differences in the effect of AgRP neuron stimulation on flavor-nutrient learning
(A) Correlation between the average number of CS+ licks during training and testing in control (AgRPtdTomato) (n=15) and experimental (AgRPChR2) (n=14) mice. Pearson R, R=.636, p<0.01. (B) Correlation between the average number of CS− licks during training and testing in control (AgRPtdTomato) and experimental (AgRPChR2) mice. Pearson R, R=−.224, p=ns. (C) Relationship between average CS+ training licks and burst preference index (from testing) in control (AgRPtdTomato) and experimental (AgRPChR2) mice. Cox-Snell R2=.980. Shaded region represented 95% confidence interval. (D) Average number of licks per training session during FNL protocol in male and female control (AgRPtdTomato) (male: n=8, female: n=7) and experimental (AgRPChR2) (male: n=8, female: n=6) mice. 2-way ANOVA, sex: F(1,25)=27.073, p<0.0001; Chr2: F(1,25)=20.333, p<0.001; sex*Chr2: F(1,25)=7.517, p<0.05. (E) Total number of CS+ and CS− licks in test sessions in male and female control (AgRPtdTomato) (male: n=8, female: n=7) and experimental (AgRPChR2) (male: n=8, female: n=6) mice. 2-way ANOVA, sex: F(1,25)=1.701, p=ns; Chr2: F(1,25)=0.694, p=ns; sex*Chr2: F(1,25)=0.711, p=ns. (F) Burst preference index (see Methods for details) from test sessions in male and female control (AgRPtdTomato) (male: n=8, female: n=7) and experimental (AgRPChR2) (male: n=8, female: n=6) mice. Lines represent the weighted average within the group, where weights were the corresponding number of lick bursts. Sequential Analysis of Deviance on the Binomial GLM ‘pref ~ sex*Chr2’ with total lick bursts corresponding to each preference passed as frequency weights, sex: χ2(1, 27) = 311.492, p<0.001; Chr2: χ2(1, 26) = 282.295, p<0.0001; sex*Chr2: χ2(1, 25) = 274.644, p<0.01 (G) AgRP neuron stimulation-evoked food intake (1 h) in male (n=8) and female mice (n=6). T-test, t(12)=−0.577, p=ns. *p<0.05, **p<0.01, ***p<0.001, ****p<0.0001.
Figure 3.
Figure 3.. AgRP neuron stimulation increases flavor-nutrient learning independently of training licks in female but not male mice
(A) Average number of licks per training session during limited-intake FNL protocol in control (AgRPtdTomato) (n=19) and experimental (AgRPChR2) (n=18) mice. Mixed ANOVA, Chr2: F(1,35)=0.262, p=ns; CS: F(1,35)=30.052, p<0.0001; Chr2*CS: F(1,35)=0.830, p=ns. Bar graphs represent data mean. (B) Average number of licks per test session following limited-intake FNL protocol in control (AgRPtdTomato) (n=19) and experimental (AgRPChR2) (n=18) mice. Mixed ANOVA, Chr2: F(1,35)=0.002, p=ns; CS: F(1,35)=32.737, p<0.0001; Chr2*CS: F(1,35)=0.251, p=ns. (C) Total number of CS+ and CS− licks in test sessions in control (AgRPtdTomato) (n=19) and experimental (AgRPChR2) (n=18) mice during limited-access FNL protocol. T-test, t(35)=0.045, p=ns. (D) Preference index from test sessions in control (AgRPtdTomato) (n=19) and experimental (AgRPChR2) (n=18) mice following limited-access FNL protocol. Mann-Whitney U-test, U=178, p=ns. (E) Total number of CS+ and CS− licks in test sessions in male and female control (AgRPtdTomato) (male: n=9, female: n=10) and experimental (AgRPChR2) (male: n=9, female: n=9) mice following limited-access FNL protocol. 2-way ANOVA, sex: F(1,33)=4.480, p<0.05; Chr2: F(1,33)=7.533, p<.01; sex*ChR2: F(1,33)=0.015, p=ns. (F) Burst preference index from test sessions in male and female control (AgRPtdTomato) (n=19) and experimental (AgRPChR2) (n=18) mice following limited-access FNL protocol. Lines represent the weighted average within the group, where weights were the corresponding number of lick bursts. Sequential Analysis of Deviance on the Binomial GLM ‘pref ~ sex*Chr2’ with total lick bursts corresponding to each preference passed as frequency weights, sex: χ2(1, 35) =582.495, p<.001; Chr2: χ2(1, 34) = 582.413, p=ns; sex*Chr2: χ2(1, 33) = 562.258, p<0.0001 *p<0.05, **p<0.01, ***p<0.001, ****p<0.0001.
Figure 4.
Figure 4.. AgRP neurons track associations between sensory cues and nutrients on short timescales during FNL training
(A) Schematic of fiber photometry setup during FNL training sessions. (B) Representative image of GCaMP expression in AgRP neurons of the arcuate nucleus. (C) Average ΔFF of GCaMP6s signals from AgRP neurons in response to refeeding after an overnight fast (n=7). Green trace, 465-nm calcium-dependent wavelength; gray trace, 405-nm calcium-independent (isosbestic) wavelength. (D) Average ΔFF of GCaMP6s signals from AgRP neurons during all training sessions of FNL. Individual traces are aligned to the time of the first lick (n=7). (E) Data from (D), 465-nm signal, binned in 3-min intervals (n=7, see Table S1 for 3-way Repeated Measures ANOVA table). (F) Average mean ΔFF of 465-nm signal from the time of the first lick until the end of each training session across days (n=7). 2-way Repeated Measures ANOVA, day: F(2, 12)=7.353, p<0.05; CS: F(1,6)=47.349, p<0.01; day*CS: F(2,12)=11.104, p<0.01. (G) Average mean ΔFF of 465-nm signal from the time of the first lick until the end of sessions averaged across training days. Paired T-test, t(6) = −6.881, p<0.01. (H) Mean bout-triggered average 465-nm responses across training for CS+ (red traces) and CS− (blue traces) sessions. Bout-triggered averages computed from randomly generated lick bouts are shown in dark purple (for CS+) and gray (for CS−). ANOVA on Linear Mixed Effects Model, time*day*CS: F(8, 13922.777)=4.509, p<0.0001 (see Table S1 for full ANOVA table). All data are expressed as mean ± SEM. *p<0.05, **p<0.01, ***p<0.001, ****p<0.0001.
Figure 5.
Figure 5.. Enhanced acute AgRP responses to CS+ flavors extinguish in the absence of post-ingestive signaling
(A) Schematic of fiber photometry setup during FNL testing sessions. (B) Average CS− and CS+ licks per testing session (n=7). Paired T test, t(6) = 6.857, p<0.01. (C) Preference indices for all mice during testing (n=7). (D) Average ΔFF of GCaMP6s signals from AgRP neurons during FNL testing sessions. Individual traces are aligned to the time of the first lick (n=7). Green traces, 465-nm calcium-dependent wavelength; gray traces, 405-nm calcium-independent (isosbestic) wavelength. (E) Mean bout-triggered average responses for both days of testing for CS+ (red traces) and CS− (blue traces) bouts (see Table S1 for ANOVA table) [n=4, mice with too few (< 3) CS− lick bouts during testing were excluded from analyses to ensure that lick bout averages were robust and representative]. Bout-triggered averages computed from randomly generated lick bouts are shown in gray. Data are expressed as mean ± SEM. *p<0.05, **p<0.01, ***p<0.001, ****p<0.0001.

Similar articles

References

    1. Berthoud H.R., Morrison C.D., Ackroff K., Sclafani A., 2021. Learning of food preferences: mechanisms and implications for obesity & metabolic diseases. Int J Obes (Lond) 45(10):2156–2168. - PMC - PubMed
    1. Aponte Y., Atasoy D., Sternson S.M., 2011. AGRP neurons are sufficient to orchestrate feeding behavior rapidly and without training. Nat Neurosci 14(3):351–355. - PMC - PubMed
    1. Krashes M.J., Koda S., Ye C., Rogan S.C., Adams A.C., Cusher D.S., et al., 2011. Rapid, reversible activation of AgRP neurons drives feeding behavior in mice. J Clin Invest 121(4):1424–1428. - PMC - PubMed
    1. Betley J.N., Xu S., Cao Z.F.H., Gong R., Magnus C.J., Yu Y., et al., 2015. Neurons for hunger and thirst transmit a negative-valence teaching signal. Nature 521(7551):180–185. - PMC - PubMed
    1. Rolls E.T., 2011. Taste, olfactory and food texture reward processing in the brain and obesity. Int J Obes (Lond) 35(4):550–561. - PubMed

Publication types