[Preprint]. 2023 Sep 22:2023.09.20.558462.
doi: 10.1101/2023.09.20.558462.

A spatially mapped gene expression signature for intestinal stem-like cells identifies high-risk precursors of gastric cancer

Affiliations

A spatially mapped gene expression signature for intestinal stem-like cells identifies high-risk precursors of gastric cancer

Robert J Huang et al. bioRxiv. .

Update in

Abstract

Objective: Gastric intestinal metaplasia (GIM) is a precancerous lesion that increases gastric cancer (GC) risk. The Operative Link on GIM (OLGIM) is a combined clinical-histopathologic system to risk-stratify patients with GIM. The identification of molecular biomarkers that are indicators for advanced OLGIM lesions may improve cancer prevention efforts.

Methods: This study was based on clinical and genomic data from four cohorts: 1) GAPS, a GIM cohort with detailed OLGIM severity scoring (N=303 samples); 2) the Cancer Genome Atlas (N=198); 3) a collation of in-house and publicly available scRNA-seq data (N=40), and 4) a spatial validation cohort (N=5) consisting of annotated histology slides of patients with either GC or advanced GIM. We used a multi-omics pipeline to identify, validate and sequentially parse a highly-refined signature of 26 genes which characterize high-risk GIM.

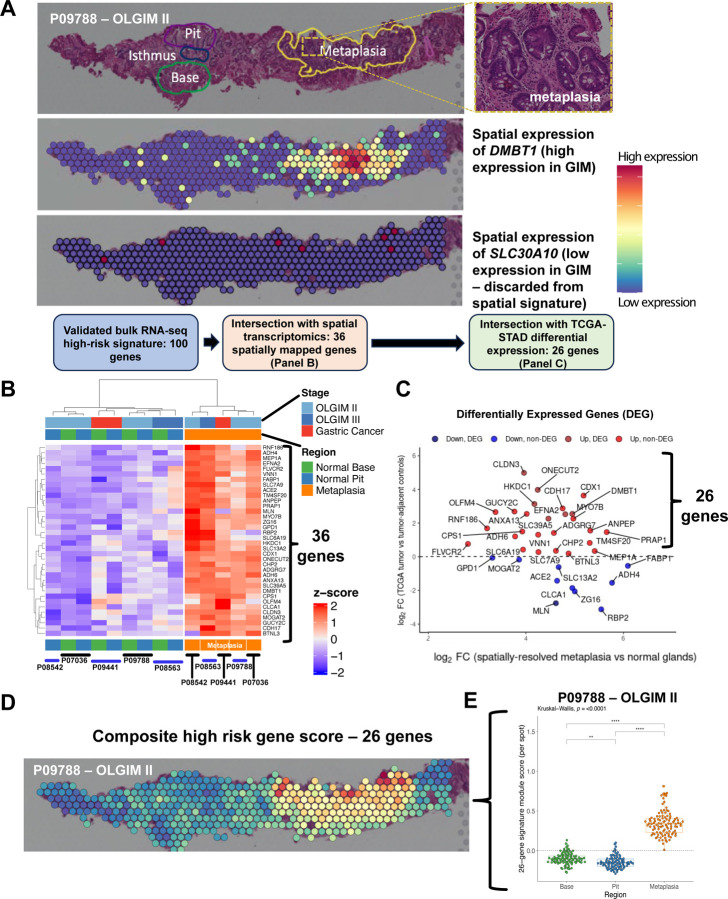
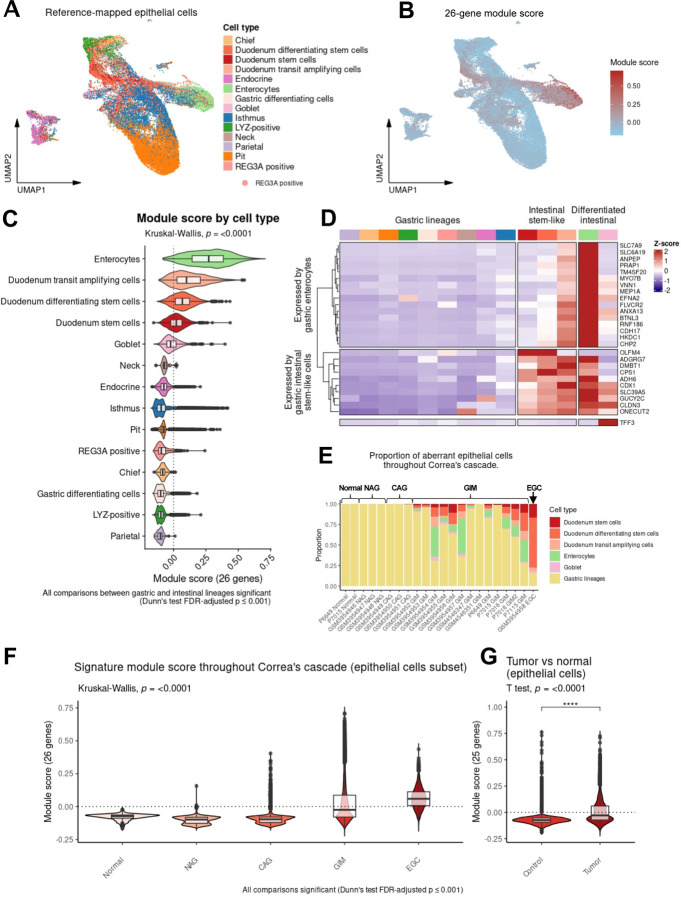
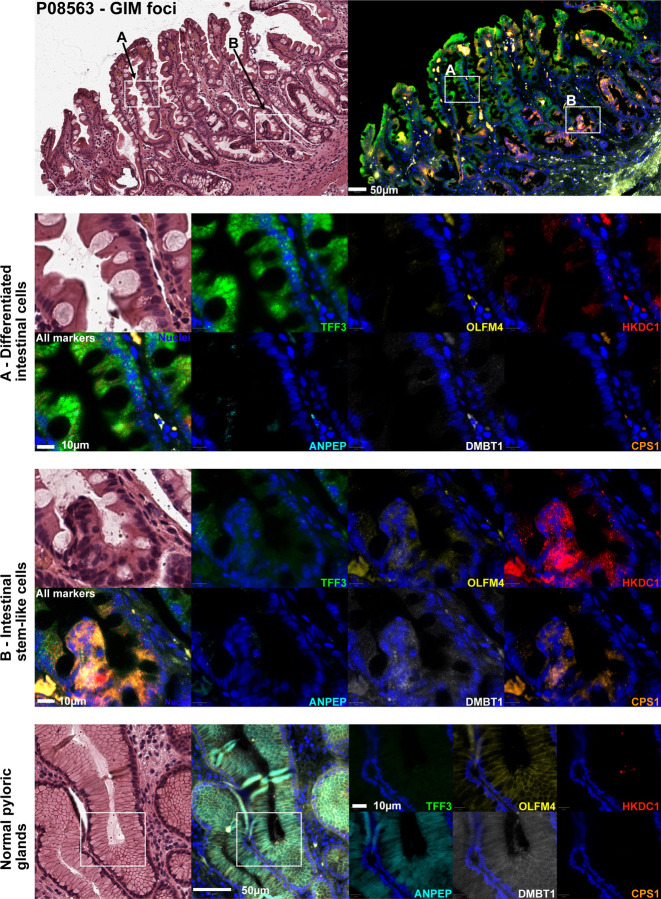
Results: Using standard RNA-seq, we analyzed two separate, non-overlapping discovery (N=88) and validation (N=215) sets of GIM. In the discovery phase, we identified 105 upregulated genes specific for high-risk GIM (defined as OLGIM III-IV), of which 100 genes were independently confirmed in the validation set. Spatial transcriptomic profiling revealed 36 of these 100 genes to be expressed in metaplastic foci in GIM. Comparison with bulk GC sequencing data revealed 26 of these genes to be expressed in intestinal-type GC. Single-cell profiling resolved the 26-gene signature to both mature intestinal lineages (goblet cells, enterocytes) and immature intestinal lineages (stem-like cells). A subset of these genes was further validated using single-molecule multiplex fluorescence in situ hybridization. We found certain genes (TFF3 and ANPEP) to mark differentiated intestinal lineages, whereas others (OLFM4 and CPS1) localized to immature cells in the isthmic/crypt region of metaplastic glands, consistent with the findings from scRNAseq analysis.

Conclusions: using an integrated multi-omics approach, we identified a novel 26-gene expression signature for high-OLGIM precursors at increased risk for GC. We found this signature localizes to aberrant intestinal stem-like cells within the metaplastic microenvironment. These findings hold important translational significance for future prevention and early detection efforts.

Keywords: Intestinal metaplasia; OLGIM; gastric cancer; stem cells.


Conflict of interest statement

Competing interests The authors declare that they have no competing interests.

Figures

Figure 1:
Figure 1:. Overview of study design.
A) Multi-omics flow diagram demonstrating process of discovering and orthogonally validating gene marker panel. At each step, the number of marker genes is shown. B) Representation of the specimens for each step of the multi-omics validation. The GAstric Precancerous conditions Study (GAPS) is a prospective study, incorporating normal controls, low-risk precancerous lesions, high-risk gastric intestinal metaplasia (GIM), and early gastric cancer (GC). High-risk GIM lesions defined as Operative Link on GIM scores III or IV. GAPS specimens drawn equally from antrum (N=153) and body (N=150). A spatial transcriptomics cohort was derived from in-house sources. Bulk RNA-seq data from The Cancer Genome Atlas (TCGA) were used for validation. The scRNA-seq data was obtained both prospectively as well as through secondary analyses of published GIM and GC data sets. NAG, nonatrophic gastritis; CAG, chronic atrophic gastritis. *Immediately adjacent sections from the same tissue samples were used for spatial transcriptomics and smFISH.
Figure 2:
Figure 2:. Discovery and validation of the high-risk expression signature.
A) Heatmap and hierarchical clustering of differentially expressed and co-expressed genes from the discovery cohort of 88 samples, 22 high-risk (defined as OLGIM III-IV) and 66 low-risk (defined as OLGIM 0-II). Most of the high-risk samples clustered distinctly and separately from the low-risk group, regardless of the anatomic site of the biopsy (top dendrogram). A set of genes were found to be both differentially expressed between high- and low-risk samples. Cluster-5 (C-5) represents 105 genes which were selectively upregulated in their expression only in high-risk samples, regardless of anatomic location. B) We found 100 genes from C-5 to be differentially upregulated in the validation cohort (22 high-risk and 193 low-risk samples), confirming a robust signature for high-risk GIM which is agnostic of location. Dotplot depicting over-representation analysis results of these 100 genes: C) gene ontology terms are enriched with intestinal processes (e.g., brush border, intestinal absorption); D) cell type signature gene sets are enriched for mature and immature/fetal intestinal cell types.
Figure 3:
Figure 3:. Spatial resolution of the high-risk signature.
A) An example of the expression profile of DMBT1 upon a Visium slide annotated by a pathologist for areas of normal glandular architecture (base and pit) and metaplasia. DMBT1 is shown as an example of a spatially resolved gene mapping to pathologist-annotated metaplasia, whereas SLC30A10 is shown as an example of a gene not mapping to metaplasia and, thus, discarded form the spatially-resolved signature. B) Heatmap depicting 36 differentially expressed genes from spatial pseudobulk analysis that overlapped with bulk RNA-seq signature. C) Scatter plot showing log2 fold-change of 36 genes from spatial pseudobulk analysis (X-axis) and log2 fold-change from TCGA-STAD RNA-seq analysis. Twenty-six genes overexpressed in both analyses are shown in red. D) Spatial mapping of the refined 26-gene signature onto Visium spots. E) Comparison of 26-gene signature between metaplastic foci vs normal stomach base or pit (Kruskal-Wallis and Dunn test FDR-adjusted p < 0.001). Note: each Visium spot is 55 µm in diameter, with 100 µm distance between the center of adjacent spots.
Figure 4:
Figure 4:. Single-cell identification of cell types expressing the high-risk signature.
A) UMAP plot showing reference-mapped epithelial cells. B) UMAP plot showing module score. C) Comparison of the module score between cell types. D) Heatmap showing the scaled expression of the 26 genes by cell type. The gene dendrogram shows genes expressed primarily by “gastric” enterocytes and another expressed predominantly by “gastric” intestinal stem-like cells. Cells identified as goblet cells expressed TFF3. E) Stacked bar plots depicting the proportion of cell types per sample, ordered by stage of Correa’s cascade. Gastric lineages are aggregated into a single class. F) Comparison of module score across Correa’s cascade (p<0.001 for all comparisons). G) Comparison of the module score between GC and tumor-adjacent control tissues (p<0.0001).
Figure 5:
Figure 5:. Single-molecule fluorescence in situ hybridization (smFISH) of gastric intestinal metaplasia.
Representative region showing H&E staining and smFISH for 6 genes in a GIM foci: TFF3, HKDC1, DMBT1, OLFM4, CPS1, and ANPEP. A) Areas of mature intestinal cells demonstrated robust expression of TFF3 (goblet cells) and ANPEP (enterocytes). B) Other genes (OLFM4, DMBT1, CPS1, HKDC1) localized to columnar cells near the isthmic/crypt regions in the metaplastic glands (intestinal stem-like cells). The expression of these genes was mutually exclusive, in space, from the mature markers. C) Representative normal gland showing that genes from the signature are not expressed by normal gastric lineages.

References

    1. Sung H. et al. Global Cancer Statistics 2020: GLOBOCAN Estimates of Incidence and Mortality Worldwide for 36 Cancers in 185 Countries. CA Cancer J Clin 71, 209–249 (2021). https://doi.org: 10.3322/caac.21660 - DOI - PubMed
    1. Allemani C. et al. Global surveillance of trends in cancer survival 2000–14 (CONCORD-3): analysis of individual records for 37 513 025 patients diagnosed with one of 18 cancers from 322 population-based registries in 71 countries. Lancet 391, 1023–1075 (2018). https://doi.org: 10.1016/S0140-6736(17)33326-3 - DOI - PMC - PubMed
    1. Correa P. Human gastric carcinogenesis: a multistep and multifactorial process--First American Cancer Society Award Lecture on Cancer Epidemiology and Prevention. Cancer Res 52, 6735–6740 (1992). - PubMed
    1. Hwang Y. J. et al. Reversibility of atrophic gastritis and intestinal metaplasia after Helicobacter pylori eradication - a prospective study for up to 10 years. Aliment Pharmacol Ther 47, 380–390 (2018). https://doi.org: 10.1111/apt.14424 - DOI - PubMed
    1. Ito M. et al. Clinical prevention of gastric cancer by Helicobacter pylori eradication therapy: a systematic review. J Gastroenterol 44, 365–371 (2009). https://doi.org: 10.1007/s00535-009-0036-8 - DOI - PubMed

Publication types