[Preprint]. 2023 Aug 27:2023.08.25.554815.
doi: 10.1101/2023.08.25.554815.

The genome of the colonial hydroid Hydractinia reveals their stem cells utilize a toolkit of evolutionarily shared genes with all animals

Affiliations

The genome of the colonial hydroid Hydractinia reveals their stem cells utilize a toolkit of evolutionarily shared genes with all animals

Christine E Schnitzler et al. bioRxiv. .

Update in

Abstract

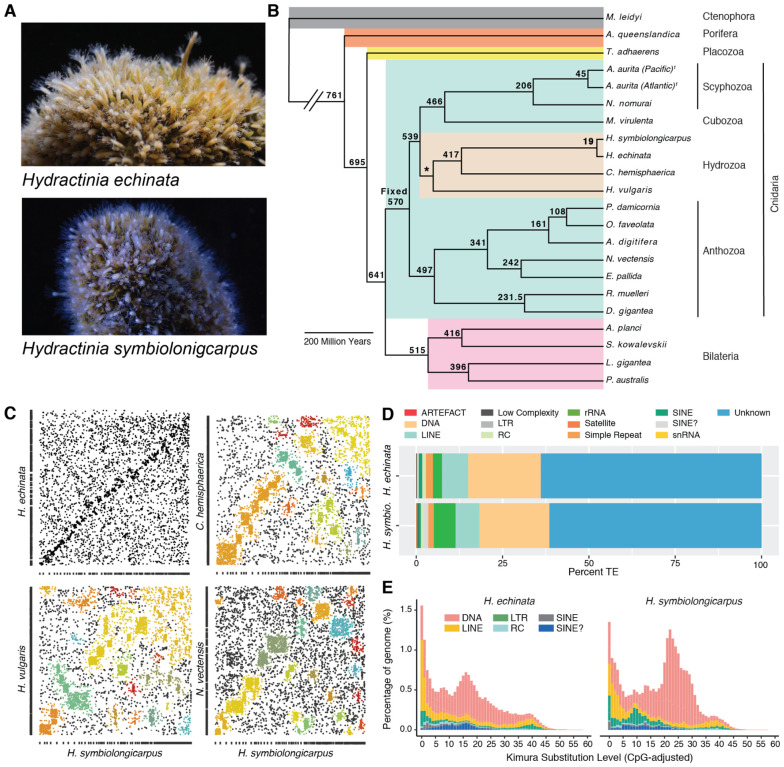
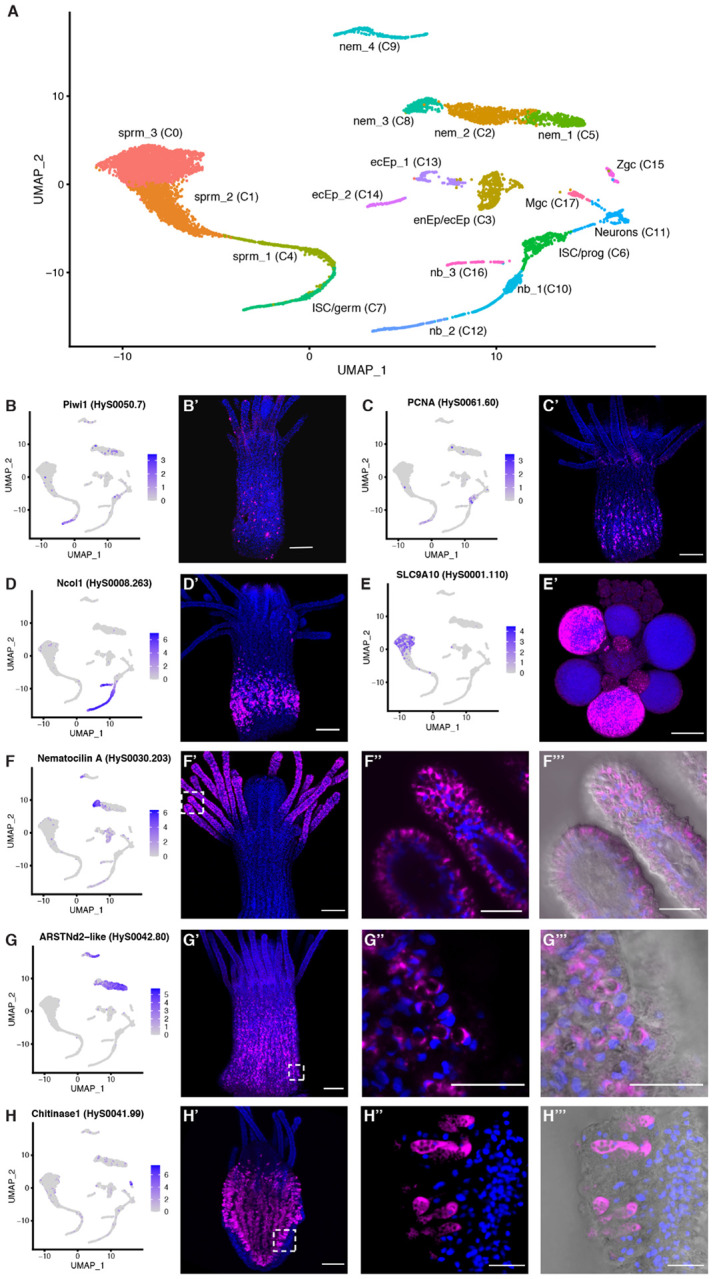
Hydractinia is a colonial marine hydroid that exhibits remarkable biological properties, including the capacity to regenerate its entire body throughout its lifetime, a process made possible by its adult migratory stem cells, known as i-cells. Here, we provide an in-depth characterization of the genomic structure and gene content of two Hydractinia species, H. symbiolongicarpus and H. echinata, placing them in a comparative evolutionary framework with other cnidarian genomes. We also generated and annotated a single-cell transcriptomic atlas for adult male H. symbiolongicarpus and identified cell type markers for all major cell types, including key i-cell markers. Orthology analyses based on the markers revealed that Hydractinia's i-cells are highly enriched in genes that are widely shared amongst animals, a striking finding given that Hydractinia has a higher proportion of phylum-specific genes than any of the other 41 animals in our orthology analysis. These results indicate that Hydractinia's stem cells and early progenitor cells may use a toolkit shared with all animals, making it a promising model organism for future exploration of stem cell biology and regenerative medicine. The genomic and transcriptomic resources for Hydractinia presented here will enable further studies of their regenerative capacity, colonial morphology, and ability to distinguish self from non-self.


Conflict of interest statement

Competing interests: The authors declare no competing financial interests.

Figures

Figure 1:
Figure 1:
Overview of Hydractinia, phylogenetic analysis, synteny analysis, and analysis of repetitive elements. (A) Hydractinia echinata colony (top panel); Hydractinia symbiolongicarpus colony (bottom panel). (B) Maximum likelihood phylogeny estimated from a data set of single copy orthologs as inferred by Orthofinder2 showing that the two Hydractinia species cluster together with C. hemisphaerica and H. vulgaris branching next to them within the Hydrozoa. Divergence times were estimated using the r8s program. The age of Cnidaria was fixed at 570 MYA and the age of Hydrozoa constrained to 500 MYA based upon Cartwright and Collins (2007). (C) Syntenic dot plots comparing H. symbiolongicarpus with four cnidarian species: H. echinata; C. hemisphaerica; H. vulgaris; and N.vectensis. Colored boxes indicate linkage groups. (D) Stacked bar chart showing proportions of different transposable elements classes in each Hydractinia genome using RepeatMasker de novo analysis. (E) Repeat landscape analysis showing overall a highly similar evolutionary history of invasion of repetitive elements in the two species. In H. symbiolongicarpus, there was a species-specific recent expansion (at approximately 10% nucleotide substitution) of LTR retrotransposons.
Figure 2:
Figure 2:
Summary of orthogroup evolution across a subset of sampled taxa. Left: Changes in gene family size estimated using CAFE. Pie charts represent changes along the branch leading to a given node or tip for all 8,433 orthogroups inferred to be present in the common ancestor of this tree. Branch lengths are as depicted in Figure 1B. Right: Proportion of input proteome sequences assigned by Orthofinder2 to different orthogroup categories. See Figure S16 for results for every species included in Orthofinder analysis and Table S12 tab SM1 for the number of input sequences in each proteome. The data used to create these figures can be found in Table S12 tabs X.2–3. 1Gold et al. 2019, 2Baltic/Atlantic genome from Khalturin et al. 2019.
Figure 3:
Figure 3:
Genomic organization of Hox and ParaHox genes in five cnidarian genomes. Solid lines sharing homeobox genes represent genomic scaffolds. Scaffold and gene ID numbering in Hydractinia genomes is shown above gene boxes. Broken lines depict homologous cnidarian-specific Hox genes. Alternative gene names are shown above gene boxes for C. hemisphaerica, N. vectensis, and A. digitifera.
Figure 4:
Figure 4:
Hydractinia single-cell atlas represented as a labeled UMAP and validation of several cell type markers using fluorescent in situ hybridization (FISH). (A) Hydractinia single-cell atlas UMAP with 18 clusters (C0-C17). (B-F) UMAP expression of select marker genes (left panels) and spatial expression pattern of marker gene in polyps via FISH (right panel). Blue staining = Hoechst, Pink = marker gene. Piwi1 (B) and PCNA (C) expression in the i-cell band in the middle of the body column of a feeding polyp. (D) Ncol1 expression in nematoblasts in the lower body column of a feeding polyp. (E) SLC9A10 expression in mature sperm cells in gonads of male sexual polyps. (F) Nematocilin A expression in a subset of nematocytes in the tentacles of a feeding polyp. Close up of tentacles in panels 3 and 4 both show higher magnification images from the same polyp as in panel 2, showing expression is specific to cnidocytes. Panel 4 adds DIC. (G) ARSTNd2-like expression in a subset of nematocytes in the body column of a feeding polyp. Panels 3 and 4 both show higher magnification images from the same polyp as in panel 2, showing expression is specific to cnidocytes. Panel 4 adds DIC. (H) Chitinase 1 expression in gland cells in the endodermal epithelial cell layer of a feeding polyp. Panel 3 and 4 both show higher magnification images from the same polyp as in panel 2, showing expression is specific to gland cells. Panel 4 adds DIC. All images shown were projected from confocal stacks. All scale bars = 100 μm. Abbreviations in (A): ecEP: ectodermal epithelial cell, enEP: endodermal epithelial cell, germ: germ cell, ISC: interstitial stem cell, Mgc: mucous gland cell, nb: nematoblast, nem: nematocyte, prog: progenitor, sprm: sperm, Zgc: zymogen gland cell.
Figure 5:
Figure 5:
Results from the lineage-specificity analysis using OrthoFinder2 results and the UMAP cluster marker genes. (A) Stacked bar chart showing the percentage of H. symbiolongicarpus single-cell atlas cluster markers shared among animal phyla. The bottom legend shows eight different categories, dividing the markers into different groups depending on how the orthologs are shared among the species. “Not assigned to orthogroup” represents markers that could not be placed into an orthogroup. The other categories are markers that have at least one homolog between H. symbiolongicarpus and that category, except for the “Symbio-specific” category which represents markers that fell in orthogroups with only H. symbiolongicarpus genes. For example, hypothetical marker gene A from H. symbiolongicarpus would be an “Other multispecies orthogroup” marker if it was found in H. symbiolongicarpus and at least one animal outside of cnidaria, but it would be a “Cnidarian-specific” marker if it was found in H. symbiolongicarpus and at least one cnidarian outside medusozoa. Stacked bars represent the seven major cell types split into nine groups, followed by all individual clusters, and finally the total genes expressed in the Hydractinia single-cell dataset (16,069 genes) and total genes predicted from the Hydractinia genome (22,022 genes). The marker gene count bars on the right indicate how many markers are present in each major cell type and cluster. (B) Histogram dividing the 317 orthogroup-assigned i-cell (clusters 6 and 7) markers by how many are shared by X number of species. Legend is the same as in (A) but the following categories are excluded from this chart: unassigned genes (two genes) and H. symbiolongicarpus-specific genes (none).

References

    1. Beagley CT, Okimoto R, Wolstenholme DR. 1998. The mitochondrial genome of the sea anemone Metridium senile (Cnidaria): introns, a paucity of tRNA genes, and a near-standard genetic code. Genetics 148: 1091–108. - PMC - PubMed
    1. Benson G. 1999. Tandem repeats finder: a program to analyze DNA sequences. Nucleic Acids Research 27: 573–580. - PMC - PubMed
    1. Bermudez-Santana C, Attolini CS-O, Kirsten T, Engelhardt J, Prohaska SJ, Steigele S, Stadler PF. 2010. Genomic organization of eukaryotic tRNAs. BMC Genomics 11: 270. - PMC - PubMed
    1. Bradshaw B, Thompson K, Frank U. 2015. Distinct mechanisms underlie oral vs aboral regeneration in the cnidarian Hydractinia echinata ed. Sánchez Alvarado A.. eLife 4: e05506. - PMC - PubMed
    1. Bridge D, Cunningham CW, Schierwater B, DeSalle R, Buss LW. 1992. Class-level relationships in the phylum Cnidaria: evidence from mitochondrial genome structure. Proc Natl Acad Sci U S A 89: 8750–3. - PMC - PubMed

Publication types