. 2023 Sep 15;4(6):zqad053.
doi: 10.1093/function/zqad053. eCollection 2023.

Inactivation of TRPM7 Kinase Targets AKT Signaling and Cyclooxygenase-2 Expression in Human CML Cells

Affiliations

Inactivation of TRPM7 Kinase Targets AKT Signaling and Cyclooxygenase-2 Expression in Human CML Cells

Birgit Hoeger et al. Function (Oxf). .

Abstract

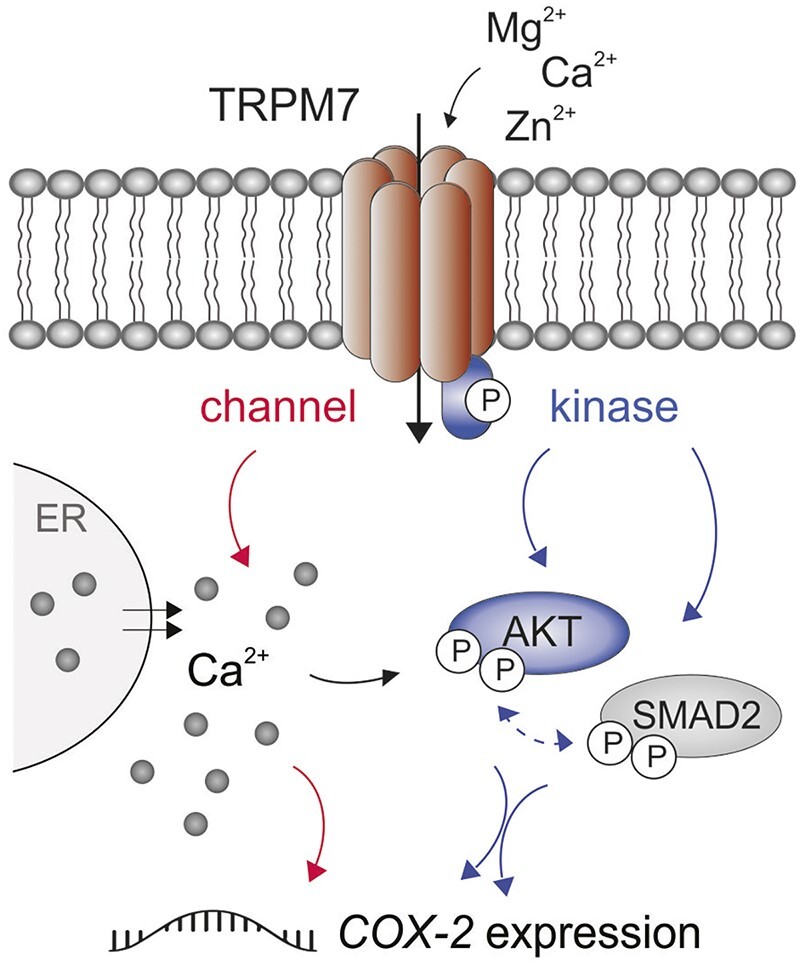
Cyclooxygenase-2 (COX-2) is a key regulator of inflammation. High constitutive COX-2 expression enhances survival and proliferation of cancer cells, and adversely impacts antitumor immunity. The expression of COX-2 is modulated by various signaling pathways. Recently, we identified the melastatin-like transient-receptor-potential-7 (TRPM7) channel-kinase as modulator of immune homeostasis. TRPM7 protein is essential for leukocyte proliferation and differentiation, and upregulated in several cancers. It comprises of a cation channel and an atypical α-kinase, linked to inflammatory cell signals and associated with hallmarks of tumor progression. A role in leukemia has not been established, and signaling pathways are yet to be deciphered. We show that inhibiting TRPM7 channel-kinase in chronic myeloid leukemia (CML) cells results in reduced constitutive COX-2 expression. By utilizing a CML-derived cell line, HAP1, harboring CRISPR/Cas9-mediated TRPM7 knockout, or a point mutation inactivating TRPM7 kinase, we could link this to reduced activation of AKT serine/threonine kinase and mothers against decapentaplegic homolog 2 (SMAD2). We identified AKT as a direct in vitro substrate of TRPM7 kinase. Pharmacologic blockade of TRPM7 in wildtype HAP1 cells confirmed the effect on COX-2 via altered AKT signaling. Addition of an AKT activator on TRPM7 kinase-dead cells reconstituted the wildtype phenotype. Inhibition of TRPM7 resulted in reduced phosphorylation of AKT and diminished COX-2 expression in peripheral blood mononuclear cells derived from CML patients, and reduced proliferation in patient-derived CD34+ cells. These results highlight a role of TRPM7 kinase in AKT-driven COX-2 expression and suggest a beneficial potential of TRPM7 blockade in COX-2-related inflammation and malignancy.

Keywords: AKT signaling; CML; COX-2; TRPM7; channel-kinase.


Conflict of interest statement

The authors declare no conflict of financial interests. S.Z. holds the position of Editorial Board Member for FUNCTION and is blinded from reviewing or making decisions for the manuscript.

Figures

Graphical Abstract
Graphical Abstract
Figure 1.
Figure 1.
TRPM7 protein knockout results in reduced NFAT translocation and COX-2 expression in HAP1 cells. (A) Electrophysiological characterization of TRPM7 currents in TRPM7 WT (black, n = 11) and KO (red, n = 12) HAP1 cells using whole-cell patch clamp. Averaged current densities at +80 and –80 mV are plotted versus time (left, mean ± SEM) and representative current–voltage (I/V) relationships extracted at 200 s are depicted (right). Note the abolished TRPM7 channel activity in KO cells. (B–C) Scatter plots of Mg2+ (B) and Zn2+ (C) ion contents in TRPM7 WT and KO cells assessed via ICP-MS (n = 4). Concentrations are counts of ion over sulfur (S), in ppm. (D) Fura-2 AM-based ratiometric measurements of basal Ca2+ concentrations in resting WT (black, n = 149) and TRPM7 KO (red, n = 82) HAP1 cells. (E) Time course (left) and quantification (right) of Fura 2-AM-based imaging of cellular Ca2+ mobilized from intracellular stores by stimulation with 5 µm thapsigargin (arrow). WT HAP1 cells are shown in black and TRPM7 KO cells in red. Right panel shows area under the curve (AUC) of stimulation response. (F) Western blot (left) and semiquantification (right) of nuclear NFATc1 in lysates of resting or thapsigargin-stimulated TRPM7 WT and KO cells. Normalized to Lamin B1 (n = 13). (G). Intracellular localization of NFATc1 in TRPM7 WT and KO cells, by confocal microscopy. Cells were stimulated with thapsigargin, or left unstimulated (exemplary images, left panel). Quantification gives nuclear NFATc1 stain normalized over DAPI signal (right panels, n = 374–555 cells). Scale bar: 5 μm. (H) Relative COX-2 mRNA expression in WT (black) and TRPM7 KO (red) HAP1 cells, assessed by qRT-PCR. Data were related to respective housekeeping controls and depicted as 2−ΔCT (n = 8–9 triplicates). (I) Relative COX-2 promoter activity in HAP1 WT or TRPM7 KO cells, assessed by a luminescence reporter assay on secreted Lucia luciferase (n = 6). Statistics: Student’s t-test (B, C, F, I) or Mann–Whitney ranks test (D, E, G, H), *P < .05, **P < .005, ***P < .0005, ****P < .00005, and n.s.—not significant. Data are mean ± SD.
Figure 2.
Figure 2.
Targeted inactivation of TRPM7 kinase reduces COX-2 expression without affecting NFAT translocation. (A) Electrophysiological characterization of TRPM7 currents in TRPM7 WT (black, n = 12) and KD (blue, n = 9) HAP1 cells using whole-cell patch clamp. Averaged current densities at +80 and –80 mV are plotted versus time (left, mean ± SEM) and representative current–voltage (I/V) relationships extracted at 200 s are depicted (right). (B–C) Scatter plots of Mg2+ (B) and Zn2+ (C) ion contents in TRPM7 WT and KD cells assessed via ICP-MS and analyzed as in Figure 1B (n = 4). (D) Fura-2 AM-based ratiometric measurements of basal Ca2+ concentrations in resting WT (black, n = 113) and TRPM7 KD (blue, n = 199) HAP1 cells. (E) Time course (left) and quantification (right) of Fura 2-AM-based imaging of Ca2+ mobilized from intracellular stores by stimulation with 5 µm thapsigargin (arrow). WT HAP1 cells are shown in black and TRPM7 KD cells in blue. Right panel shows AUC of stimulation response. (F) Western blot (left) and semiquantification (right) of nuclear NFATc1 in lysates of resting or thapsigargin-stimulated TRPM7 WT and KD cells. Normalized to Lamin B1 (n = 10). (G) NFATc1 localization in TRPM7 WT and KD cells, by confocal microscopy. Cells were stimulated with thapsigargin, or left unstimulated (exemplary images, left panel). Quantification gives nuclear NFATc1 stain normalized over DAPI signal (right panels, n = 331–359 cells). Scale bar: 5 µm. (H) Relative COX-2 mRNA expression in WT (black) and TRPM7 KD (blue) HAP1 cells, assessed by qRT-PCR. Data were related to respective housekeeping controls and depicted as 2−ΔCT (n = 8–9 triplicates). (I) Relative COX-2 promoter activity in HAP1 WT or TRPM7 KD cells, assessed by a luminescence reporter assay on secreted Lucia luciferase (n = 5). Statistics: Student’s t-test (B, C, F, I) or Mann–Whitney ranks test (D, E, G, H), **P < .005, ***P < .0005, ****P < .00005, and n.s.—not significant. Data are mean ± SD.
Figure 3.
Figure 3.
TRPM7 kinase induces COX-2 expression via AKT phosphorylation. (A) Representative Western blot (left) and semiquantification (right) of the basal phosphorylation of AKT (Ser473) in TRPM7 WT versus KO HAP1 lysates. Signals were normalized to respective GAPDH housekeeping controls, depicted as % of WT (n = 8). (B) pAKT (Ser473) levels in pharmacologically treated HAP1 WT cells, assessed by BioPlex technology (n = 4–5). Cells were treated with TRPM7 channel inhibitor NS8593 (NS, red, 30 µm), the K+ channel inhibitor Apamin as control (200 n m), or DMSO control. (C) Relative COX-2 mRNA expression in inhibitor-treated HAP1 WT cells, assessed via qRT-PCR (n = 4–5 triplicates). (D) Representative Western blot (left) and semiquantification (right) of basal pAKT (Ser473) in TRPM7 WT and KD HAP1 lysates. GAPDH was blotted as housekeeping control (n = 10). (E) pAKT (Ser473) levels in HAP1 WT cells treated with TRPM7 kinase/PI3K inhibitor TG100-115 (TG, blue, 20 µm), PI3K inhibitors Eganelisib (EGA, 160 n m) + Nemiralisib (NEM, 100 n m), or DMSO control. BioPlex technology was used (n = 6). (F) Relative COX-2 mRNA expression in inhibitor-treated HAP1 WT cells, assessed via qRT-PCR. Inhibitors as in C (n = 9–10 triplicates). (G) In vitro kinase activity assay of recombinant human TRPM7 protein (titrated) on recombinant inactive AKT1-GST fusion protein (gray) or GST control (white). Phosphorylation was measured after 1 h reaction and converted to relative amount of n m  33P-ATP substrate incorporated. Duplicate experiment. (H) Pharmacologic reconstitution of AKT activation on TRPM7 KD cells. Representative Western blot of pAKT (Ser473) in TRPM7 WT and KD HAP1 cells, cultured with the AKT activator SC79 or vehicle. Lysates were prepared after 21 h serum starvation followed by 1 h serum re-addition plus respective inhibitors, plotted against unstimulated control (Ctrl). GAPDH served as housekeeping control. (I) Pharmacologic reconstitution of COX-2 expression in TRPM7 KD cells. Relative COX-2 mRNA expression was analyzed in TRPM7 WT (black) and KD HAP1 cells (blue), treated with SC79 or DMSO vehicle for 2 h, respectively (n = 5–6). Statistics: Student’s t-test (A, D), one-way ANOVA (B, E), Kruskal–Wallis ranks test or multiple comparison with Dunnett’s correction (C, F, I), *P < .05, **P < .005, ***P < .0005, ****P < .00005, and n.s.—not significant. Data are mean ± SD.
Figure 4.
Figure 4.
TRPM7 blockade decreases COX-2 expression and proliferation of primary human CML cells. (A) Relative expression of COX-2 mRNA in CML patient-derived PBMCs cultured in the presence of inhibitors, analyzed via qRT-PCR. Inhibitors were compared to DMSO control: TRPM7 channel inhibitor NS8593 (NS, red, 30 µm), TRPM7 kinase/PI3K inhibitor TG100-115 (TG, blue, 20 µm), PI3K inhibitors Eganelisib (EGA, 160 n m) + Nemiralisib (NEM, 100 n m). (B) Basal pAKT (Ser473) levels in CML patient-derived PBMCs, assessed via BioPlex technology. Inhibitors as in A (n = 4–5). (C–D) Proliferation experiment of patient-derived CD34+ CML cells cultured in presence of indicated inhibitors (concentrations as in A). Imatinib was used at 1 µm. Cells were stained with ViaCount live/dead marker. For C, dead cell count was plotted after 3 d incubation. For D, live cell counts were plotted for each indicated day, normalized to respective day 0 (left, mean ± SEM). Cell proliferation was calculated as slope of respective data curves, and compared to DMSO control (D, right, n = 3–5). Statistics: one-way ANOVA (B, D), two-way ANOVA (C), or multiple comparisons test with Dunnett’s correction (A), * P < 0.05, **P < 0.005, ***P < 0.005, and n.s.—not significant. Data are mean ± SD.

References

    1. Zierler S, Hampe S, Nadolni W. TRPM channels as potential therapeutic targets against pro-inflammatory diseases. Cell Calcium. 2017;67:105–115. - PubMed
    1. Nadolni W, Zierler S. The channel-kinase TRPM7 as novel regulator of immune system homeostasis. Cells. 2018;7(8):109. - PMC - PubMed
    1. Romagnani A, Vettore V, Rezzonico-Jost T et al. TRPM7 kinase activity is essential for T cell colonization and alloreactivity in the gut. Nat Commun. 2017;8(1):1917. - PMC - PubMed
    1. Nadolni W, Immler R, Hoelting K et al. TRPM7 kinase is essential for neutrophil recruitment and function via regulation of Akt/mTOR signaling. Front Immunol. 2020;11:606893. - PMC - PubMed
    1. Meng S, Alanazi R, Ji D et al. Role of TRPM7 kinase in cancer. Cell Calcium. 2021;96:102400. - PubMed

Publication types

MeSH terms