. 2024 Feb 14;229(2):507-516.
doi: 10.1093/infdis/jiad430.

Diagnosing Viral Infections Through T-Cell Receptor Sequencing of Activated CD8+ T Cells

Affiliations

Diagnosing Viral Infections Through T-Cell Receptor Sequencing of Activated CD8+ T Cells

Alexandra Vujkovic et al. J Infect Dis. .

Abstract

T-cell-based diagnostic tools identify pathogen exposure but lack differentiation between recent and historical exposures in acute infectious diseases. Here, T-cell receptor (TCR) RNA sequencing was performed on HLA-DR+/CD38+CD8+ T-cell subsets of hospitalized coronavirus disease 2019 (COVID-19) patients (n = 30) and healthy controls (n = 30; 10 of whom had previously been exposed to severe acute respiratory syndrome coronavirus 2 [SARS-CoV-2]). CDR3α and CDR3β TCR regions were clustered separately before epitope specificity annotation using a database of SARS-CoV-2-associated CDR3α and CDR3β sequences corresponding to >1000 SARS-CoV-2 epitopes. The depth of the SARS-CoV-2-associated CDR3α/β sequences differentiated COVID-19 patients from the healthy controls with a receiver operating characteristic area under the curve of 0.84 ± 0.10. Hence, annotating TCR sequences of activated CD8+ T cells can be used to diagnose an acute viral infection and discriminate it from historical exposure. In essence, this work presents a new paradigm for applying the T-cell repertoire to accomplish TCR-based diagnostics.

Keywords: COVID-19; NGS-based diagnostics; T cells; TCR sequencing; immunoinformatics; immunology.


Conflict of interest statement

Potential conflicts of interest . B. O., K. L., and P. M. are cofounders, board directors, and shareholders of ImmuneWatch. All authors have submitted the ICMJE Form for Disclosure of Potential Conflicts of Interest. Conflicts that the editors consider relevant to the content of the manuscript have been disclosed.

Figures

Figure 1.
Figure 1.
Characterization of sorted T-cell fractions of coronavirus disease 2019 patient and healthy controls. A, Patient overview. One patient represents 1 line where severity, sex, symptomatic prehospitalization days, days in the hospital, and time points of sampling are shown. Patients are ordered according to duration of symptomatic period. Of 5 patients, a postrecovery sample was analyzed. B. Laboratory method workflow. Study volunteer blood samples were collected from which peripheral blood mononuclear cells were isolated and sorted to obtain T-cell subsets: “activated T cells” (CD3+/CD8+/CD38+/HLA-DR+) and “nonactivated T cells” (CD3+/CD8+/CD38/HLA-DR). RNA from the sorted cells underwent high-throughput T-cell receptor VDJ sequencing. Abbreviations: COVID-19, coronavirus disease 2019; F, female; FACS, fluorescence-activated cell sorting; M, male; PBMC, peripheral blood mononuclear cell; TCR, T-cell receptor; VDJ, variable (V), joining (J), and diversity (D) gene segments.
Figure 2.
Figure 2.
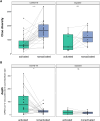
Increased presence of severe acute respiratory syndrome coronavirus 2 (SARS-CoV-2)–associated T-cell receptors (TCRs) in the skewed activated T-cell subset during acute coronavirus disease 2019 (COVID-19). The figure depicts only those patient samples in which both the activated T-cell subset and the nonactivated T-cell subset were analyzed (left: COVID-19 patients, n = 26; right: previously SARS-CoV-2–exposed individuals, n = 10) A, Chao1 diversity (sum of Chao1 index of the CDR3α and CDR3β chains). B, Clonal expansion of SARS-CoV-2–associated T cells expressed as SARS-CoV-2–associated TCR depth (defined as the sum of SARS-CoV-2–associated TCR clones divided by the repertoire size). P values denote paired Student t test. **P ≤ .01; ****P ≤ .0001; ns, not significant (P > .05).
Figure 3.
Figure 3.
Severe acute respiratory syndrome coronavirus 2 (SARS-CoV-2)–associated clonotype frequency in CD8+/CD38+/HLA-DR+ populations detected during active disease and after recovery (rec) in the same individuals (n = 5). A, SARS-CoV-2 CDR3α matches. B, SARS-CoV-2 CDR3β matches. Depicted are the top 20 SARS-CoV-2–associated T-cell receptors after coronavirus disease 2019 (COVID-19) recovery compared to the acute COVID-19 phase.
Figure 4.
Figure 4.
Severe acute respiratory syndrome coronavirus 2 (SARS-CoV-2) predictive performance of CD8+/CD38+/HLA-DR+ populations. A, Depth of the SARS-CoV-2–associated immune response. Of the 30 included patients, 20 had moderate, 5 severe, and 5 critical coronavirus disease 2019. In the control group, 10 individuals had past SARS-CoV-2 infection (exposed [exp]), 10 had no evidence of a previous SARS-CoV-2 infection although being sampled during the pandemic (nonexposed-pandemic [non-exp-p]), and 10 were non-exposed controls sampled before the pandemic (nonexposed-prepandemic [non-exp-pp]). P value denotes Student t test. ***P ≤ .001. B, Receiver operating characteristic curve using the SARS-CoV-2–associated depth in a logistic regression classifier. Abbreviations: AUC, area under the curve; COVID-19, coronavirus disease 2019; ROC, receiver operating characteristic; SARS-CoV-2, severe acute respiratory syndrome coronavirus 2.

References

    1. Laydon DJ, Bangham CRM, Asquith B. Estimating T-cell repertoire diversity: limitations of classical estimators and a new approach. Philos Trans R Soc Lond B Biol Sci 2015; 370:20140291. - PMC - PubMed
    1. Gielis S, Moris P, Bittremieux W, et al. . Detection of enriched T cell epitope specificity in full T cell receptor sequence repertoires. Front Immunol 2019; 10:2820. - PMC - PubMed
    1. DeWitt WS, Emerson RO, Lindau P, et al. . Dynamics of the cytotoxic T cell response to a model of acute viral infection. J Virol Am Soc Microbiol 2015; 89:4517–26. - PMC - PubMed
    1. Arnaout RA, Prak ETL, Schwab N, Rubelt F. The future of blood testing is the immunome. Front Immunol 2021; 12:1–6. - PMC - PubMed
    1. Emerson RO, DeWitt WS, Vignali M, et al. . Immunosequencing identifies signatures of cytomegalovirus exposure history and HLA-mediated effects on the T cell repertoire. Nat Genet 2017; 49:659–65. - PubMed

Publication types