Review
. 2023 Oct;309(1):e222432.
doi: 10.1148/radiol.222432.

Clinical Applications of Photon-counting CT: A Review of Pioneer Studies and a Glimpse into the Future

Affiliations
Review

Clinical Applications of Photon-counting CT: A Review of Pioneer Studies and a Glimpse into the Future

Philippe C Douek et al. Radiology. 2023 Oct.

Abstract

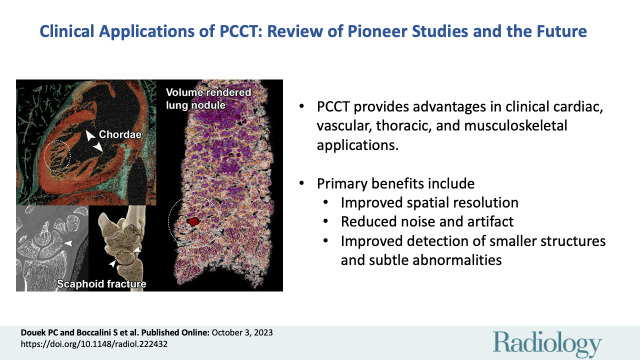
CT systems equipped with photon-counting detectors (PCDs), referred to as photon-counting CT (PCCT), are beginning to change imaging in several subspecialties, such as cardiac, vascular, thoracic, and musculoskeletal radiology. Evidence has been building in the literature underpinning the many advantages of PCCT for different clinical applications. These benefits derive from the distinct features of PCDs, which are made of semiconductor materials capable of converting photons directly into electric signal. PCCT advancements include, among the most important, improved spatial resolution, noise reduction, and spectral properties. PCCT spatial resolution on the order of 0.25 mm allows for the improved visualization of small structures (eg, small vessels, arterial walls, distal bronchi, and bone trabeculations) and their pathologies, as well as the identification of previously undetectable anomalies. In addition, blooming artifacts from calcifications, stents, and other dense structures are reduced. The benefits of the spectral capabilities of PCCT are broad and include reducing radiation and contrast material dose for patients. In addition, multiple types of information can be extracted from a single data set (ie, multiparametric imaging), including quantitative data often regarded as surrogates of functional information (eg, lung perfusion). PCCT also allows for a novel type of CT imaging, K-edge imaging. This technique, combined with new contrast materials specifically designed for this modality, opens the door to new applications for imaging in the future.


Conflict of interest statement

Disclosures of conflicts of interest: P.C.D. Grant to institution from the European Union under the Horizon 2020 Research and Innovation Program (grant agreement no. 633937). S.B. Payment for lectures from Philips; support to attend a meeting from Guerbet. E.H.G.O. Research support to institution from Siemens Healthineers. D.P.C. Grant to institution from the National Institutes of Health. A.P. Institutional sponsored research agreements with Canon Medical Research, GE HealthCare, and Siemens Healthcare; royalties from CardioWise; consulting fees from CardioWise; patent US10959618B2 issued and patents no. 62/699,478 and 20200151880 A1 pending; stock options in CardioWise. L.B. No relevant relationships. S.A.S.M. Payment for presentation from Boehringer Ingelheim. R.P.J.B. Research support to institution from Siemens Healthineers; payment for lectures to institution from Bayer and Siemens Healthineers; support for attending meetings and/or travel to institution from Siemens Healthineers; executive board member for the European Society of Cardiovascular Radiology, member of the Society of Cardiovascular Computed Tomography guidelines committee, and member of the cardiovascular section of the Dutch Society of Radiology; editorial board member for Radiology: Cardiothoracic Imaging.

Figures

None
Graphical abstract
(A) Maximum intensity projection and (B) volume rendered
reconstructions of a coronary photon-counting CT angiography examination
(performed with a Philips Healthcare scanner) in a 38-year-old man with
history of myocardial infarction in the territory of the left anterior
descending artery. Both images show distal branches of the right coronary
artery, including the artery passing in the interatrial septum to reach the
atrioventricular node (arrowheads). The distal pulmonary vessels are also
clearly visible on these images (white dotted outlines). Reconstructions
were performed with a 0.29 × 0.29 × 0.25-mm voxel size with a
1024 matrix size.
Figure 1:
(A) Maximum intensity projection and (B) volume rendered reconstructions of a coronary photon-counting CT angiography examination (performed with a Philips Healthcare scanner) in a 38-year-old man with history of myocardial infarction in the territory of the left anterior descending artery. Both images show distal branches of the right coronary artery, including the artery passing in the interatrial septum to reach the atrioventricular node (arrowheads). The distal pulmonary vessels are also clearly visible on these images (white dotted outlines). Reconstructions were performed with a 0.29 × 0.29 × 0.25-mm voxel size with a 1024 matrix size.
(A–C) Photon-counting CT (PCCT) (Philips Healthcare scanner)
and (D–F) dual-energy CT (DECT) images show heavy calcifications of
the left anterior descending coronary artery proximal and distal to the
origin of the septal and diagonal branches in a 70-year-old woman who
underwent coronary CT to investigate the cause of typical chest pain. PCCT
images were reconstructed with a matrix of 1024 and voxels of 0.29 ×
0.29 × 0.25 mm, whereas DECT images had a matrix of 512 with
isotropic voxels of 0.67 mm. Curvilinear reconstructions of the (A, D) left
main and left anterior descending coronary arteries show the two locations
(white lines) where doubts arose regarding the presence of a significant
stenosis. (B, E) The proximal view and (C, F) distal view cross-sectional
images at these two locations show sharper, more defined and less bulky
calcifications with (B, C) PCCT compared with (E, F) DECT. From a clinical
point of view, this improved visualization of calcification confirmed the
presence of (B, E) a significant proximal stenosis. Whereas with (E) DECT,
the patency of the vessel was doubtful, the (B) PCCT image shows
permeability of the vessel. More distally, after the origin of the branches,
(C) PCCT allowed for diagnosis of stenosis due to the calcifications and
afforded good visualization of the patent lumen (arrowhead). On the (F) DECT
image, the distinction between calcifications and contrast material was not
possible.
Figure 2:
(A–C) Photon-counting CT (PCCT) (Philips Healthcare scanner) and (D–F) dual-energy CT (DECT) images show heavy calcifications of the left anterior descending coronary artery proximal and distal to the origin of the septal and diagonal branches in a 70-year-old woman who underwent coronary CT to investigate the cause of typical chest pain. PCCT images were reconstructed with a matrix of 1024 and voxels of 0.29 × 0.29 × 0.25 mm, whereas DECT images had a matrix of 512 with isotropic voxels of 0.67 mm. Curvilinear reconstructions of the (A, D) left main and left anterior descending coronary arteries show the two locations (white lines) where doubts arose regarding the presence of a significant stenosis. (B, E) The proximal view and (C, F) distal view cross-sectional images at these two locations show sharper, more defined and less bulky calcifications with (B, C) PCCT compared with (E, F) DECT. From a clinical point of view, this improved visualization of calcification confirmed the presence of (B, E) a significant proximal stenosis. Whereas with (E) DECT, the patency of the vessel was doubtful, the (B) PCCT image shows permeability of the vessel. More distally, after the origin of the branches, (C) PCCT allowed for diagnosis of stenosis due to the calcifications and afforded good visualization of the patent lumen (arrowhead). On the (F) DECT image, the distinction between calcifications and contrast material was not possible.
(A, C) Photon-counting CT (PCCT) (Philips Healthcare scanner) and (B,
D) dual-energy CT (DECT) images show minimal atherosclerotic lesions of a
circumflex coronary artery in a 66-year-old man with known coronary artery
disease. A and B show curved multiplanar reconstructions of the artery,
while C and D show the cross-axial planes (white lines in A and B). Curved
multiplanar reconstruction images reveal the presence of two lesions of this
artery. The first lesion was small but clearly depicted by PCCT and
presented a soft component (A, white arrowhead) and a calcified component
(A, black arrowhead) invisible and barely visible, respectively, on the (B)
DECT image. The second lesion was bigger, and the calcified component
(arrows in A and B) was visible at both PCCT and DECT. Notice how with DECT,
this calcification (arrow in B) presents fuzzy borders due to blooming
artifacts. On (C, D) cross-axial images, the more proximal lesion is
localized at the level of the origin of a tiny branch (arrows), the artery
for the sinoatrial node. PCCT allowed for better definition and
characterization of this plaque, as it showed two spotty calcifications and
the soft component (C, arrowhead), all barely visible with (D) DECT. PCCT
images were reconstructed with a matrix of 1024 and voxels of 0.29 ×
0.29 × 0.25 mm, whereas DECT images had a matrix of 512 with
isotropic voxels of 0.67 mm.
Figure 3:
(A, C) Photon-counting CT (PCCT) (Philips Healthcare scanner) and (B, D) dual-energy CT (DECT) images show minimal atherosclerotic lesions of a circumflex coronary artery in a 66-year-old man with known coronary artery disease. A and B show curved multiplanar reconstructions of the artery, while C and D show the cross-axial planes (white lines in A and B). Curved multiplanar reconstruction images reveal the presence of two lesions of this artery. The first lesion was small but clearly depicted by PCCT and presented a soft component (A, white arrowhead) and a calcified component (A, black arrowhead) invisible and barely visible, respectively, on the (B) DECT image. The second lesion was bigger, and the calcified component (arrows in A and B) was visible at both PCCT and DECT. Notice how with DECT, this calcification (arrow in B) presents fuzzy borders due to blooming artifacts. On (C, D) cross-axial images, the more proximal lesion is localized at the level of the origin of a tiny branch (arrows), the artery for the sinoatrial node. PCCT allowed for better definition and characterization of this plaque, as it showed two spotty calcifications and the soft component (C, arrowhead), all barely visible with (D) DECT. PCCT images were reconstructed with a matrix of 1024 and voxels of 0.29 × 0.29 × 0.25 mm, whereas DECT images had a matrix of 512 with isotropic voxels of 0.67 mm.
Examples of cardiac valves imaged with photon-counting CT (PCCT)
(Philips Healthcare scanner). (A) PCCT image shows an aortic valve in a
multiplanar reconstruction with a well-depicted nodule of Arantius of the
noncoronary cusp (arrowhead) in a 45-year-old man with a history of
myocardial infarction in the territory of the left anterior descending
artery. (B) PCCT image depicts a pulmonary valve showing a small orifice of
regurgitation (arrowheads) in the same patient whose aortic valve is imaged
in panel A. (C) A volume rendering shows the mitral valve apparatus,
including the chordae (arrowheads) and the trabeculae of the left ventricle
(white dotted outline), in a 47-year-old woman with a history of acute
coronary artery disease.
Figure 4:
Examples of cardiac valves imaged with photon-counting CT (PCCT) (Philips Healthcare scanner). (A) PCCT image shows an aortic valve in a multiplanar reconstruction with a well-depicted nodule of Arantius of the noncoronary cusp (arrowhead) in a 45-year-old man with a history of myocardial infarction in the territory of the left anterior descending artery. (B) PCCT image depicts a pulmonary valve showing a small orifice of regurgitation (arrowheads) in the same patient whose aortic valve is imaged in panel A. (C) A volume rendering shows the mitral valve apparatus, including the chordae (arrowheads) and the trabeculae of the left ventricle (white dotted outline), in a 47-year-old woman with a history of acute coronary artery disease.
Photon-counting CT images reconstructed at 0.4 mm using a Bv48 kernel
(Siemens Healthineers) in a 55-year-old man with SMAD3 variation and
osteoarthritis syndrome with previous aneurysm of the hepatic artery that
had been treated with stent placement. (A) Complete axial field of view
image at the level of the hepatic artery stent with detailed image quality
of the vascular structures. (B) Zoomed-in coronal and (C) sagittal images of
the stent reveal a very small hypointense area inside the stent (arrowheads)
compatible with a small area of thrombus formation.
Figure 5:
Photon-counting CT images reconstructed at 0.4 mm using a Bv48 kernel (Siemens Healthineers) in a 55-year-old man with SMAD3 variation and osteoarthritis syndrome with previous aneurysm of the hepatic artery that had been treated with stent placement. (A) Complete axial field of view image at the level of the hepatic artery stent with detailed image quality of the vascular structures. (B) Zoomed-in coronal and (C) sagittal images of the stent reveal a very small hypointense area inside the stent (arrowheads) compatible with a small area of thrombus formation.
(A–F) Abdominal aorta peripheral runoff photon-counting CT
(PCCT) scan (Siemens Healthineers) in a 56-year-old man with intermittent
claudication with a stent in the left superficial femoral artery and diffuse
atherosclerosis in both legs. The entire scan range was reconstructed as a
single image stack by using a field of view large enough to include the
entire patient at the abdominal region. (A) Three-dimensional cinematic
rendering reconstructions from the entire scan range (posterior view).
Curved multiplanar reformats of the (B, D) upper and lower left leg and (C)
zoomed-in image of the stent region. Notice the diffuse atherosclerosis
(arrows in B and D) and the in-stent intimal hyperplasia (arrowheads in C).
(E) Three-dimensional cinematic rendering reconstruction of the region of
the left ankle and (F) multiplanar reformat. On E and F, very small vessel
diameter can be observed (arrowheads) even though it is next to the
calcification (arrows). (G–I) Abdominal aorta peripheral runoff PCCT
scan in a 68-year-old patient with intermittent claudication, most severe on
the left side. (G) Curved multiplanar reformation of the left anterior
tibial artery with extensive calcifications (arrows) and (H, I) axial images
at the level of the ankle and distal left lower leg. Notice how the lumen
can be accurately assessed (G–I, arrowheads) despite the
calcifications (G–I, arrows).
Figure 6:
(A–F) Abdominal aorta peripheral runoff photon-counting CT (PCCT) scan (Siemens Healthineers) in a 56-year-old man with intermittent claudication with a stent in the left superficial femoral artery and diffuse atherosclerosis in both legs. The entire scan range was reconstructed as a single image stack by using a field of view large enough to include the entire patient at the abdominal region. (A) Three-dimensional cinematic rendering reconstructions from the entire scan range (posterior view). Curved multiplanar reformats of the (B, D) upper and lower left leg and (C) zoomed-in image of the stent region. Notice the diffuse atherosclerosis (arrows in B and D) and the in-stent intimal hyperplasia (arrowheads in C). (E) Three-dimensional cinematic rendering reconstruction of the region of the left ankle and (F) multiplanar reformat. On E and F, very small vessel diameter can be observed (arrowheads) even though it is next to the calcification (arrows). (G–I) Abdominal aorta peripheral runoff PCCT scan in a 68-year-old patient with intermittent claudication, most severe on the left side. (G) Curved multiplanar reformation of the left anterior tibial artery with extensive calcifications (arrows) and (H, I) axial images at the level of the ankle and distal left lower leg. Notice how the lumen can be accurately assessed (G–I, arrowheads) despite the calcifications (G–I, arrows).
Example ultrahigh-resolution photon-counting CT images (Philips Healthcare
scanner) of the lung show a centimetric solid nodule in a 58-year-old male
patient with unclassifiable idiopathic interstitial lung disease. (A) Volume
rendered image of lung parenchyma and (B) fusion volume rendered image between
lung parenchyma and high-contrast nodule and reticulation (white dotted circle).
(C–F) Quasi-isotropic multiplanar reconstruction images with 0.29
× 0.29 × 0.25-mm voxel size. (C–H) Multiplanar images show
a magnified view of the spiculated nodule (C–E) before and (F–H)
after automatic segmentation (IntelliSpace Portal, Philips) found in the lower
right lobe and measuring 238.2 mm3.
Figure 7:
Example ultrahigh-resolution photon-counting CT images (Philips Healthcare scanner) of the lung show a centimetric solid nodule in a 58-year-old male patient with unclassifiable idiopathic interstitial lung disease. (A) Volume rendered image of lung parenchyma and (B) fusion volume rendered image between lung parenchyma and high-contrast nodule and reticulation (white dotted circle). (C–F) Quasi-isotropic multiplanar reconstruction images with 0.29 × 0.29 × 0.25-mm voxel size. (C–H) Multiplanar images show a magnified view of the spiculated nodule (C–E) before and (F–H) after automatic segmentation (IntelliSpace Portal, Philips) found in the lower right lobe and measuring 238.2 mm3.
Example lung ultrahigh-resolution photon-counting CT images (Philips
Healthcare scanner) show a typical usual interstitial pneumonia in a 73-year-old
male patient. (A) Coronal oblique image with 0.29 × 0.29 × 0.25-mm
voxel size shows subpleural predominant reticular abnormality with distal
traction bronchiectasis and an area of honeycombing occurring in single or
multiple layers (arrowhead). An important area of distal bronchiectasis and
bronchiolectasis is seen in the right lower lobe with a clear visualization of
the bronchial lumen from the center to the subpleural space (red dotted circle).
An area of ground-glass opacity (arrow) is shown to present reticulations and
traction bronchiectasis, indicating a fibrosis pattern. (B) A 3-mm-width volume
rendered image with clear visualization of the traction bronchiectasis,
honeycombing, and architectural distortion of the lungs.
Figure 8:
Example lung ultrahigh-resolution photon-counting CT images (Philips Healthcare scanner) show a typical usual interstitial pneumonia in a 73-year-old male patient. (A) Coronal oblique image with 0.29 × 0.29 × 0.25-mm voxel size shows subpleural predominant reticular abnormality with distal traction bronchiectasis and an area of honeycombing occurring in single or multiple layers (arrowhead). An important area of distal bronchiectasis and bronchiolectasis is seen in the right lower lobe with a clear visualization of the bronchial lumen from the center to the subpleural space (red dotted circle). An area of ground-glass opacity (arrow) is shown to present reticulations and traction bronchiectasis, indicating a fibrosis pattern. (B) A 3-mm-width volume rendered image with clear visualization of the traction bronchiectasis, honeycombing, and architectural distortion of the lungs.
Example lung photon-counting CT angiography images (Philips Healthcare
scanner) with a multiparametric imaging analysis of the lung anatomy and its
function show pulmonary embolism and its impact on the lung perfusion in a
41-year-old woman with pulmonary hypertension. (A) An axial 5-mm-width maximum
intensity projection virtual monoenergetic image (VMI) at 70 keV that
substitutes a 120-kVp conventional image due to similar mean energy of its
spectrum. Multiple filling defects are seen in the right lower lobe
(arrowheads). Also visible are the dilated distal pulmonary vessels (arrow)
suggesting pre-existing pulmonary hypertension. (B) An axial 5-mm-width maximum
intensity projection VMI at 40 keV that simulates the attenuation of a tissue at
low energy (ie, 40 keV), consequently enabling an increase in CT attenuation of
iodine due to an energy being close to its K-edge (33.2 keV). This effect
enables a greater discrimination of the emboli (arrowheads) responsible for
subsegmental partial and complete filling defects. (C) An axial 5-mm-width
Z-effective image that measures the integrated atomic number of the tissue
within a voxel. The contrast generated from the image is color-coded (in red are
lower Z-effective values and in blue, higher Z-effective values) and enables the
visualization of a perfusion defect downstream from the embolus completely
occluding the laterobasal subsegment of the right lower lobe (★). (D) An
axial 5-mm-width iodine map, a validated surrogate marker of lung perfusion that
contributes to the functional assessment of vascular lung diseases. The contrast
generated from the image is color-coded (black means no iodine, and red, a high
iodine concentration) and enables visualization of an embolic-type perfusion
defect downstream from the complete filling defect in the laterobasal subsegment
of the right lower lobe (★). On the contrary, in the posterobasal
subsegment, where a partial filling defect is seen in a subsegmental branch of
the right lower pulmonary artery, the perfusion is preserved (white dotted
circle).
Figure 9:
Example lung photon-counting CT angiography images (Philips Healthcare scanner) with a multiparametric imaging analysis of the lung anatomy and its function show pulmonary embolism and its impact on the lung perfusion in a 41-year-old woman with pulmonary hypertension. (A) An axial 5-mm-width maximum intensity projection virtual monoenergetic image (VMI) at 70 keV that substitutes a 120-kVp conventional image due to similar mean energy of its spectrum. Multiple filling defects are seen in the right lower lobe (arrowheads). Also visible are the dilated distal pulmonary vessels (arrow) suggesting pre-existing pulmonary hypertension. (B) An axial 5-mm-width maximum intensity projection VMI at 40 keV that simulates the attenuation of a tissue at low energy (ie, 40 keV), consequently enabling an increase in CT attenuation of iodine due to an energy being close to its K-edge (33.2 keV). This effect enables a greater discrimination of the emboli (arrowheads) responsible for subsegmental partial and complete filling defects. (C) An axial 5-mm-width Z-effective image that measures the integrated atomic number of the tissue within a voxel. The contrast generated from the image is color-coded (in red are lower Z-effective values and in blue, higher Z-effective values) and enables the visualization of a perfusion defect downstream from the embolus completely occluding the laterobasal subsegment of the right lower lobe (★). (D) An axial 5-mm-width iodine map, a validated surrogate marker of lung perfusion that contributes to the functional assessment of vascular lung diseases. The contrast generated from the image is color-coded (black means no iodine, and red, a high iodine concentration) and enables visualization of an embolic-type perfusion defect downstream from the complete filling defect in the laterobasal subsegment of the right lower lobe (★). On the contrary, in the posterobasal subsegment, where a partial filling defect is seen in a subsegmental branch of the right lower pulmonary artery, the perfusion is preserved (white dotted circle).
(A) Photon-counting CT coronal multiplanar image (Siemens Healthineers
scanner) and (B) three-dimensional volumetric reconstruction using a cinematic
rendering algorithm show a horizontal oblique fracture of the middle third of
the scaphoid (arrowheads) in an otherwise healthy 47-year-old man.
Figure 10:
(A) Photon-counting CT coronal multiplanar image (Siemens Healthineers scanner) and (B) three-dimensional volumetric reconstruction using a cinematic rendering algorithm show a horizontal oblique fracture of the middle third of the scaphoid (arrowheads) in an otherwise healthy 47-year-old man.
(A) Ultrahigh-resolution photon-counting CT image (Siemens Healthineers
scanner) and (B) corresponding illustration of the temporal bone in a
53-year-old woman being examined for loss of hearing. The image shows the stapes
(red shading in B) and its anterior and posterior arches in high anatomic detail
as well as the lenticular process of the incus (yellow shading in B) and the
incudostapedial joint (interface between the red and yellow structures in B).
Several inner ear structures, such as the cochlea (green shading in B), are also
visualized.
Figure 11:
(A) Ultrahigh-resolution photon-counting CT image (Siemens Healthineers scanner) and (B) corresponding illustration of the temporal bone in a 53-year-old woman being examined for loss of hearing. The image shows the stapes (red shading in B) and its anterior and posterior arches in high anatomic detail as well as the lenticular process of the incus (yellow shading in B) and the incudostapedial joint (interface between the red and yellow structures in B). Several inner ear structures, such as the cochlea (green shading in B), are also visualized.

References

    1. Rotzinger DC , Si-Mohamed SA , Yerly J , et al. . Reduced-iodine-dose dual-energy coronary CT angiography: qualitative and quantitative comparison between virtual monochromatic and polychromatic CT images . Eur Radiol 2021. ; 31 ( 9 ): 7132 – 7142 . - PMC - PubMed
    1. Cavallo AU , Patterson AJ , Thomas R , et al. . Low dose contrast CT for transcatheter aortic valve replacement assessment: results from the prospective SPECTACULAR study (spectral CT assessment prior to TAVR) . J Cardiovasc Comput Tomogr 2020. ; 14 ( 1 ): 68 – 74 . - PubMed
    1. Bae K , Jeon KN , Cho SB , et al. . Improved opacification of a suboptimally enhanced pulmonary artery in chest CT: experience using a dual-layer detector spectral CT . AJR Am J Roentgenol 2018. ; 210 ( 4 ): 734 – 741 . - PubMed
    1. Si-Mohamed S , Dupuis N , Tatard-Leitman V , et al. . Virtual versus true non-contrast dual-energy CT imaging for the diagnosis of aortic intramural hematoma . Eur Radiol 2019. ; 29 ( 12 ): 6762 – 6771 . - PubMed
    1. Johnson TRCC . Dual-energy CT: general principles . AJR Am J Roentgenol 2012. ; 199 ( 5 Suppl ): S3 – S8 . - PubMed

Publication types