. 2023 Dec 4;222(12):e202307117.
doi: 10.1083/jcb.202307117. Epub 2023 Oct 3.

Ca2+-induced release of IQSEC2/BRAG1 autoinhibition under physiological and pathological conditions

Affiliations

Ca2+-induced release of IQSEC2/BRAG1 autoinhibition under physiological and pathological conditions

Guanhua Bai et al. J Cell Biol. .

Abstract

IQSEC2 (aka BRAG1) is a guanine nucleotide exchange factor (GEF) highly enriched in synapses. As a top neurodevelopmental disorder risk gene, numerous mutations are identified in Iqsec2 in patients with intellectual disabilities accompanied by other developmental, neurological, and psychiatric symptoms, though with poorly understood underlying molecular mechanisms. The atomic structures of IQSECs, together with biochemical analysis, presented in this study reveal an autoinhibition and Ca2+-dependent allosteric activation mechanism for all IQSECs and rationalize how each identified Iqsec2 mutation can alter the structure and function of the enzyme. Transgenic mice modeling two pathogenic variants of Iqsec2 (R359C and Q801P), with one activating and the other inhibiting the GEF activity of the enzyme, recapitulate distinct clinical phenotypes in patients. Our study demonstrates that different mutations on one gene such as Iqsec2 can have distinct neurological phenotypes and accordingly will require different therapeutic strategies.


Conflict of interest statement

Disclosures: The authors declare no competing interests exist.

Figures

Figure 1.
Figure 1.
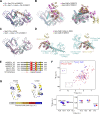
The IQ-motif/CaM complex is coupled with the Sec7-PH tandem in IQSECs and dissociated by Ca2+. (A) Schematic diagrams showing the domain organization and amino acid sequence conservation of IQSECs from different species. Amino acid sequences of the region encompassing the extended IQ-motif of IQSECs are aligned. The predicted α-helices in the extended IQ-motif are labeled. Residues in the IQ-motif of IQSEC2 found to be mutated in ID patients are indicated. Cons., conserved; Var., variable. (B) The size-exclusion chromatography coupled with multiangle light scattering (SEC-MALS) analysis shows that the IQ-motif and CaM formed homogenous stabled complexes both in the absence and presence of Ca2+. (C) The SEC-MALS analysis shows that the IQ-motif/CaM complex and the Sec7-PH tandem of IQSEC3 formed stable complexes in the absence of Ca2+ and dissociated in the presence of Ca2+. (D) The ITC curve of 200 μM IQ-motif/CaM complex titrating into 20 μM Sec7-PH protein of IQSEC3 in the absence and presence of Ca2+. N.R., fitting is not reliable due to very weak binding. (E) Superposition plot of a small region of the 1H, 15N HSQC spectra of the 14N_IQ∼Sec7PH/15N_Ca2+-CaM complexes (blue) and 15N_IQ/15N_Ca2+-CaM complexes (black). The full 1H, 15N HSQC spectra are shown in Fig. S1 F. The assignments of the peaks corresponding to the 15N_Ca2+-CaM are labeled. (F) The ITC curve of 100 μM CaM titrating into 10 μM IQ∼Sec7PH protein of IQSEC3 in the absence and presence of Ca2+.
Figure S1.
Figure S1.
The IQ-motif/CaM complex is coupled with the Sec7-PH tandem in IQSECs and dissociated by Ca2+. (A) The SEC-MALS analysis of the IQ-motif/CaM complex, the Sec7-PH tandem of IQSEC1, and their mixture. (B) The SEC-MALS analysis of the IQ-motif/CaM complex, the Sec7-PH tandem of IQSEC2, and their mixture. (C) The ITC curve of 200 μM IQ-motif/CaM complex titrating into 20 μM Sec7-PH protein of IQSEC2 in the absence and presence of Ca2+. The ITC titration was performed at 10°C so that the reaction had an obvious heat change. N.R., fitting is not reliable. (D) The SEC-MALS analysis shows different elution volumes of the IQ∼Sec7PH/CaM complexes in the absence and presence of Ca2+. The IQ∼Sec7PH/Apo-CaM complex is well-aligned with the Apo-CaM/IQ/Sec7-PH mixture. (E) Superposition plot of 1H, 15N HSQC spectra of the 14N_IQ∼Sec7PH/15N_CaM complexes in the absence (orange), and presence of Ca2+ (blue). (F) Superposition plot of 1H, 15N HSQC spectra of the 14N_IQ∼Sec7PH/15N_Ca2+-CaM complexes (blue) and the 15N_IQ/15N_Ca2+-CaM complexes (black). Two black dotted rectangles are expanded in Fig. 1 E.
Figure 2.
Figure 2.
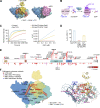
Structure of the apo-CaM/IQ/Sec7-PH ternary complex. (A) Cartoon representation of the apo-CaM/IQ/Sec7-PH ternary complex structure of IQSEC1. (B) The amino acid conservation of IQSECs mapped to the surface of the Sec7-PH tandem structure. (C) Schematic diagram of the IQSEC1 apo-CaM/IQ/Sec7-PH complex showing five characteristic interfaces between apo-CaM/IQ and Sec7-PH as detailed in D–H. (D) The detailed interaction interface between the C-lobe of apo-CaM and the IQ-motif. Residues from the IQ-motif mediating critical interactions with CaM are drawn with the stick model. The surface of CaM is colored as follows: yellow, hydrophobic residues; blue, positively charged residues; red, negatively charged residues. (E) The interaction interface between the C-lobe of apo-CaM and the Sec7 domain. (F) The interaction interface between the pre-IQ helix and the Sec7-PH tandem. (G) The interaction interface between the IQ-helix and the Sec7 domain. The surface of the Sec7-PH tandem is colored with the same scheme as in D. (H) The interaction interface between the C-terminal loop of the IQ-motif and the Sec7 domain. (I) Summary of ITC-derived binding affinities between various IQ-motif proteins with different mutant forms of the Sec7-PH tandem for structural validation of the apo-CaM/IQ/Sec7-PH ternary complex. Each mutant protein was purified using the same method for the corresponding WT protein.
Figure S2.
Figure S2.
Comparisons of the Apo-CaM/IQ/Sec7-PH ternary structure with those of related proteins. (A and B) Superposition of the Apo-CaM/IQ/Sec7-PH ternary complex structure of IQSEC1 with that of IQSEC2. Panel A only shows the superposition of the two IQ/Sec7-PH complexes. Panel B shows the superposition of the two overall structures. (C) Superposition of the Sec7-PH structures from the Apo-CaM/IQ/Sec7-PH ternary complex structure with that from the ARF1/Sec7-PH complex structure (PDB accession no. 4C0A). (D) Superposition of the IQ/Apo-CaM structure from the Apo-CaM/IQ/Sec7-PH ternary complex with the IQ1/Apo-CAM (left) or IQ2/Apo-CaM (right) structure from the myosin-1c/Apo-CaM complex (PDB accession no. 4R8G). (E) Sequence alignment analysis of the IQ-motifs from IQSECs and IQ-motifs from myosin-1c. (F) Superposition plot of the 1H, 15N HSQC spectrum of the 14N_IQ∼Sec7PH/15N_Ca2+-CaM complexes of IQSEC3 (blue) with that of 15N_Ca2+-CaM (red), showing that Ca2+-CaM experienced IQ∼Sec7PH binding-induced conformational changes. Two black dotted rectangles are expanded in the lower panel. The assignments of the peaks corresponding to the 15N_Ca2+-CaM are labeled. (G) Mapping of the backbone amide chemical shift changes of the N- and C-lobes of Ca2+-CaM resulted from the CaM/IQ/Sec7-PH coupling. The result indicates that both lobes of Ca2+-CaM are engaged in binding to IQ∼Sec7PH. The analysis was performed by comparing the 1H, 15N HSQC spectra as shown in F. The chemical shift difference of each peak is defined as Δp.p.m. = [(ΔδHN)2 + (αN * ΔδHN)2]1/2. The scaling factor (αN) used to normalize the 1H and 15N chemical shifts is 0.17.
Figure 3.
Figure 3.
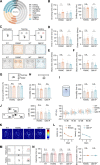
Autoinhibition and Ca2+-induced activation of IQSEC2. (A) Comparison of the apo-CaM/IQ/Sec7-PH ternary complex structure with that of the ARF1/Sec7-PH complex (PDB accession no. 4C0A). (B) Schematic illustration of the fluorescent-based guanine nucleotide exchange assay used in this study. (C) Representative fluorescence kinetic curves for determining kobs and plots of kobs against GEF protein concentrations used to calculate kcat/KM. The kinetic traces were fitted with the one-phase exponential association model. Data are presented as mean ± SD from four repeated measurements. (D) The GEF activity (kcat/KM fit values) of IQSEC2 proteins in the absence and presence of Ca2+. Bar graphs represent the mean ± SD of slopes obtained from linear regression analysis of data in C (right) at different conditions. (E) Summary of Iqsec2 pathogenic missense variants and loss-of-function variants mapped to the schematic diagram of the longest isoform of the protein (GenBank ID NP_001104595.1). Predicted domain organization is drawn to scale: N-terminal coiled-coil (CC) domain, the IQ-motif (IQ), the Sec7 and Pleckstrin homology (PH) domains, and the C-terminal PDZ-binding motif (PBM). Diamond: missense variants present in affected males; square: missense variants present in affected females; triangle: loss-of-function variants present in affected males; dot: loss-of-function variants present in affected females. Variants are ranked by a red-colored scale against the severity of ID or developmental delay (DD): B, borderline; m, mild; M, moderate; S, severe; P, profound; pink: unknown. The p.R359C and p.Q801P variants in this study are labeled in bold. (F) Schematic diagram showing the distributions of pathogenic missense variants of IQSEC2 mapped to its structure using the surface (left) and ribbon diagram (right) models. The predicted (or experimentally demonstrated in the current study) impact of each mutation based on the structures of the IQSEC1 and IQSEC2 determined in this work are indicated with different colors and described in the figure.
Figure 4.
Figure 4.
Structural and biochemical analysis of missense mutations in IQSEC2. (A) Summary of currently documented Iqsec2 missense variants to the schematic diagram of the longest isoform (GenBank ID NP_001104595.1). Variants are ranked by red scale against the clinical significance: VUS, variants of unclear significance; LP, likely pathogenic; P, pathogenic. (B) Schematic diagram showing the distributions of all currently documented missense variants of IQSEC2 mapped to the structure of the protein. (C) Summary of how missense mutations affect the binding affinities between IQ-motif proteins with the Sec7-PH tandem or CaM in the absence and presence of Ca2+. (D and E) The detailed interactions surrounding Q801, R359, and A350 of IQSEC2 as illustrated by the structure of the apo-CaM/IQ/Sec7-PH ternary complex. Bar graphs showing the GEF activity (kcat/KM values) of WT and the mutants of IQSEC2 in the absence and presence of Ca2+. Data are presented as mean ± SD from four repeated measurements. (F) Representative pull-down assay showing weakened interactions between the mutant IQ-motif proteins of IQSEC2 and CaM both in the absence and presence of Ca2+. The amount of protein eluted from the resin (relative to each input) is indicated above each lane. Source data are available for this figure: SourceData F4.
Figure S3.
Figure S3.
Generation and characterization of mScarlet-Iqsec2, IQSEC2 R359C, and IQSEC2 Q801P mice. (A) Schematic strategies for generating Iqsec2 mutant mice using CRISPR/Cas9. sgRNA recognition sites are indicated with scissors. Representative DNA sequencing results from WT and hemizygous mice highlighted substituted sequences. (B) Representative gross appearances and growth chart plots of the R359C and Q801P mutant mice compared with their respective WT control littermates. Data are presented as mean ± SEM (n = 10–15 mice per group). (C) Representative brain photographs and plots of adult mouse brain weights. Data are presented as mean ± SEM (n = 23–25 mice per group; n.s., not significant; unpaired t test). (D and E) Overall cellular structures in the hippocampus and the somatosensory area of the cerebral cortex of the R359C and Q801P mutant mice and their WT littermates were assessed by DAPI staining. Scale bars, 200 μm. (F) Representative fluorescence images of coronal and sagittal sections from mScarlet-Iqsec2 adult mouse brains. Nuclei were stained with DAPI (blue). V2L, secondary visual cortex, lateral area; CA1 and CA3, Ammon’s horn 1 and three of the hippocampus; DG, dentate gyrus. Scale bars, coronal and sagittal sections: 1 mm; V2L: 125 μm; CA1 and CA3: 100 μm; DG: 200 μm. (G and H) The R359C and the Q801P mice show normal inhibitory synaptic transmissions. Representative traces and plots showing the frequency and the mean amplitude of the miniature and the spontaneous IPSCs recorded from CA1 pyramidal neurons in the slices from the R359C and Q801P mutant mice and their respective WT control littermates. Data are presented as mean ± SEM (n = 21–23 recordings per eight mice per group; n.s., not significant; unpaired t test).
Figure 5.
Figure 5.
Distinct synaptic phenotypes of the R359C and the Q801P mice. (A and B) Representative recordings of the evoked EPSCs and plots showing the mean amplitudes (pA) of the EPSCs versus the stimulus intensities (mV) for CA1 pyramidal neurons in the slices from the R359C and Q801P mutant and their respective WT control littermates. Data are presented as mean ± SEM (n = 17–29 recordings per eight mice per group; ***P < 0.001; unpaired t test). (C and D) Representative traces and plots showing the frequency and the mean amplitude of the miniature and the spontaneous EPSCs recorded from CA1 pyramidal neurons from the R359C or Q801P mutant mice and their respective WT littermates. Data are presented as mean ± SEM (n = 18–25 recordings per eight mice per group; n.s., not significant; *P < 0.05; ****P < 0.0001; unpaired t test). (E and F) Plots showing the time course (left) and the summarized values 30 min after each tetanus (right) of the mean ± SEM (n = 15–24 recordings per five to eight mice per group; **P < 0.01; unpaired t test) of the 5–95% fEPSP slope, normalized to the baseline (defined as 1.0) immediately preceding first tetanus (↑) in the hippocampal slices from the R359C and Q801P mutant mice and their respective WT control littermates. Sample traces (inserts) show the baseline and sweeps at 15 min following tetani. Scale bars: 1 mV, 15 ms. (G) A plot showing the time course of the mean ± SEM (n = 15–25 recordings per five to eight mice per group) of the 5–95% fEPSP slope, normalized to the baseline (defined as 1.0) immediately preceding the low-frequency stimulation (LFS) in the hippocampal slices from the R359C and Q801P mutant mice and their respective WT littermates. Sample traces before and 30 min after LFS are shown at the top of the plot.
Figure S4.
Figure S4.
Behavioral phenotypes of the R359C and the Q801P mice. (A) Pie chart summary showing 48 h natural spontaneous behavior recording of the R359C and Q801P mutant mice as well as their respective WT control littermates at 60 ± 2 d old of age. (B) Bar graphs showing the grooming and sniffing time in the 48 h natural spontaneous behavior recording. Data are presented as mean ± SEM (n = 16 mice per group; n.s., not significant; **P < 0.01; unpaired t test). (C) Schematic representation of the novel object recognition task and representative exploration trajectories during the habituation and training phase of individual mice. (D) Bar graphs showing the time spent and the number of entrances in the center area during the habituation phase. Data are presented as mean ± SEM (n = 13 mice per group; **P < 0.01; unpaired t test). (E and F) Bar graphs showing the number of entrances in the object around the area during the training and testing phases. Related to Fig. 6, A and B. Data are presented as mean ± SEM (n = 13 mice per group; *P < 0.05; **P < 0.01; unpaired t test). (G–I) Bar graphs showing the performance of the R359C and Q801P mutant and their WT control littermate mice in the sucrose preference, tail suspending, and forced swimming tests. Data are presented as mean ± SEM (n = 13 mice per group; n.s., not significant; unpaired t test). (J) Measurement of the acoustic startle reflex (ASR) and prepulse inhibition (PPI) of the R359C and Q801P mutant and their WT control littermate mice. Data are presented as mean ± SEM (n = 13 mice per group; n.s., not significant; unpaired t test). (K) Representative exploration trajectories on the third day during the visible platform task in the Morris water maze. (L) The escape latency in the Morris water maze to reach the visible platform. Data are presented as mean ± SEM (n = 13 mice per group; n.s., not significant; unpaired t test). (M) Schematic representation of the three-chamber tests. (N) Left: Bar graphs showing the time spent exploring the left (gray) and right (red) chambers during the habituation phase of individual mice. Right: No preference on location in three-chamber tests as shown by the discrimination index showing by violin plots. Data are presented as median, quartiles, and individual values (n = 12–13 mice per group; n.s., not significant; left: paired t test; right: unpaired t test).
Figure 6.
Figure 6.
Distinct behavioral phenotypes of the R359C and the Q801P mice. (A) Representative exploration trajectories and the total time spent exploring both the familiar (diamond) and novel (circle) objects of the R359C and Q801P mutant mice and their respective WT control littermates in the novel object recognition task. Data are presented as mean ± SEM (n = 13 mice per group; n.s., not significant; **P < 0.01; unpaired t test). (B) Left: Bar graphs showing the time spent exploring the familiar (gray) and novel (red) objects during the test phase of the individual mice. Right: Relative preference for the novel object was calculated by a recognition index using violin plots. Data are presented as median, quartiles, and individual values (n = 13 mice per group; ****P < 0.0001; left: paired t test; right: unpaired t test). (C) Representative heatmaps and bar graphs showing the number of entrances and the time spent in the open arms of the elevated plus maze (EPM). Data are presented as mean ± SEM (n = 13 mice per group; *P < 0.05; **P < 0.01; unpaired t test). (D) Representative exploration trajectories on the seventh day during training in the Morris water maze test. Hidden platform positions presented each day are indicated above the graphs. Noted that the platform was removed in probe tests on the 9th and 14th days. (E) The escape latency during initial and reversal training in the Morris water maze to reach the hidden platform. Data are presented as mean ± SEM (n = 12–13 mice per group; *P < 0.05; **P < 0.01; ***P < 0.001; ****P < 0.0001; unpaired t test). (F) Representative exploration trajectories and quantification of time spent in the target quadrant in the first probe trial on the 9th day. Data are presented as mean ± SEM (n = 12–13 mice per group; ****P < 0.0001; unpaired t test). (G) Representative exploration trajectories and quantification of time spent in the original (O) and target (T) quadrants in the reversal probe trials on the 14th day. Data are presented as mean ± SEM (n = 12–13 mice per group; *P < 0.05; **P < 0.01; ***P < 0.001; unpaired t test). (H) Representative heatmaps and bar graphs show the time spent on exploring a novel object versus interacting with a stranger mouse. Data are presented as mean ± SEM (n = 12–13 mice per group; ****P < 0.0001; unpaired t test). (I) Left: Bar graphs showing the time spent exploring the novel object (O, gray) and stranger mouse (M, red) during the testing phase of individual mice. Right: Relative preference for the stranger mouse was calculated by a discrimination index showing by violin plots. Data are presented as median, quartiles, and individual values (n = 12–13 mice per group; ***P < 0.001; ****P < 0.0001; left: paired t test; right: unpaired t test).
Figure 7.
Figure 7.
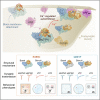
Schematic model of Ca2+-dependent IQSEC regulation. IQSEC2 is likely enriched in synapses via its C-terminal PDZ binding motif-mediated binding to synaptic PDZ domain scaffold proteins such as PSD-95. The Apo-CaM-bound IQ-motif binds tightly to the Sec7-PH tandem, blocking ARFs from accessing the catalytic core. The IQSEC-bound negatively charged Apo-CaM occludes the PH domain from binding to lipid membranes. The rise of cellular Ca2+ concentration releases the autoinhibition and concomitantly allows the enzyme to bind to lipid membranes and membrane-localized ARFs, resulting in a synergistic production of GTP-bound ARFs.

Comment in

  • BRAG about (s)lots.
    Brown JC, Hell JW, Gerges NZ. Brown JC, et al. J Cell Biol. 2023 Dec 4;222(12):e202310023. doi: 10.1083/jcb.202310023. Epub 2023 Nov 8. J Cell Biol. 2023. PMID: 37938213 Free PMC article.

References

    1. Accogli, A., Eric Jarvis G., Schiavetto A., Lai L., Amirali E.L., Jimenez Cruz D.A., Rivière J.B., and Trakadis Y.. 2020. Psychiatric features and variable neurodevelopment outcome in four females with IQSEC2 spectrum disorder. J. Genet. 99:47. - PubMed
    1. Adams, P.D., Afonine P.V., Bunkóczi G., Chen V.B., Davis I.W., Echols N., Headd J.J., Hung L.W., Kapral G.J., Grosse-Kunstleve R.W., et al. . 2010. PHENIX: A comprehensive python-based system for macromolecular structure solution. Acta Crystallogr. D Biol. Crystallogr. 66:213–221. 10.1107/S0907444909052925 - DOI - PMC - PubMed
    1. Aizel, K., Biou V., Navaza J., Duarte L.V., Campanacci V., Cherfils J., and Zeghouf M.. 2013. Integrated conformational and lipid-sensing regulation of endosomal ArfGEF BRAG2. PLoS Biol. 11:e1001652. 10.1371/journal.pbio.1001652 - DOI - PMC - PubMed
    1. Ansar, M., Chung H.L., Al-Otaibi A., Elagabani M.N., Ravenscroft T.A., Paracha S.A., Scholz R., Abdel Magid T., Sarwar M.T., Shah S.F., et al. . 2019. Bi-allelic variants in IQSEC1 cause intellectual disability, developmental delay, and short stature. Am. J. Hum. Genet. 105:907–920. 10.1016/j.ajhg.2019.09.013 - DOI - PMC - PubMed
    1. Bähler, M., and Rhoads A.. 2002. Calmodulin signaling via the IQ motif. FEBS Lett. 513:107–113. 10.1016/S0014-5793(01)03239-2 - DOI - PubMed

Publication types