. 2023 Dec 4;220(12):e20230263.
doi: 10.1084/jem.20230263. Epub 2023 Oct 3.

B cell-intrinsic Myd88 regulates disease progression in murine lupus

Affiliations

B cell-intrinsic Myd88 regulates disease progression in murine lupus

Jeremy S Tilstra et al. J Exp Med. .

Abstract

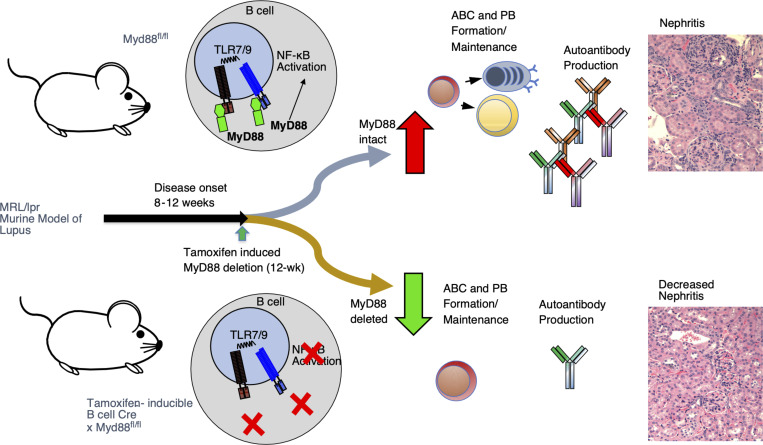
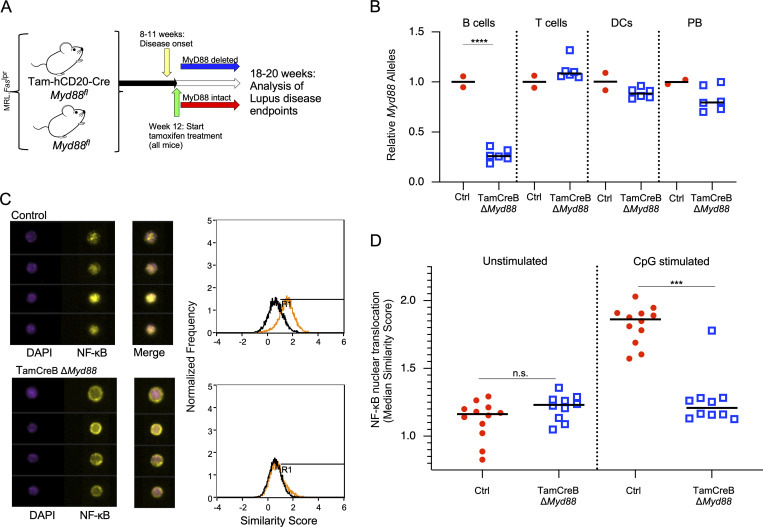
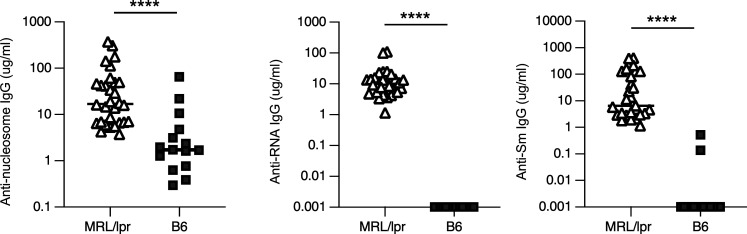
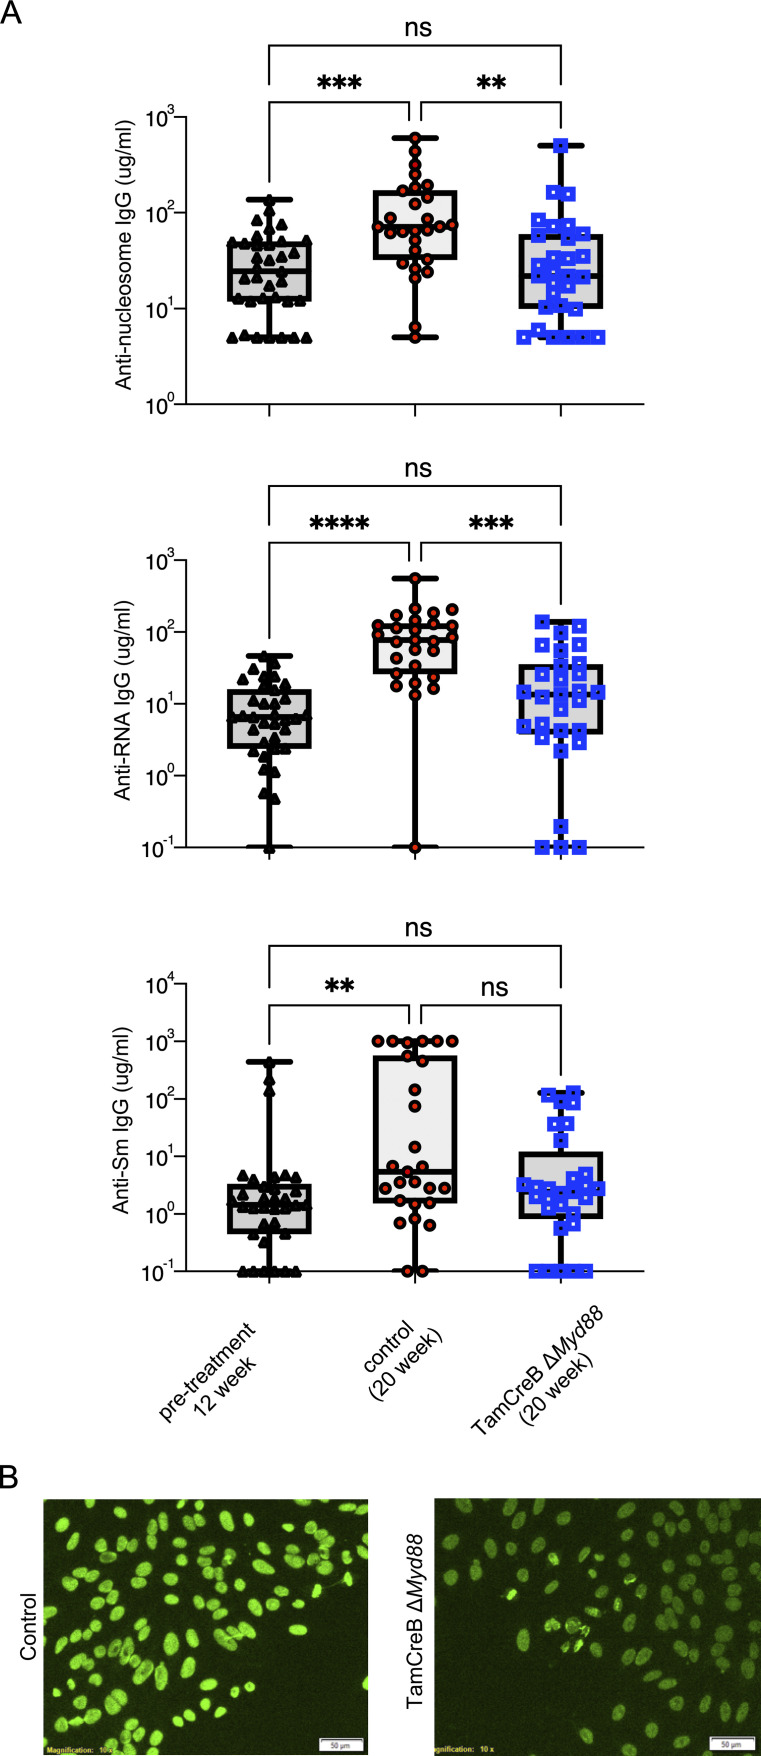
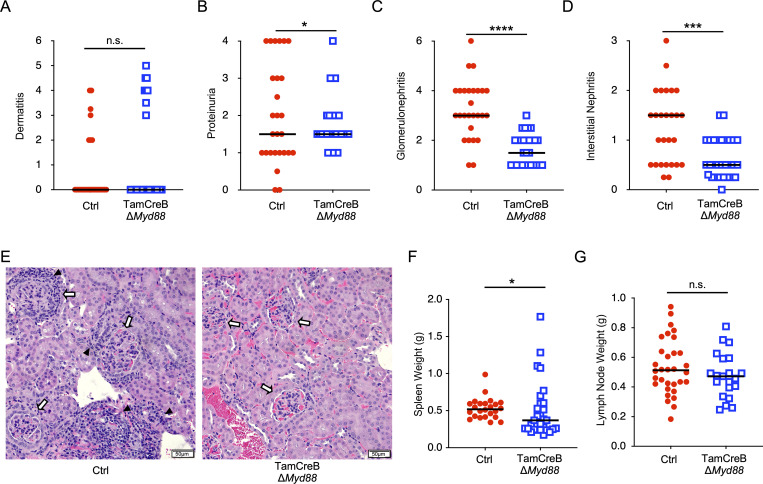
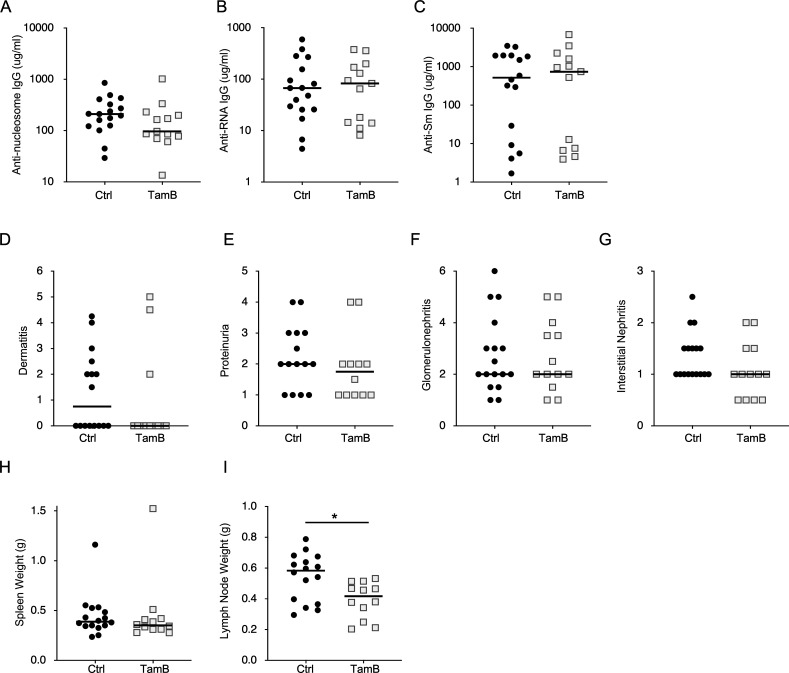
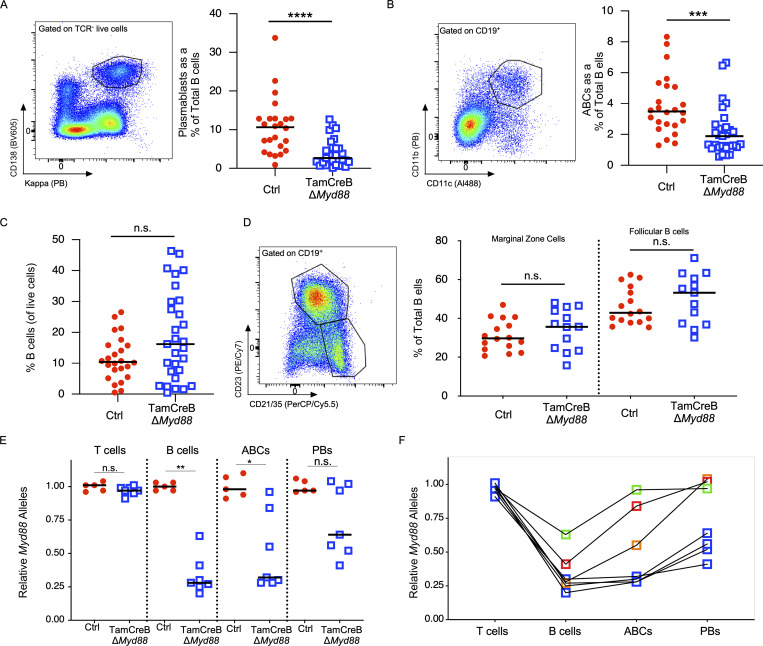
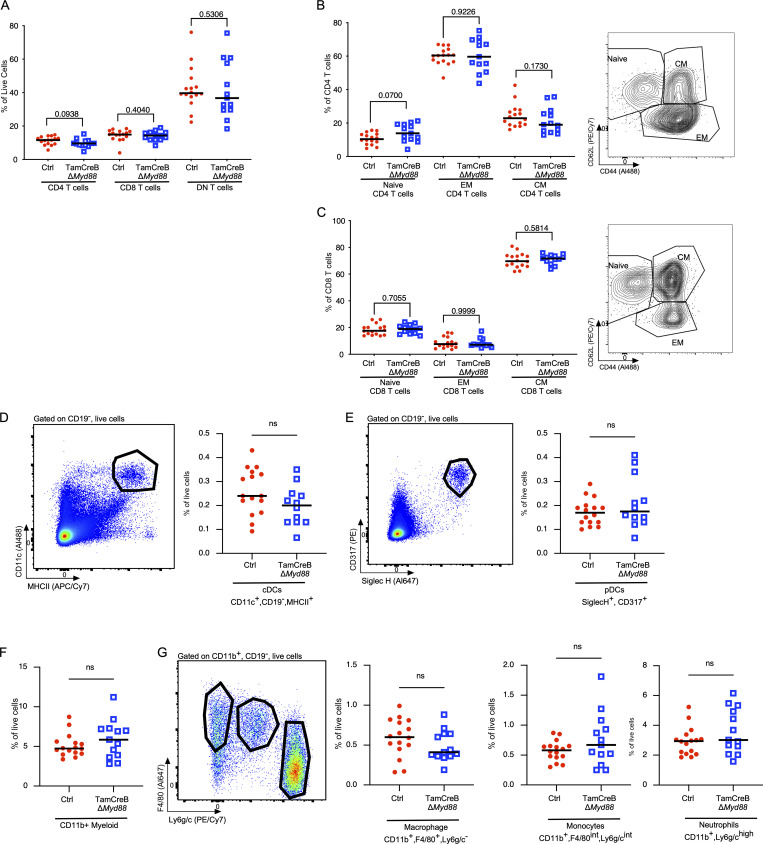
Nucleic acid-specific Toll-like receptors (TLRs) have been implicated in promoting disease pathogenesis in systemic lupus erythematosus (SLE). Whether such TLRs mediate disease onset, progression, or both remains undefined; yet the answer to this question has important therapeutic implications. MyD88 is an essential adaptor that acts downstream of IL-1 family receptors and most TLRs. Both global and B cell-specific Myd88 deficiency ameliorated disease in lupus-prone mice when constitutively deleted. To address whether Myd88 was needed to sustain ongoing disease, we induced B cell-specific deletion of Myd88 after disease onset in MRL.Faslpr mice using an inducible Cre recombinase. B cell-specific deletion of Myd88 starting after disease onset resulted in ameliorated glomerulonephritis and interstitial inflammation. Additionally, treated mice had reduced autoantibody formation and an altered B cell compartment with reduced ABC and plasmablast numbers. These experiments demonstrate the role of MyD88 in B cells to sustain disease in murine lupus. Therefore, targeting MyD88 or its upstream activators may be a viable therapeutic option in SLE.


Conflict of interest statement

Disclosures: The authors declare no competing interests exist.

Figures

None
Graphical abstract
Figure 1.
Figure 1.
Tamoxifen-induced deletion of Myd88 in B cells results in suppressed MyD88 activity. (A) Schematic of experimental design; Tam-hCD20-Cre;-Myd88fl MRL.Faslpr or Cre negative controls were aged up to 12 wk of age, an early disease time point. Mice were then treated 2× per week with tamoxifen 1 mg in corn oil for 8 wk, after which mice were euthanized and assessed for disease endpoints. (B) Tam-hCD20-Cre;-Myd88fl MRL.Faslpr (TamCreB ΔMyd88) (n = 6) or Cre negative controls (Ctrl) (n = 2) were treated for 3 wk with tamoxifen given by oral gavage. Splenocytes were then sorted and analyzed for Myd88 allelic presence by qPCR in the cell populations as indicated: B cells (CD19+, CD90 cells), T cells (CD90+, CD19), cDC (CD19, CD11c+), and PBs (CD90, CD138+, Kappahigh). (C) Splenocytes were isolated from Tam-hCD20-Cre;-Myd88fl MRL.Faslpr (n = 10) or Cre-negative controls (n = 12) and stimulated with CpG DNA (10 μg/ml) for 2 h. Nuclear translocation of NF-κB, a downstream signaling component of the MyD88 pathway, was assessed by Amnis imaging cytometer. In the left panel, representative images of NF-κB and nuclear stain (DAPI) in CD19+ B cells are shown along with representative histograms on the right outlining the NF-κB location relative to the nuclear stain, with colocalization of DAPI and NF-κB signifying activation (represented by a shift of the orange/stimulated histogram to a higher similarity score, representing the overlap between NF-κB and DAPI) with the maintenance of NF-κB in the cytoplasm representing lack of activation (represented by overlap of black (unstimulated) and orange (stimulated) similarity scores on the associated histogram). (D) The median similarity score represents NF-κB nuclear translocation and was graphed for a subset of treated and control mice. Scatter plots display data from individual mice with black lines showing median values. ***P < 0.001, ****P < 0.0001, two-tailed Mann–Whitney U test. Data shown are representative of two independent experiments with n indicated for each experiment shown.
Figure S1.
Figure S1.
Autoantibodies are present in 12-wk-MRL.Faslpr compared with non-autoimmune mice. Serum concentrations of anti-nucleosome, anti-RNA, and anti-Sm in MRL.Faslpr (MRL/lpr; n = 29–30) and B6 mice (n = 15) measured by ELISA at 12-wk of age prior to experimental intervention, Scatter plots display data from individual mice with black lines showing median values, ****P < 0.0001, two-tailed Mann–Whitney U test. Data shown are representative of one to two independent cohorts with data combined from all cohorts. n is indicated for each experiment as shown.
Figure 2.
Figure 2.
B cellintrinsic deletion of Myd88 suppresses autoantibody formation after disease onset and formation of ANA+ B cells. (A) Serum concentrations of anti-nucleosome, anti-RNA, and anti-Sm in MRL.Faslpr mice at 12 wk of age prior to experimental intervention (n = 34–35), Tam-hCD20-Cre;-Myd88fl MRL.Faslpr (TamCreB ΔMyd88) (n = 29), and Cre negative controls after 8 wk of tamoxifen treatment (n = 27) aimed at suppressing Myd88 in the B cell compartment. Scatter plots display data from individual mice with black lines showing median values. **P < 0.01, ***P < 0.001, ****P < 0.0001, Kruskal–Wallis with multiple corrections. (B) Representative HEp-2 ANA staining from the serum of male; Tam-hCD20-Cre;-Myd88fl MRL.Faslpr or Cre negative controls at 20 wk of age after 8 wk of tamoxifen treatment (images are 100× with scale bar representing 50 μm). Data shown are representative of three independent cohorts with data combined from all cohorts and n indicated for each experiment as shown.
Figure 3.
Figure 3.
B cell–specific Myd88 deletion after disease onset results in ameliorated kidney disease. (A–E) Phenotypic markers of disease were assessed in 20-wk-old male Tam-hCD20-Cre;-Myd88fl MRL.Faslpr (TamCreB ΔMyd88) (n = 29) or Cre negative (Ctrl) (n = 27) MRL.Faslpr mice after 8 wk of tamoxifen treatment including (A) dermatitis, (B) proteinuria, (C) glomerular renal disease, (D) interstitial and perivascular renal infiltrates, with (E) representative images of H&E kidney sections from mice of indicated genotype, with black arrowheads indicating interstitial infiltrates and white arrows indicated glomeruli (images are 200× with scale bars representing 50 μm). (F and G) Additional phenotypic endpoints were assessed for each noted genotype including (F) spleen weight and (G) lymph node weight. Scatter plots display data from individual mice with horizontal lines showing median values. *P < 0.05, ***P < 0.001, ****P < 0.0001, two-tailed Mann–Whitney U test, except for proteinuria and dermatitis which were assessed by Chi-squared analysis given their bimodal distribution. Data shown are representative of three independent cohorts with data combined from all cohorts and n indicated for each experiment as shown.
Figure S2.
Figure S2.
Activation of Tam-hCD20-Cre alone produced no significant impact on disease phenotype in murine SLE. (A–G) Serum concentrations of (A) anti-nucleosome, (B) anti-RNA, and (C) anti-Sm were assessed in 20-wk-old male MRL.Faslpr Cre negative (Ctrl) (n = 17) and Tam-hCD20-Cre (TamB) (n = 13) by ELISA after 8 wk of treatment. Similarly, phenotypic markers of the disease were assessed in this same cohort and included (D) dermatitis, (E) proteinuria, (F) glomerular renal disease, and (G) interstitial and perivascular renal infiltrates. (H and I) Additional phenotypic endpoints were assessed for each noted genotype including (H) spleen weight and (I) lymph node weight. Scatter plots display data from individual mice with horizontal lines showing median values. *P < 0.05, two-tailed Mann–Whitney U test. Data shown are representative of two independent cohorts with data combined from all cohorts and n indicated for each experiment as shown.
Figure 4.
Figure 4.
AFCs and ABCs are reduced in mice with B cell–specific Myd88 deletion. The B cell compartment was analyzed for 20-wk-old male Tam-hCD20-Cre;-Myd88fl MRL.Faslpr (TamCreB ΔMyd88) (n = 29) or Cre negative (Ctrl) (n = 27) MRL.Faslpr mice after 8 wk of tamoxifen treatment. (A) Left panel shows the gating strategy for PBs (TCRCD138+,Kappahigh) B cells with % of each subset represented on the right panel. (B) Left panel shows the gating strategy for age-associated B cells (CD19+CD11c+ CD11b+) with % of each subset represented on the right panel. (C) B cells as a percent of total splenocytes were measured and gated as CD19+ cells. (D) Left panel shows gating strategy for follicular (CD19+, CD23+, CD21/35int) and marginal zone (CD19+CD23,CD21/35high) B cells with % of each subset represented on the right panel. (E and F) Tam-hCD20-Cre;-Myd88fl MRL.Faslpr (TamCreB ΔMyd88) (n = 7) or Cre negative controls (Ctrl) (n = 5) were treated for 8 wk with tamoxifen given by oral gavage. Splenocytes were then sorted and analyzed for Myd88 allelic presence by qPCR in the cell populations as indicated: T cells (CD90+, CD19), B cells (CD19+, CD90,CD11c,CD11b,CD138 cells), ABCs (CD19+,CD11c+,CD11b+,CD138), and PB (CD90, CD138+, CD44+). In E, deletion efficiency was compared between experimental or control mice, and in F, deletion efficiency in each subset was compared amongst individual TamCreB ΔMyd88 mice. Scatter plots display data from individual mice with horizontal lines showing median values. *P < 0.05, **P < 0.01, ***P < 0.001, ****P < 0.0001, two-tailed Mann–Whitney U test. Data shown are representative of three independent cohorts with data combined from all cohorts and n indicated for each experiment as shown.
Figure S3.
Figure S3.
Myeloid and T cell distribution and activation profile are not significantly different in mice with B cellspecific Myd88 deletion after disease onset. The T cell compartment was analyzed for 20-wk-old male Tam-hCD20-Cre;-Myd88fl MRL.Faslpr (TamCreB ΔMyd88) (n = 12–13) or Cre negative (Ctrl) (n = 16) MRL.Faslpr mice after 8 wk of tamoxifen treatment. (A–C) Distribution of TCRβ gated population, expressing CD4, CD8, or neither (DN T cells) as a percent of live cells (B) CD4 T cell distributions: naïve (CD62L+, CD44), central memory T cells (TCM) (CD62L+, CD44+), effector memory T cells (TEM) (CD62L, CD44+) as a % of TCRβ+CD4+ T cells, with representative FACS plot in the right panel and (C) CD8 T cells distributions: naïve (CD62L+, CD44), TCM (CD62L+, CD44+), TEM (CD62L, CD44+) as a % of TCRβ+CD8+ T cells with representative FACS plot in the right panel. (D) Distribution of CD11c+, MHCII+, CD19 cDCs as a percent of live cells with representative FACS plot in the left panel. (E) Distribution of CD317+, SiglecH+, CD19 pDCs as a percent of live cells with representative FACS plot in the left panel. (F) Distribution of CD11b+CD19 myeloid cells. (G) Distribution of macrophages CD11b+, F4/80+, Ly6g/c macrophages, CD11b+, F4/80int, Ly6g/cint monocytes, and CD11b+, F4/80, Ly6g/c+ neutrophils as a percent of live cells with representative FACS plot in the left panel. Scatter plots display data from individual mice with horizontal lines showing median values. P values as indicated, using two-tailed Mann–Whitney U test. Data shown are representative of two independent cohorts with data combined from all cohorts and n indicated for each experiment as shown.

References

    1. Ahuja, A., Shupe J., Dunn R., Kashgarian M., Kehry M.R., and Shlomchik M.J.. 2007. Depletion of B cells in murine lupus: Efficacy and resistance. J. Immunol. 179:3351–3361. 10.4049/jimmunol.179.5.3351 - DOI - PubMed
    1. Ahuja, A., Teichmann L.L., Wang H., Dunn R., Kehry M.R., and Shlomchik M.J.. 2011. An acquired defect in IgG-dependent phagocytosis explains the impairment in antibody-mediated cellular depletion in Lupus. J. Immunol. 187:3888–3894. 10.4049/jimmunol.1101629 - DOI - PMC - PubMed
    1. Alexander, T., Sarfert R., Klotsche J., Kühl A.A., Rubbert-Roth A., Lorenz H.M., Rech J., Hoyer B.F., Cheng Q., Waka A., et al. . 2015. The proteasome inhibitior bortezomib depletes plasma cells and ameliorates clinical manifestations of refractory systemic lupus erythematosus. Ann. Rheum. Dis. 74:1474–1478. 10.1136/annrheumdis-2014-206016 - DOI - PMC - PubMed
    1. Christensen, S.R., Shupe J., Nickerson K., Kashgarian M., Flavell R.A., and Shlomchik M.J.. 2006. Toll-like receptor 7 and TLR9 dictate autoantibody specificity and have opposing inflammatory and regulatory roles in a murine model of lupus. Immunity. 25:417–428. 10.1016/j.immuni.2006.07.013 - DOI - PubMed
    1. Fillatreau, S., Manfroi B., and Dörner T.. 2021. Toll-like receptor signalling in B cells during systemic lupus erythematosus. Nat. Rev. Rheumatol. 17:98–108. 10.1038/s41584-020-00544-4 - DOI - PMC - PubMed

Publication types

Substances