. 2023 Nov 8;8(21):e167049.
doi: 10.1172/jci.insight.167049.

The semaphorin 3A/neuropilin-1 pathway promotes clonogenic growth of glioblastoma via activation of TGF-β signaling

Affiliations

The semaphorin 3A/neuropilin-1 pathway promotes clonogenic growth of glioblastoma via activation of TGF-β signaling

Hye-Min Jeon et al. JCI Insight. .

Abstract

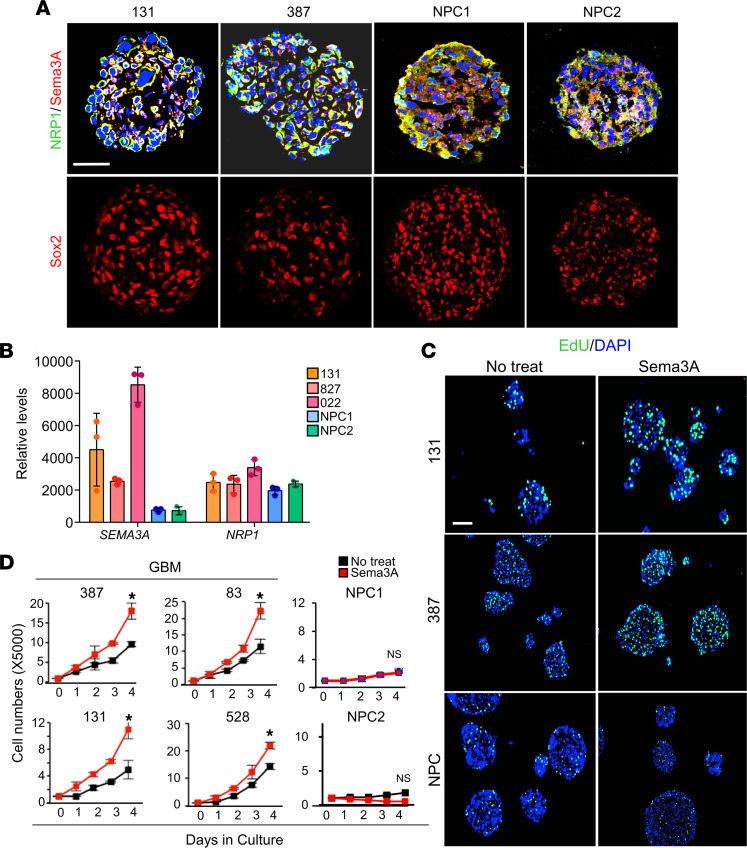
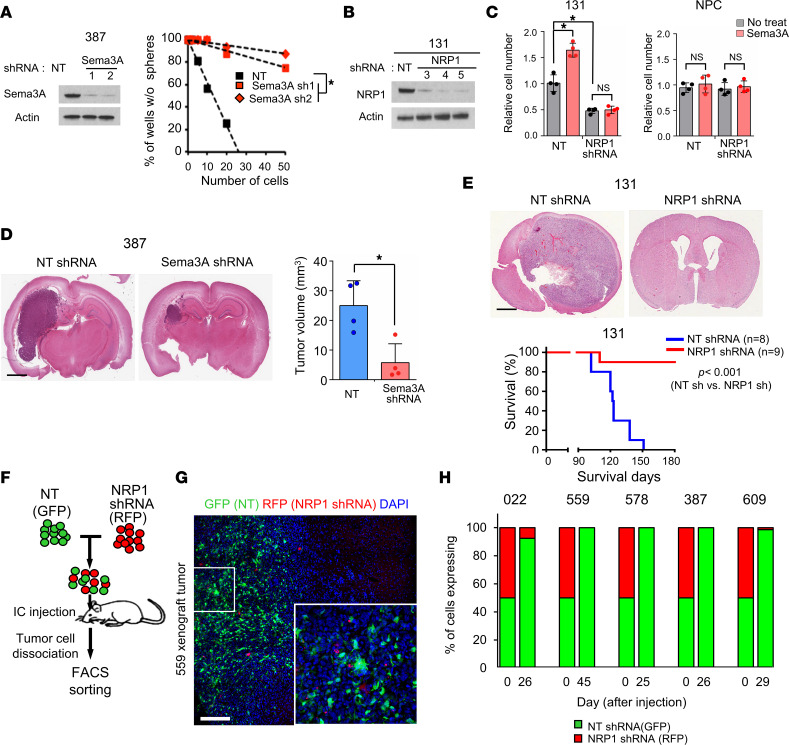
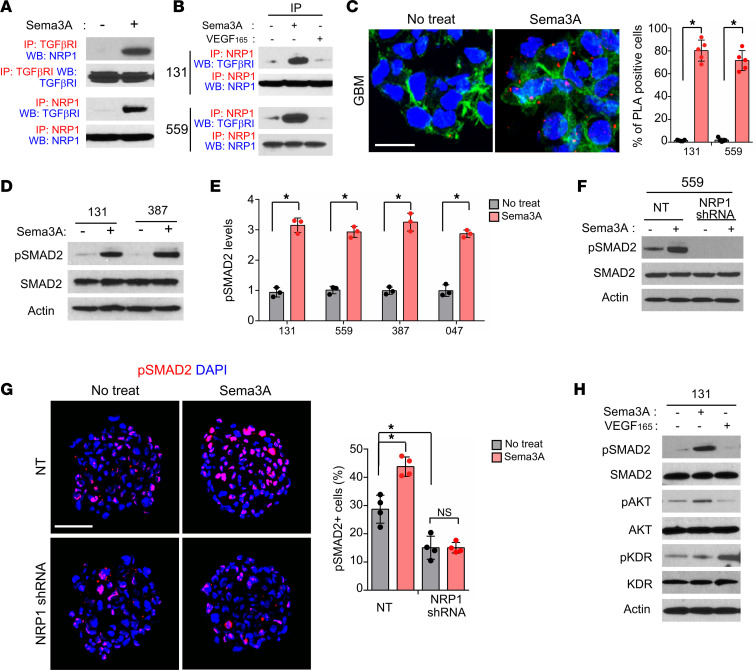
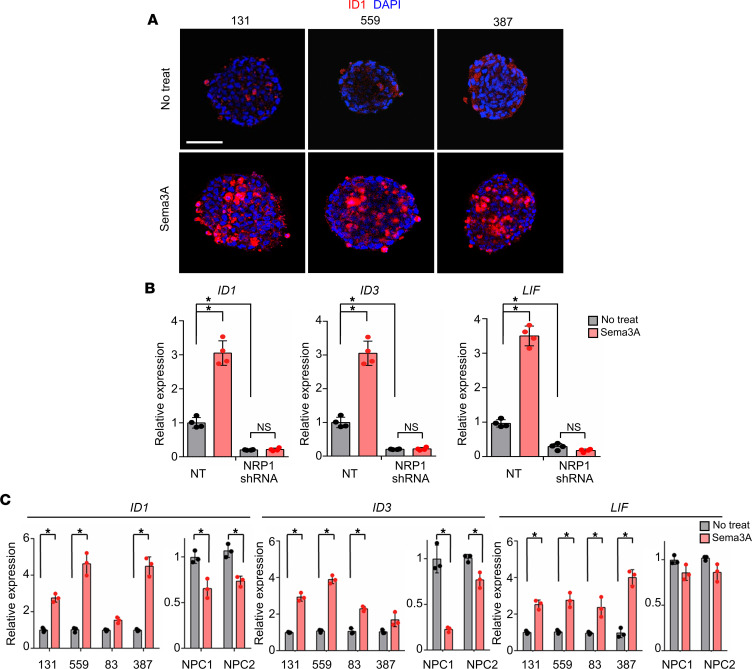
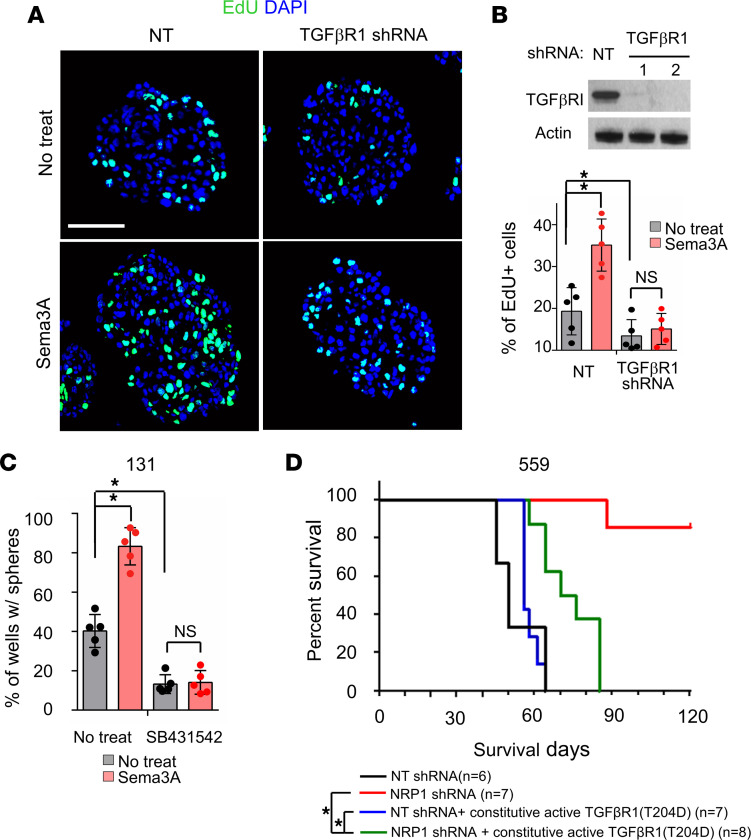
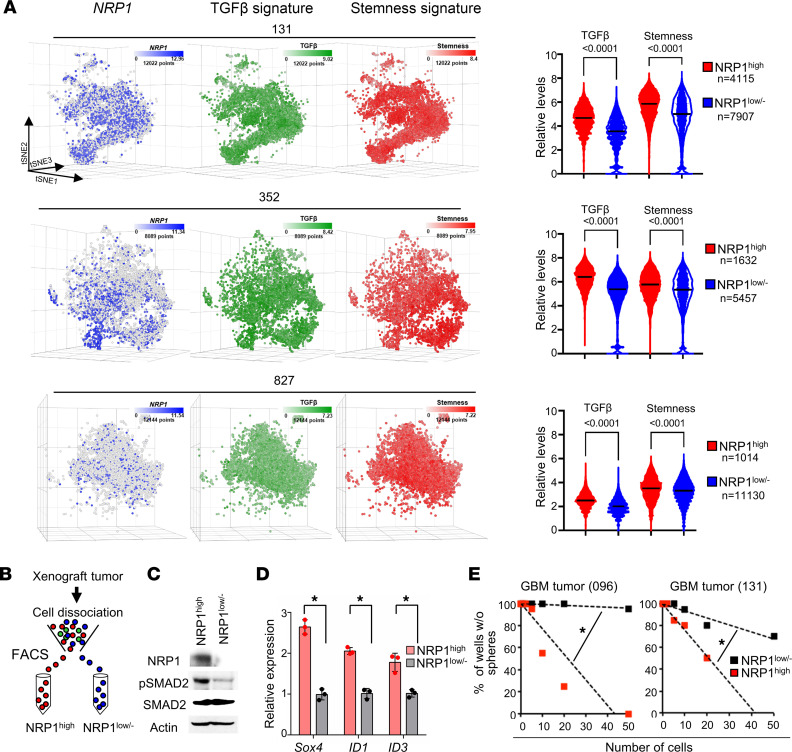
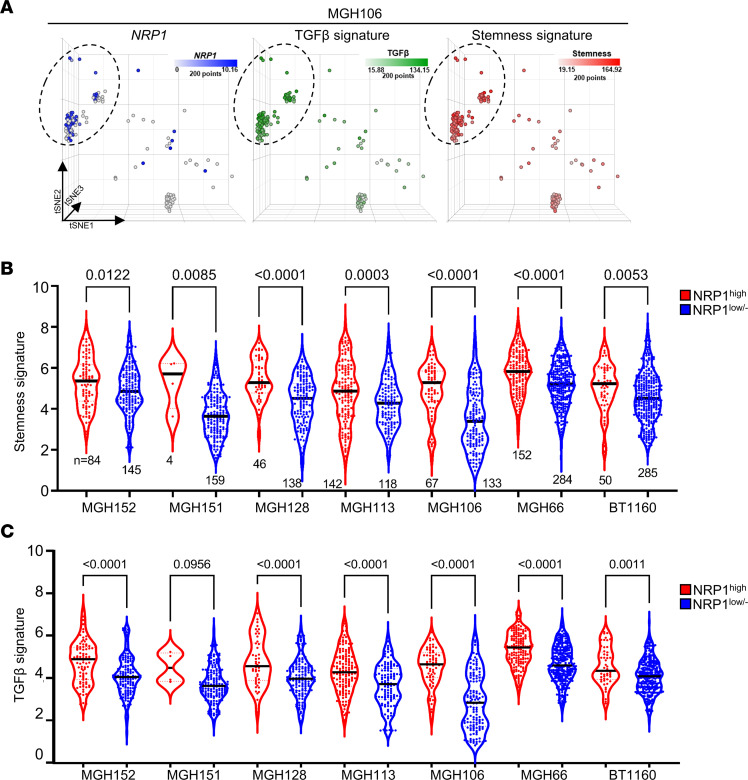
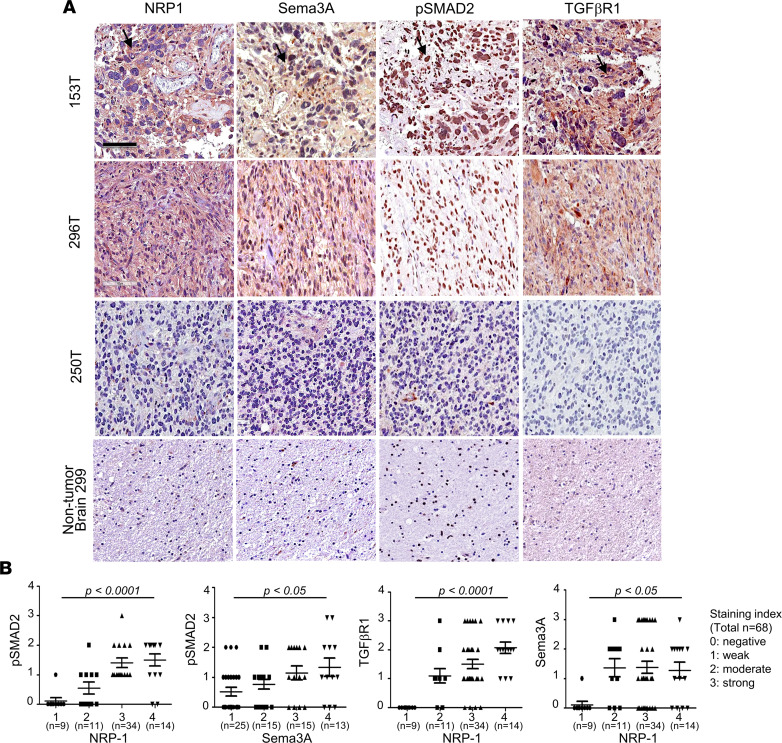
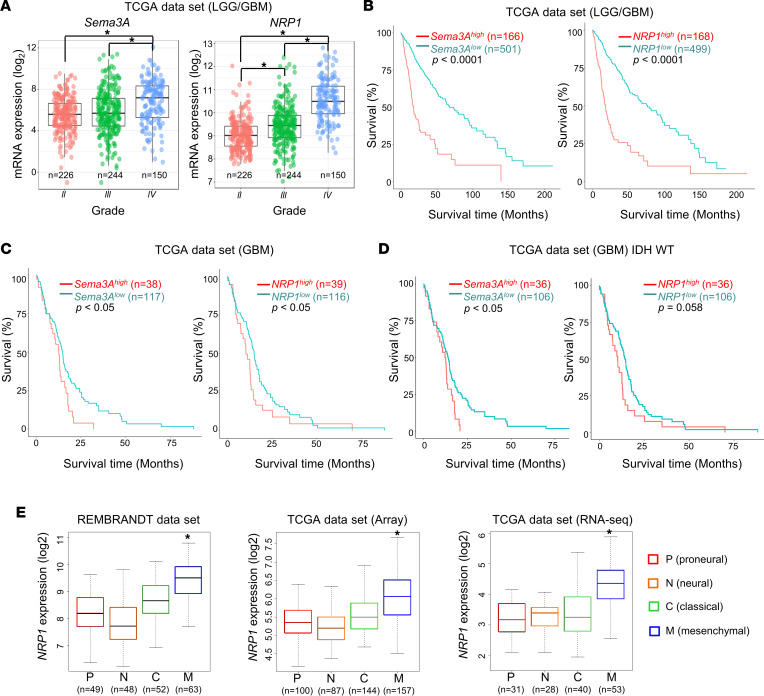
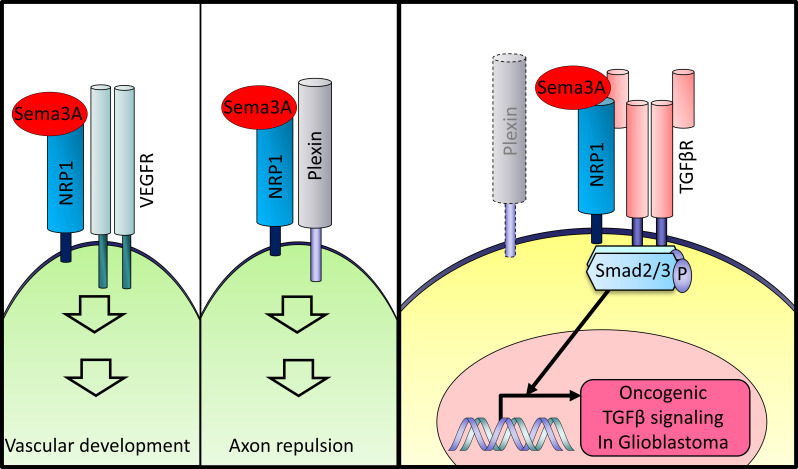
Glioblastoma (GBM) is the most lethal brain cancer with a dismal prognosis. Stem-like GBM cells (GSCs) are a major driver of GBM propagation and recurrence; thus, understanding the molecular mechanisms that promote GSCs may lead to effective therapeutic approaches. Through in vitro clonogenic growth-based assays, we determined mitogenic activities of the ligand molecules that are implicated in neural development. We have identified that semaphorin 3A (Sema3A), originally known as an axon guidance molecule in the CNS, promotes clonogenic growth of GBM cells but not normal neural progenitor cells (NPCs). Mechanistically, Sema3A binds to its receptor neuropilin-1 (NRP1) and facilitates an interaction between NRP1 and TGF-β receptor 1 (TGF-βR1), which in turn leads to activation of canonical TGF-β signaling in both GSCs and NPCs. TGF-β signaling enhances self-renewal and survival of GBM tumors through induction of key stem cell factors, but it evokes cytostatic responses in NPCs. Blockage of the Sema3A/NRP1 axis via shRNA-mediated knockdown of Sema3A or NRP1 impeded clonogenic growth and TGF-β pathway activity in GSCs and inhibited tumor growth in vivo. Taken together, these findings suggest that the Sema3A/NRP1/TGF-βR1 signaling axis is a critical regulator of GSC propagation and a potential therapeutic target for GBM.

Keywords: Brain cancer; Development; Growth factors; Oncogenes; Oncology.


Figures

Figure 1
Figure 1. Sema3A enhances GBM proliferation.
(A) IF images of Sema3A, NRP1, and SRY-box transcription factor 2 (Sox2) in patient-derived 131 and 387 GBM and NPC-derived spheres. (B) Levels of Sema3A and NRP1 mRNA in 131, 827, and 022 GBM cells and NPCs. n = 3. (C) Representative images of EdU incorporation assays using GBM cells and NPCs treated with or without Sema3A (10 ng/mL). Cells labeled with green color are EdU-positive cells. (D) Proliferation assays to determine the effect of rSema3A on growth of GBM cells and NPCs. n = 3. *P < 0.01 by 1-way ANOVA. Data represent mean ± SD. Scale bars: 50 μm.
Figure 2
Figure 2. Sema3A promotes clonogenic growth of GBM cells via NRP1.
(A) Left, IBs of Sema3A in 387 GBM cells transduced with either NT control or Sema3A shRNA-expressing lentivirus. β-Actin was used as a loading control. Right, limiting dilution assay (LDA) analysis to determine clonogenic growth of GBM cells with NT or Sema3A shRNAs. *P < 0.01 by pairwise t test. (B and C) IBs of NRP1 expression and proliferation index in 131 GBM cells transduced with either NT control or NRP1 shRNA-expressing lentivirus. n = 4. *P < 0.01 by 1-way ANOVA with Tukey’s multiple-comparison test. (D) Left, representative H&E brain sections of the mice that were injected with either NT or Sema3A KD cells. Right, quantitation of tumor volumes in the brain sections. n = 4. *P < 0.01 by unpaired, 1-tailed Student’s t test. (E) Top, representative H&E brain sections of the mice that were injected with either NT or NRP1-KD 131 cells. Bottom, Kaplan-Meier survival curves of mice orthotopically implanted with 131 cells transduced with either NT shRNA– (n = 8) or NRP1 shRNA-expressing lentivirus (n = 9). *P < 0.001 by log-rank test. (F) Scheme of in vivo tumor growth competition assay. Equal numbers of NT shRNA–expressing GBM cells (GFP-labeled) and NRP1 shRNA–expressing GBM cells (RFP-labeled) were mixed and injected into the brains of mice. The resultant tumors were dissociated into single cells and processed for FACS analysis. (G) Representative images of 559 xenograft tumor. Inset shows a high-power image. (H) Quantitation of GBM tumors derived from the mixture of NT shRNA– and NRP1 shRNA–expressing cells. Tumors were harvested when the animals showed neurological signs, and tumor latency per each tumor is indicated in x axis. Data represent mean ± SD. Scale bars: 2 mm (D and E), 50 μm (G).
Figure 3
Figure 3. Sema3A activates TGF-β signaling via NRP1-TGF-βR1 interaction.
(A) Co-IP IBs of NRP1 and TGF-βR1 in 131 GBM cells treated with rSema3A. For IP-IB data, Abs used for IP and Western blotting (WB) are labeled as red and blue, respectively. (B) Co-IP IBs of NRP1 and TGF-βRI in GBM cells treated with rSema3A or rVEGF165. (C) Left, representative images of PLAs using anti-NRP1 and anti–TGF-βR1 Abs. Red dots represent the positive signal due to the proximity of 2 added Abs. Alexa Fluor 488–conjugated phalloidin (green) and DAPI (blue) were used to visualize actin cytoskeleton and nuclei, respectively. Right, red dots were counted in 5 random fields and plotted. n = 5. Scale bar: 20 μm. (D and E) IBs of p-SMAD2 and total SMAD2 expression in GBM cells treated with or without rSema3A. n = 3. (F) IBs of p-SMAD2 in the NT control and NRP1-knockdown 559 GBM cells treated with or without rSema3A. (G) Immunostaining and quantitation of p-SMAD2 in the NT control and NRP1-knockdown 131 and 559 GBM cells treated with or without rSema3A. Scale bar: 50 μm. n = 4. (H) IBs of p-SMAD2, total SMAD2, p-KDR, and total KDR in 131 GBM cells treated with rSema3A (50 ng/mL) and rVEGF165 (100 ng/mL). Data represent mean ± SD. *P < 0.01 by 1-way ANOVA in C and E. *P < 0.01 by 1-way ANOVA with Tukey’s multiple-comparison test in G.
Figure 4
Figure 4. The Sema3A/NRP1 axis in GBM activates canonical TGF-β signaling.
(A) Immunostaining images of ID1 in 131, 559, and 387 GBM cells treated with rSema3A. ID1-positive cells are shown in red. Scale bar: 50 μm. (B) Levels of the representative TGF-β pathway genes (ID1, ID3, and LIF) in the NT or NRP1-KD 131 GBM cells. n = 4. (C) Levels of ID1, ID3, and LIF mRNAs in GBM cells and NPCs treated with rSema3A. n = 3. Data represent mean ± SD. *P < 0.01 by 1-way ANOVA with Tukey’s multiple comparison test in B and C.
Figure 5
Figure 5. TGF-βR1 is a key downstream mediator of Sema3A/NRP1 signaling.
(A and B) Representative immunostaining images and quantitation of EdU-positive cells in NT (control) and TGF-βRI–KD GBM cells treated with rSema3A. TGF-βRI KD was confirmed by IB analysis. Scale bar: 50 μm. n = 5. (C) LDA of 131 GBM cells treated with a TGF-βR inhibitor, SB431542 (2 μM), and rSema3A. n = 5. (D) Kaplan-Meier survival curves of mice orthotopically implanted with 559 GBM cells transduced with NT shRNA (control, n = 6), NRP1 shRNA (n = 7), NT shRNA + T204D TGF-βR1 mutant (n = 7), and NRP1 shRNA + T204D TGF-βR1 mutant (n = 8). *P < 0.001 by log-rank test. Data represent mean ± SD. *P < 0.01 by 1-way ANOVA with Tukey’s multiple-comparison test in B and C.
Figure 6
Figure 6. NRP1hi GBM cells are enriched with clonogenicity and TGF-β activity.
(A) Left, t-distributed stochastic neighbor embedding (t-SNE) plots of GBM single cells (131, 352, and 827; total of 31,255 cells). Color gradient was overlaid with NRP1 (blue), TGF-β (green), and stemness (red) signature scores. Right, quantitation of TGF-β and stemness gene set expression in NRP1hi cells and NRP1lo/– GBM cells: 131, 352, and 827. Internal line represents median value. *P < 0.0001 by Mann-Whitney test. (B) FACS-based segregation of NRP1hi and NRP1lo/– cells from GBM tumors. (C) IBs of NRP1, p-SMAD2, and SMAD2 in NRP1hi and NRP1lo/– cells derived from primary GBM tumor 096. (D) Relative levels of Sox4, ID1, and ID3 in NRP1hi cells and NRP1lo/– GBM cells (096). Data represent mean ± SD. *P < 0.01 by 1-way ANOVA. (E) LDA analysis of NRP1hi and NRP1lo/– cells derived from GBM tumors (096 and 131). Estimated frequency of clonogenic cells in each subpopulation was calculated by extreme LDA. *P < 0.01 by pairwise t test.
Figure 7
Figure 7. NRP1hi cells are enriched with stemness and TGF-β signatures in primary specimens of patients with GBM.
(A) t-SNE plots of tumor of patient with MGH106. Color gradient was overlaid with NRP1 (blue), TGF-β (green), and stemness (red) signature scores. (B and C) Relative levels of the stemness and TGF-β signaling scores in the NRP1hi and matched NRP1lo/– subpopulations derived from 7 different tumors of patients with GBM. Internal line represents median value. P values were determined by Mann-Whitney test.
Figure 8
Figure 8. Expression of Sema3A/NRP1 signaling components in GBM.
(A) Representative IHC images of NRP1, Sema3A, p-SMAD2, and TGF-βR1 using 3 GBM specimens — 153, 296, and 250 — and a nontumor brain tissue. Brown staining indicates immunopositivity for the indicated Ab. Scale bar: 100 μm. (B) Correlations between the expression levels of each of the Sema3A/NRP1 signaling components. Staining intensity of each IHC using Abs against NRP1, Sema3A, p-SMAD2, and TGF-βR1 in GBM specimens (n = 68) was determined and grouped: 0, negative; 1, weak; 2, moderate; 3, strong; and 4, very strong. Data are represented as vertical scattered plots using GraphPad Prism. Average intensity and SD are shown for the indicated Ab. P values were obtained using 2-way ANOVA.
Figure 9
Figure 9. Association between Sema3A/NRP1 levels and survival of patients with glioma and GBM subtype.
(A) Box-and-whisker plots showing mRNA levels of Sema3A and NRP1 in LGG and GBM specimens in TCGA data set (n = 620). *P < 0.0001 by pairwise t test. (B) Kaplan-Meier survival curves of patients with LGG and GBM (n = 667) based on the expression levels of Sema3A or NRP1 mRNA. High and low subgroups were operationally defined as the upper quartile (top 25%) and the rest, respectively. *P < 0.0001 by log-rank analysis. (C and D) Kaplan-Meier survival curves of patients with GBM and the WT IDH1/2-containing GBMs based on the levels of Sema3A or NRP1 mRNA. *P < 0.05 by log-rank analysis. (E) Box-and-whisker plots of NRP1 mRNA expression in 4 representative GBM subtypes. Repository of Molecular Brain Neoplasia Data (REMBRANDT) and TCGA (microarray data and RNA-Seq data sets, separately) databases were used to determine NRP1 mRNA levels in each subtype of GBM. *P < 0.01 (mesenchymal subtype vs. other subtypes) by 1-way ANOVA with Tukey’s multiple-comparison test.
Figure 10
Figure 10. Roles of the Sema3A/NRP1 axis in developmental processes and GBM.
Diagrams of the Sema3A and the associated protein complex in different biological programs and GBM.

References

    1. Stupp R, et al. Radiotherapy plus concomitant and adjuvant temozolomide for glioblastoma. N Engl J Med. 2005;352(10):987–996. doi: 10.1056/NEJMoa043330. - DOI - PubMed
    1. Cruz Da Silva E, et al. A systematic review of glioblastoma-targeted therapies in phases II, III, IV clinical trials. Cancers (Basel) 2021;13(8):1795. doi: 10.3390/cancers13081795. - DOI - PMC - PubMed
    1. Singh SK, et al. Identification of human brain tumour initiating cells. Nature. 2004;432(7015):396–401. doi: 10.1038/nature03128. - DOI - PubMed
    1. Bao S, et al. Glioma stem cells promote radioresistance by preferential activation of the DNA damage response. Nature. 2006;444(7120):756–760. doi: 10.1038/nature05236. - DOI - PubMed
    1. Takebe N, et al. Targeting Notch, Hedgehog, and Wnt pathways in cancer stem cells: clinical update. Nat Rev Clin Oncol. 2015;12(8):445–464. doi: 10.1038/nrclinonc.2015.61. - DOI - PMC - PubMed

Publication types