. 2023 Dec 1;133(23):e163464.
doi: 10.1172/JCI163464.

A splice-switching oligonucleotide treatment ameliorates glycogen storage disease type 1a in mice with G6PC c.648G>T

Affiliations

A splice-switching oligonucleotide treatment ameliorates glycogen storage disease type 1a in mice with G6PC c.648G>T

Kentaro Ito et al. J Clin Invest. .

Abstract

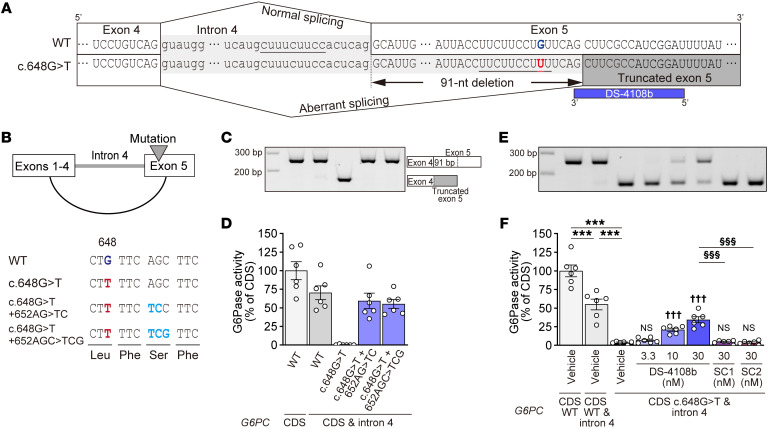
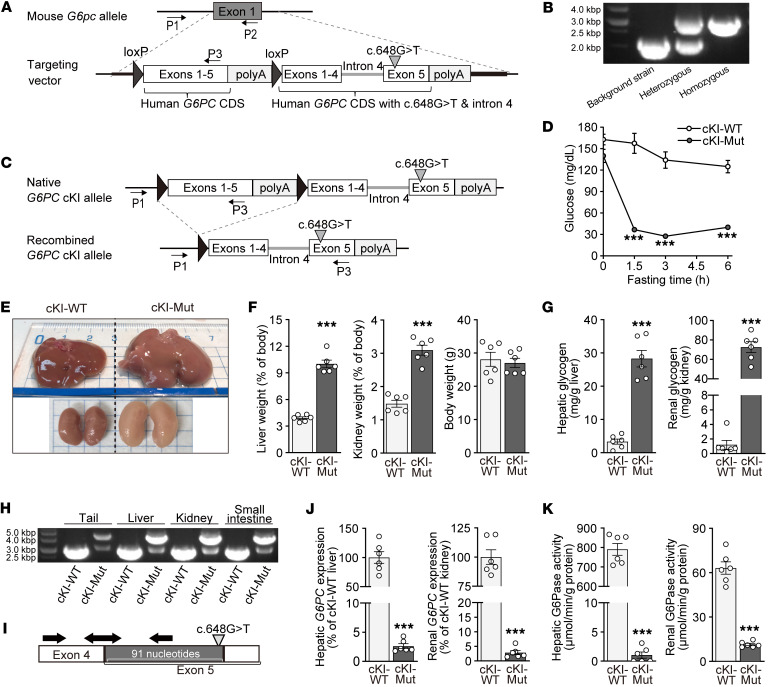
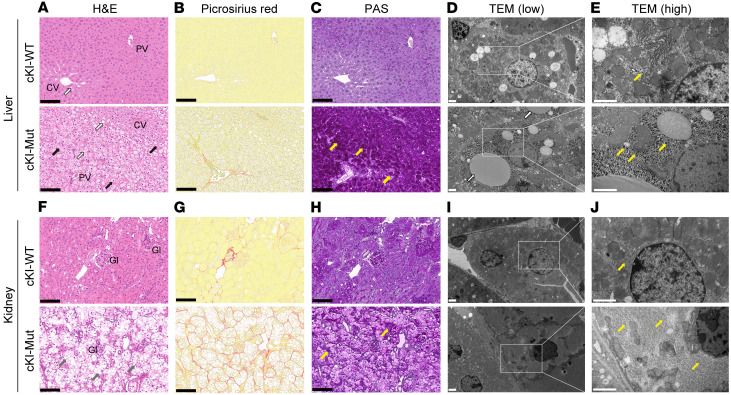
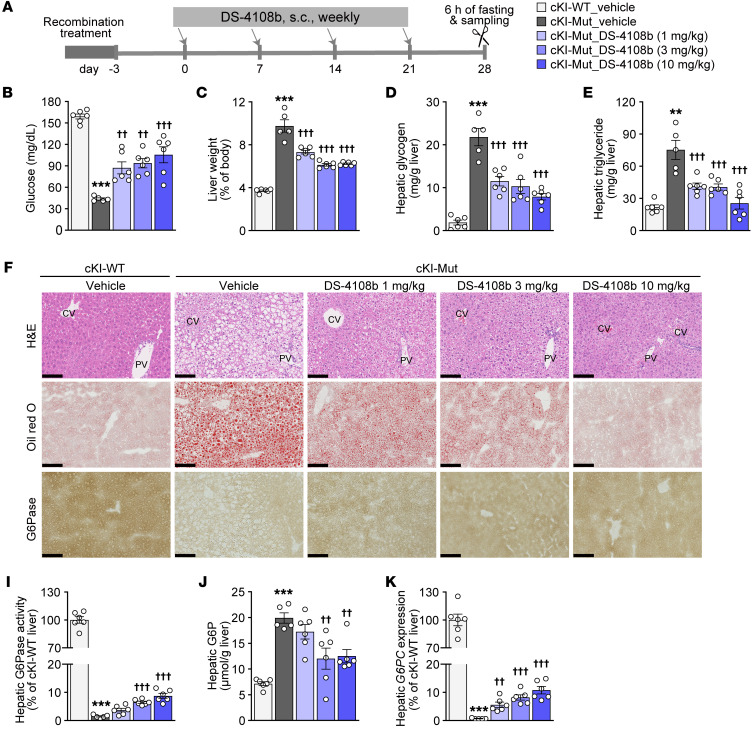
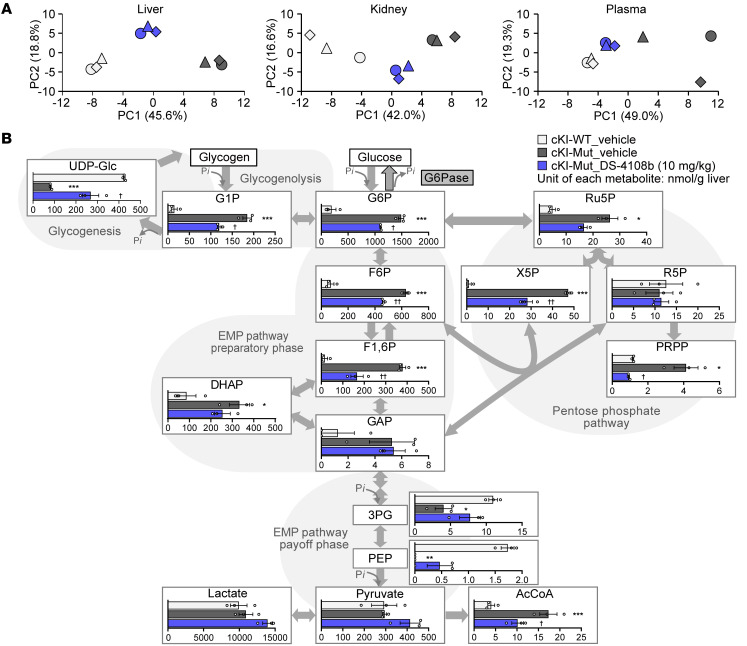
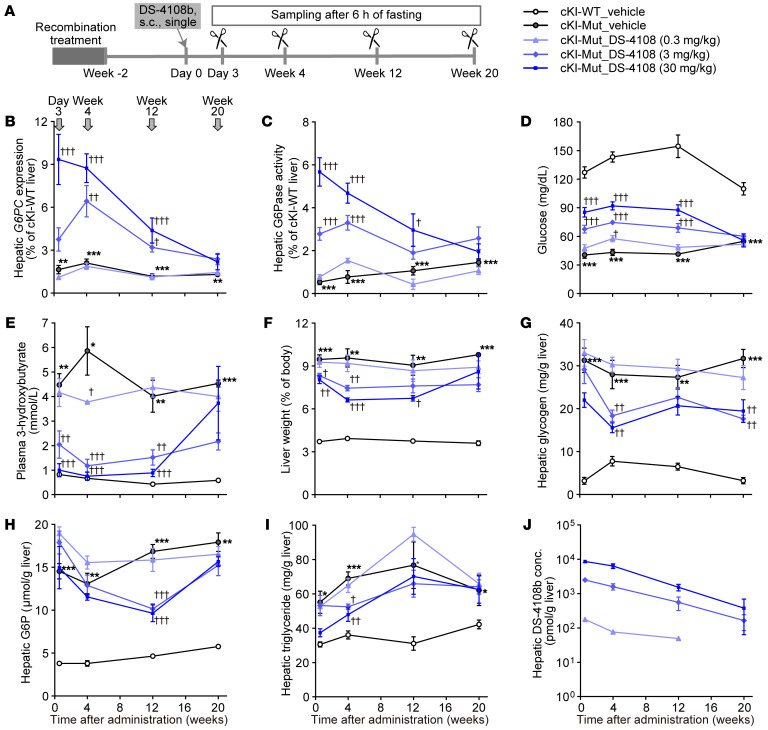
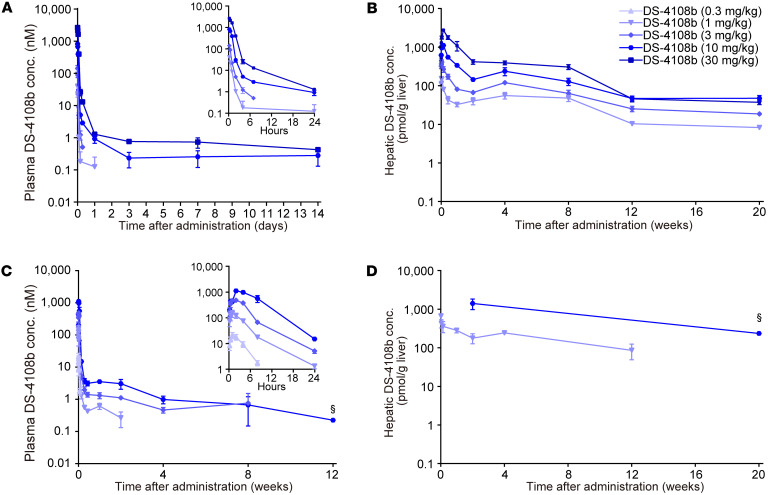
Glycogen storage disease type 1a (GSD1a) is caused by a congenital deficiency of glucose-6-phosphatase-α (G6Pase-α, encoded by G6PC), which is primarily associated with life-threatening hypoglycemia. Although strict dietary management substantially improves life expectancy, patients still experience intermittent hypoglycemia and develop hepatic complications. Emerging therapies utilizing new modalities such as adeno-associated virus and mRNA with lipid nanoparticles are under development for GSD1a but potentially require complicated glycemic management throughout life. Here, we present an oligonucleotide-based therapy to produce intact G6Pase-α from a pathogenic human variant, G6PC c.648G>T, the most prevalent variant in East Asia causing aberrant splicing of G6PC. DS-4108b, a splice-switching oligonucleotide, was designed to correct this aberrant splicing, especially in liver. We generated a mouse strain with homozygous knockin of this variant that well reflected the pathophysiology of patients with GSD1a. DS-4108b recovered hepatic G6Pase activity through splicing correction and prevented hypoglycemia and various hepatic abnormalities in the mice. Moreover, DS-4108b had long-lasting efficacy of more than 12 weeks in mice that received a single dose and had favorable pharmacokinetics and tolerability in mice and monkeys. These findings together indicate that this oligonucleotide-based therapy could provide a sustainable and curative therapeutic option under easy disease management for GSD1a patients with G6PC c.648G>T.

Keywords: Gene therapy; Genetic diseases; Glucose metabolism; Metabolism; Therapeutics.


Conflict of interest statement

Conflict of interest: KI, CK, MI, Y Sekiguchi, YN, KW, HY, SK, YF, KG, Y Sogawa, MO, HN, ST, TN, M Kakuta, TM, YO, M Koizumi, and KT are employees of Daiichi Sankyo Co., Ltd. SO has received commission fees from Daiichi Sankyo Co., Ltd. MM reports being employed by Kobe Gakuin University, which received funding from KNC Laboratories Inc. (Kobe, Japan), and being a scientific adviser for Daiichi Sankyo Co., Ltd. (Tokyo, Japan) and JCR Pharma Co., Ltd. (Ashiya, Japan). KI, MI, Y Sekiguchi, ST, TM, YO, M Koizumi, and MM are inventors on a patent and patent application PCT/JP2019/008713, WO/2019/172286, entitled “Therapeutic agent for glycogen storage disease type Ia” that covers therapeutic agents to correct the aberrant splicing due to G6PC c.648G>T. GT, MT, and SO are inventors on a patent and patent application PCT/JP2018/009326, WO/2018/164275, entitled “Antisense oligonucleotide and composition for prevention or treatment of glycogen storage disease type Ia” that covers therapeutic agents to correct the aberrant splicing due to G6PC c.648G>T. No funding other than from Daiichi Sankyo Co., Ltd. was obtained for this study.

Figures

Figure 1
Figure 1. Aberrant splicing caused by G6PC c.648G>T and correction by additional mutations or splice-switching oligonucleotide.
(A) G6PC pre-mRNA sequences around the junctions of exon 4–intron 4 and intron 4–exon 5. Sequences with underlining indicate the polypyrimidine tract. The blue bar represents DS-4108b. (B) Structure of G6PC expression plasmid and sequences around the inserted mutations. Black and dark blue letters indicate nucleotides from the WT G6PC sequence, while red and light blue letters represent replaced nucleotides. (C and E) Agarose gel electrophoresis of RT-PCR products and (D and F) G6Pase activities of the cell lysates relative to the mean of the WT G6PC CDS expression plasmid–transfected group. Quantification data of G6Pase activities are presented as the mean ± SEM (n = 6). (F) For the vehicle-treated groups, Tukey’s multiple-comparison test was performed (***P < 0.001). For the groups transfected with G6PC plasmid containing c.648G>T and intron 4, Dunnett’s multiple-comparison test was performed to compare the DS-4108b– and semiscrambled control ASO–treated groups with the vehicle-treated group (†††P < 0.001; NS, P > 0.05) and the SC1- and SC2-treated groups with the 30 nM DS-4108b–treated group (§§§P < 0.001).
Figure 2
Figure 2. Generation and evaluation of G6PC c.648G>T–cKI mice.
(A) KI scheme of the human G6PC gene cassette. Arrows with P1, P2, and P3 indicate the genotyping primers. (B) Agarose gel electrophoresis of genotyping PCR of mouse ear DNA with the P1, P2, and P3 primers. Amplicons around 2,000 and 3,000 bp are represented as mouse G6pc- and G6PC-cKI alleles, respectively. (C) Schematic diagrams of Cre/loxP recombination in the G6PC-cKI allele. (D) Blood glucose levels in a 6-hour fasting test. (E) Representative images of whole liver and kidneys. (F) Weights of liver, both kidneys, and body. (G) Glycogen concentration. (H) Agarose gel electrophoresis of genotyping PCR of DNA from tissues with P1 and P3. Amplicons around 3,000 and 4,500 bp are represented as the native and recombined G6PC-cKI alleles, respectively. (I) Hybridizing sites of specific primers (right and left arrows) and probe (double-headed arrow) for correctly spliced G6PC mRNA. (J) Relative expression levels of correctly spliced G6PC mRNA. (K) G6Pase activity. All quantification results are presented as the mean ± SEM (n = 6) and were analyzed by unpaired, 2-tailed t test to compare cKI-WT and cKI-Mut mice. ***P < 0.001.
Figure 3
Figure 3. Histopathology of liver and kidney in cKI-WT and cKI-Mut mice.
(AC and FH) Representative stained formalin-fixed, paraffin-embedded (FFPE) sections of liver and kidney from cKI-WT and cKI-Mut mice. H&E-stained liver (A) and kidney (F). CV, PV, and Gl represent central vein, portal vein, and glomerulus, respectively. White and gray arrows indicate lipid droplets and vacuolar degeneration, respectively. Picrosirius red–stained liver (B) and kidney (G). Red-stained areas show collagen fibers. PAS-stained liver (C) and kidney (H). All black and yellow arrows indicate stored glycogen. Black scale bars: 100 μm. (D, E, I, and J) Representative TEM images of liver (D and E) and kidney (I and J) from cKI-WT and cKI-Mut mice. Black dots indicated by yellow arrows are granules. White scale bars: 2 μm.
Figure 4
Figure 4. Therapeutic effect of multiple doses of DS-4108b on cKI-Mut mice.
(A) Experimental design. (B) Blood glucose levels after 6 hours of fasting. (C) Liver weight relative to BW. (D and E) Hepatic concentrations of glycogen (D) and triglycerides (E). (F) FFPE liver sections with H&E staining. CV, central vein; PV, portal vein. (G and H) Fresh-frozen liver sections with Oil Red O staining (G) and G6Pase activity staining (brown coloration is proportional to the G6Pase activity) (H). Scale bars: 100 μm. (I) Hepatic G6Pase activity relative to the mean of the cKI-WT mouse group. (J) Hepatic G6P concentration. (K) Gene expression of correctly spliced human G6PC in liver relative to the mean of the cKI-WT mouse group. For all bar graph panels, quantification results are presented as the mean ± SEM (n = 5–6). The vehicle-treated cKI-Mut mouse group was compared with the vehicle-treated cKI-WT mouse group by unpaired, 2-tailed t test; *P < 0.01 and ***P < 0.001. DS-4108b–treated cKI-Mut mouse groups were compared with the vehicle-treated cKI-Mut mouse group by Dunnett’s multiple-comparison test; ††P < 0.01 and †††P < 0.001.
Figure 5
Figure 5. Metabolomics analysis of liver, kidney, and plasma from cKI-Mut mice given multiple doses of DS-4108b.
(A) The first and second principal components (PC1 and PC2, respectively) of liver, kidney, and plasma in the PCA. Plots from the same individual are presented as the same shape with the same color. Shapes filled with light gray, dark gray, or blue represent groups of vehicle-treated cKI-WT mice, vehicle-treated cKI-Mut mice, and cKI-Mut mice treated with DS-4108b at 10 mg/kg, respectively. (B) Metabolic flux changes of key hepatic metabolites for glycogen metabolism, the EMP pathway, and the pentose phosphate pathway. Quantification results are presented as the mean (nmol/g liver) ± SEM (n = 3). The vehicle-treated cKI-Mut mouse group was compared with the vehicle-treated cKI-WT mouse group using an unpaired, 2-tailed t test. *P < 0.05, **P < 0.01, and ***P < 0.001. DS-4108b–treated cKI-Mut mouse groups were compared with vehicle-treated cKI-Mut mouse group using an unpaired, 2-tailed t test. P < 0.05 and ††P < 0.01. The abbreviations for each metabolite are defined in the Supplemental Methods.
Figure 6
Figure 6. Time-dependent changes of the effect of a single administration of DS-4108b to cKI-Mut mice.
(A) Experimental design. (B and C) Gene expression of correctly spliced human G6PC (B) and hepatic G6Pase activity (C) relative to those of the cKI-WT mouse group on the same sampling day. (DJ) Blood glucose levels (D), plasma 3-hydroxybutyrate levels (E), liver weight relative to BW (F), and hepatic concentrations of glycogen (G), G6P (H), triglycerides (I), and total oligonucleotides originating from DS-4108b, shown as DS-4108b concentration (conc.) (J) on the sampling days. For all line graph panels, the quantification results are presented as the mean ± SEM (n = 4–5). The vehicle-treated cKI-Mut mouse group was compared with the vehicle-treated cKI-WT mouse group using an unpaired, 2-tailed t test at each sampling point. *P < 0.05, **P < 0.01, and ***P < 0.001. DS-4108b–treated cKI-Mut mouse groups were compared with the vehicle-treated cKI-Mut mouse group by Dunnett’s multiple-comparison test at each sampling point. P < 0.05, ††P < 0.01, and †††P < 0.001.
Figure 7
Figure 7. Plasma and liver PK in mice and monkeys following a single administration of DS-4108b.
(AD) Concentration of total oligonucleotides originating from DS-4108b, shown as DS-4108b concentration, in mouse plasma (A), mouse liver (B), monkey plasma (C), and monkey liver (D). Quantification results are presented as the mean ± SEM (n = 3–4), except for points marked with § in C and D, which show the mean (n = 2).

Similar articles

Cited by

References

    1. Burda P, Hochuli M. Hepatic glycogen storage disorders: what have we learned in recent years? Curr Opin Clin Nutr Metab Care. 2015;18(4):415–421. doi: 10.1097/MCO.0000000000000181. - DOI - PubMed
    1. Visser G, et al. Consensus guidelines for management of glycogen storage disease type 1b - European Study on Glycogen Storage Disease Type 1. Eur J Pediatr. 2002;161 Suppl 1:S120–123. doi: 10.1007/s00431-002-1017-6. - DOI - PubMed
    1. Kishnani PS, et al. Diagnosis and management of glycogen storage disease type I: a practice guideline of the American College of Medical Genetics and Genomics. Genet Med. 2014;16(11):e1. doi: 10.1038/gim.2014.128. - DOI - PubMed
    1. Derks TGJ, et al. Glycogen storage disease type Ia: current management options, burden and unmet needs. Nutrients. 2021;13(11):3828. doi: 10.3390/nu13113828. - DOI - PMC - PubMed
    1. Kasapkara Ç S, et al. Continuous glucose monitoring in children with glycogen storage disease type I. Eur J Clin Nutr. 2014;68(1):101–105. doi: 10.1038/ejcn.2013.186. - DOI - PubMed

Supplementary concepts