Shear force enhances adhesion of Pseudomonas aeruginosa by counteracting pilus-driven surface departure
- PMID: 37788310
- PMCID: PMC10576114
- DOI: 10.1073/pnas.2307718120
Shear force enhances adhesion of Pseudomonas aeruginosa by counteracting pilus-driven surface departure
Abstract
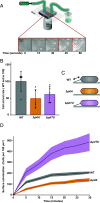
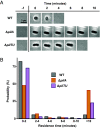
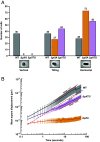
Fluid flow is thought to prevent bacterial adhesion, but some bacteria use adhesins with catch bond properties to enhance adhesion under high shear forces. However, many studies on bacterial adhesion either neglect the influence of shear force or use shear forces that are not typically found in natural systems. In this study, we use microfluidics and single-cell imaging to examine how the human pathogen Pseudomonas aeruginosa interacts with surfaces when exposed to shear forces typically found in the human body (0.1 pN to 10 pN). Through cell tracking, we demonstrate that the angle between the cell and the surface predicts if a cell will depart the surface. We discover that at lower shear forces, type IV pilus retraction tilts cells away from the surface, promoting surface departure. Conversely, we show that higher shear forces counterintuitively enhance adhesion by counteracting type IV pilus retraction-dependent cell tilting. Thus, our results reveal that P. aeruginosa exhibits behavior reminiscent of a catch bond, without having a specific adhesin that is enhanced by force. Instead, P. aeruginosa couples type IV pilus dynamics and cell geometry to tune adhesion to its mechanical environment, which likely provides a benefit in dynamic host environments.
Keywords: Pseudomonas aeruginosa; adhesion; microfluidics; shear force; type IV pili.
Conflict of interest statement
The authors declare no competing interest.
Figures


Update of
-
Shear force enhances adhesion of Pseudomonas aeruginosa by counteracting pilus-driven surface departure.bioRxiv [Preprint]. 2023 May 8:2023.05.08.539440. doi: 10.1101/2023.05.08.539440. bioRxiv. 2023. Update in: Proc Natl Acad Sci U S A. 2023 Oct 10;120(41):e2307718120. doi: 10.1073/pnas.2307718120. PMID: 37215027 Free PMC article. Updated. Preprint.
Similar articles
-
Shear force enhances adhesion of Pseudomonas aeruginosa by counteracting pilus-driven surface departure.bioRxiv [Preprint]. 2023 May 8:2023.05.08.539440. doi: 10.1101/2023.05.08.539440. bioRxiv. 2023. Update in: Proc Natl Acad Sci U S A. 2023 Oct 10;120(41):e2307718120. doi: 10.1073/pnas.2307718120. PMID: 37215027 Free PMC article. Updated. Preprint.
-
Nanoscale adhesion forces of Pseudomonas aeruginosa type IV Pili.ACS Nano. 2014 Oct 28;8(10):10723-33. doi: 10.1021/nn5044383. Epub 2014 Oct 6. ACS Nano. 2014. PMID: 25286300 Free PMC article.
-
Mechanical forces and ligand binding modulate Pseudomonas aeruginosa PilY1 mechanosensitive protein.Life Sci Alliance. 2025 Mar 7;8(5):e202403111. doi: 10.26508/lsa.202403111. Print 2025 May. Life Sci Alliance. 2025. PMID: 40054876 Free PMC article.
-
The type-4 pilus is the major virulence-associated adhesin of Pseudomonas aeruginosa--a review.Gene. 1997 Jun 11;192(1):99-108. doi: 10.1016/s0378-1119(97)00116-9. Gene. 1997. PMID: 9224879 Review.
-
How Bacteria Use Type IV Pili Machinery on Surfaces.Trends Microbiol. 2015 Dec;23(12):775-788. doi: 10.1016/j.tim.2015.09.002. Epub 2015 Oct 22. Trends Microbiol. 2015. PMID: 26497940 Review.
Cited by
-
Flow-induced bending of flagella controls bacterial surface behavior.bioRxiv [Preprint]. 2025 Jan 8:2025.01.07.631359. doi: 10.1101/2025.01.07.631359. bioRxiv. 2025. PMID: 39829777 Free PMC article. Preprint.
-
Advancements and Challenges in Modeling Mechanobiology in Intestinal Host-Microbiota Interaction.ACS Appl Mater Interfaces. 2025 Jun 4;17(22):31698-31713. doi: 10.1021/acsami.4c20961. Epub 2025 May 18. ACS Appl Mater Interfaces. 2025. PMID: 40382722 Review.
-
Functional Analysis of the Major Pilin Proteins of Type IV Pili in Streptococcus sanguinis CGMH010.Int J Mol Sci. 2024 May 15;25(10):5402. doi: 10.3390/ijms25105402. Int J Mol Sci. 2024. PMID: 38791440 Free PMC article.
-
Bacterial species with different nanocolony morphologies have distinct flow-dependent colonization behaviors.Proc Natl Acad Sci U S A. 2025 Feb 18;122(7):e2419899122. doi: 10.1073/pnas.2419899122. Epub 2025 Feb 10. Proc Natl Acad Sci U S A. 2025. PMID: 39928871 Free PMC article.
-
Combining multiple stressors blocks bacterial migration and growth.Curr Biol. 2024 Dec 16;34(24):5774-5781.e4. doi: 10.1016/j.cub.2024.10.029. Epub 2024 Nov 15. Curr Biol. 2024. PMID: 39549703
References
-
- Conrad J. C., Poling-Skutvik R., Confined flow: Consequences and implications for bacteria and biofilms. Annu. Rev. Chem. Biomol. Eng. 9, 175–200 (2018). - PubMed
-
- Wheeler J. D., Secchi E., Rusconi R., Stocker R., Not just going with the flow: The effects of fluid flow on bacteria and plankton. Annu. Rev. Cell Dev. Biol. 35, 213–237 (2019). - PubMed
Publication types
MeSH terms
Substances
Grants and funding
LinkOut - more resources
Full Text Sources

